2. Institute for Ship Structural Design and Analysis, Hamburg University of Technology, Hamburg 21073, Germany;
3. Department of Ocean Operations and Civil Engineering, Norwegian University of Science and Technology, Ålesund 6025, Norway
1 Introduction
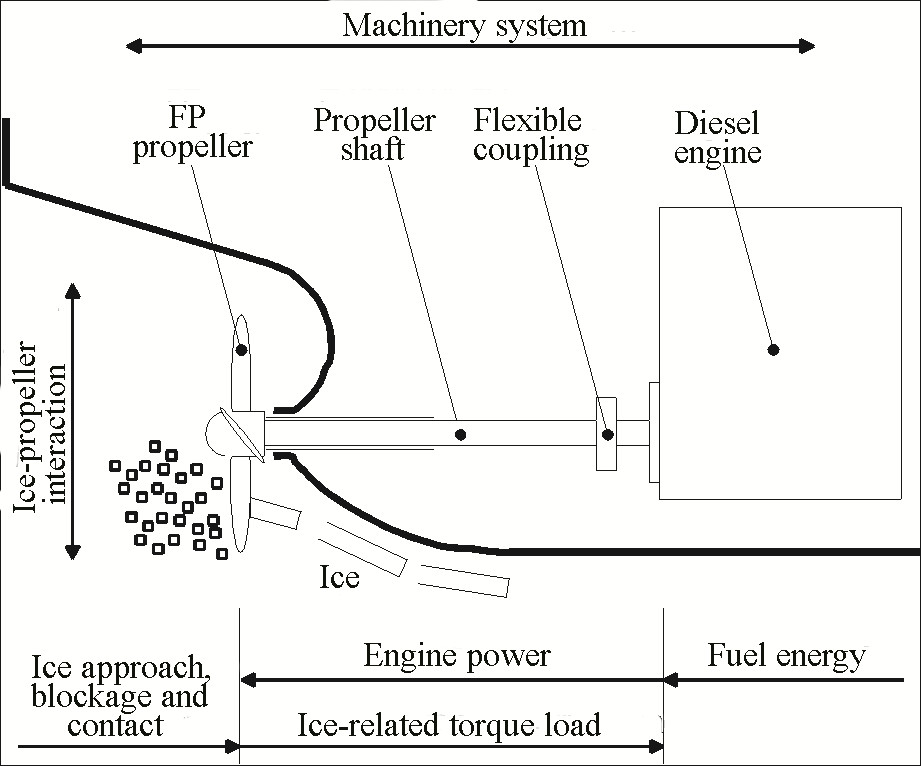
The operation of a ship in ice-covered waters often results in the submergence of broken ice pieces at the bow of the ship. As the ship moves through the ice field, the propeller approaches to the submerged pieces of ice, and interference between the ice pieces and the propeller can occur. Figure 1 illustrates this process, which is usually referred to as ice-propeller interaction (Veitch, 1995; Wang, 2007), where the ice-related load is generated as the submerged ice pieces approach, block, and contact the propeller. The ice-related load, together with the hydrodynamic load from the open water condition, is transmitted further to the diesel engine or electrical motor through the mechanical transmission line, which commonly consists of a flexible coupling and propeller shaft.
|
| Figure 1 Propulsion machinery system in ice and energy propagation in the system |
At the same time as the propeller load (the sum of the ice-related and hydrodynamic loads) acts, the power produced by the engine from the combustion gases is transmitted to the propeller through the same mechanical elements to overcome ship resistance in ice. In such a state, energy propagates through the system as a result of the ice and engine firing impacts, and equilibrium between the propeller and engine is achieved through the mechanical energy stored in the rotating masses and flexible elements.
If the amount of energy/load applied to the propeller from the submerged ice pieces exceeds design, the propeller blade should fail before any significant damage is caused to the other elements in the mechanical connection. Hnninen (2004) reported 33 instances of propeller damage and three engine damages in the Baltic Sea during winter navigation in 2002-2003. Considered damages consist of ultimate strength-(Varma, 2000) or fatigue-related (Balyts'kyi et al., 2013) damages. To reduce the amount of damage, a clear understanding of the difference between the propeller torque load and propeller shaft torque response is essential. Propeller shaft response has been measured in full-scale trials or model-scale tests (Koskikivi and Kujala, 1985; Brown et al., 1998; Dahler et al., 2010).
Brown et al. (1998) estimated that the ratio between the maximum propeller torque and maximum propeller shaft torque is in the range of 0.99 to 1.74 for seven sets of full-scale trials. By tuning the phase angle between cylinder firing and ice impact, Dahler et al. (2010) observed that the amplitude and time period agreement between simulated, using IACS ice-related torque load over four seconds, and measured propeller shaft torque response can vary significantly (56% to 91%). Considering only ice impacts (i.e., no diesel engine firing pulses, but a mean torque), 70% agreement is achieved. Polić et al. (2014) related most of the difference between propeller torque load and propeller shaft torque response with the torque generated by rigid body motion of the propeller and propeller shaft. The latter was confirmed for only one case of ice-related load and one propulsion machinery design using a simple Bond Graph (BG) model.
Brown et al. (1998) and Ikonen et al. (2014) presented transformation of the propeller shaft response to the propeller torque by using different inverse propulsion machinery models. Apart from using different methods, the propulsion machinery modes are modeled with different numbers of sub-models. Brown et al. (1998) considered only the propeller and propeller shaft in the inverse model, while Ikonen et al. (2014) considered the complete system from propeller to engine. However, justification for reduction of the inverse model and correlation between propeller torque load and propeller shaft torque response are presented by neither oresearcher.
Based on the findings from Polić et al. (2014), the current paper seeks to 1) identify the difference between propeller torque load and propeller shaft torque response, within different propulsion machinery designs and ice-related loads; 2) relate this difference to the mechanical energy stored in the propeller and propeller shaft; and 3) rank the contribution of kinetic, potential, and dissipative energy (components of mechanical energy) in rigid and flexible modes. The BG model used in this paper is presented in Polić et al. (2016).
2 MethodologyA propulsion machinery system model is used to simulate the dynamic response of the system during the ice-propeller interaction. The model consists of a Fixed Pitch (FP) propeller directly connected to a slow-speed engine through a propeller shaft and a flexible coupling. Fig. 1 illustrates such a directly connected system, which is considered energy efficient and robust; hence, this system is the most common solution for merchant ships. Different ice conditions and designs of the directly connected propulsion machinery system are considered by varying the following five system parameters: 1) propulsion machinery ice class that defines the maximum design thickness of the ice block (Hice) and the maximum amplitude of the ice-related torque (Qmax) according to DNV (2016); 2) the number of propeller blades (Z); 3) the length of the propeller shaft (Lshaft); 4) the stiffness of the flexible coupling (kstatic); and 5) the number of engine cylinders (w), which defines the maximum delivered engine power (Pemax). For each parameter, three different values are assigned in Table 1.
| Ice-propeller | Machinery | |||||||
| Ice-class | Design thickness of ice block, Hice /m | Max. ice-related torque, Qmax / kN·m | Number of propeller blades, Z / m | Propeller shaft length, Lshaft / m | Flexible coupling stiffness, kstatic /(MN·m·rad−1) | Number of cylinders, w | Max. delivered engine power, Pemax/MW | |
| 1B class | 1.2 | 731 | 3 | 6 | 6 | 5 | 11.75 | |
| 1A class | 1.5 | 933 | 4 | 12 | 12 | 6 | 14.1 | |
| 1A* class | 1.75 | 1104 | 5 | 18 | 18 | 7 | 16.45 | |
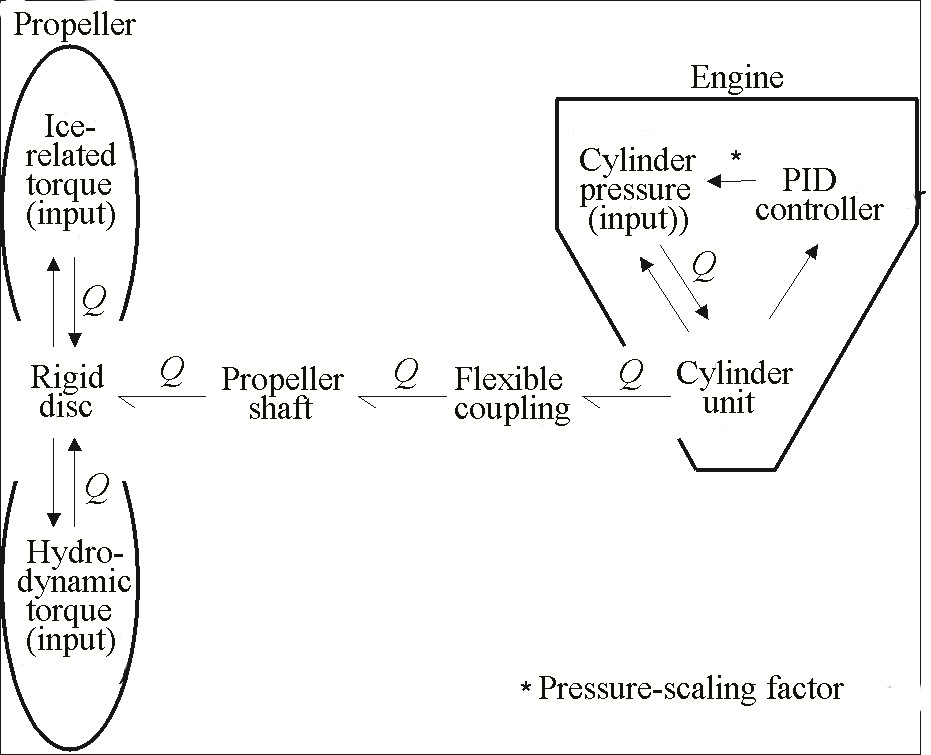
The physical system, which is illustrated in Fig. 1, is modeled with four sub-models that represent physical elements (i.e., FP propeller) and three inputs: ice-related torque, hydrodynamic torque, and cylinder pressure. A simple overview of the model structure is illustrated in Fig. 2. Physical elements and their connections are formalized as a network of idealized physical processes connected using the BG method (Karnopp et al., 2005). Each idealized physical process is described with one BG element where instantaneous power or energy exchange between processes is described as a product of effort (e) and flow (f). In addition to the power variables, e and f, two energy variables, momentum (p) and displacement (q), are used to describe energy relationships in the BG methodology. In the domain of rotational mechanics, the variables e, f, p and q represent torque (Q N·m), angular velocity (ω rad/s), angular momentum [Nms], and angular position (φ rad), respectively. The positive flow of power between BG elements is in the direction of the half arrow called a power bond. A full arrow, called a signal bond, indicates a signal flow used by BG elements to describe variable physical relationships (e.g., ice-related torque as a function of the angular position of the propeller). Power and signal bond arrows are illustrated in Figure 2 with solid and dashed lines, respectively. Detailed descriptions of the BG method and BG elements can be found in Karnopp et al. (2005) and Borutzky (2010 and 2011), while important works related to the formulation of BG models of multibody mechanical system dynamics are given in Allen (1979) and Karnopp (1992 and 1997).
|
| Figure 2 Simplified model of the propulsion machinery (Q-torque, ω-angular velocity, φ-angular position). The direction of the half arrows shows positive power flow between elements of the propulsion machinery, while a signal flow is presented with the full arrow (Polić et al., 2016) |
The BG model of the directly coupled propulsion machinery system is adopted from Polić et al. (2016), and it considers the FP propeller as an equivalent rigid disc, the propeller shaft as a modal decomposition of a continuous body, the flexible coupling as a linear element with a static stiffness and damping, and the engine as a mass-spring-damper model with a nonlinear motion of the crank mechanism. Modal decomposition of the shaft and complete rigid body motion of the crank mechanism is used for more accurate response prediction of the system. The advantage of the proposed modeling technique over a conventional lumped shaft model and an equivalent crank moment of inertia is given in Polić et al. (2016).
Aside from the parameters presented in Table 1, a complete list of all parameters used in the BG model can be found in Appendix A in Polić et al. (2016). In this paper, only the ice-related torque variations and an extension of the BG model to account for three different engines (defined by the number of cylinder units) are explained in the following paragraph.
Qmax is calculated based on DNV (2016) rules for an open FP propeller with diameter (D=6 m), hub external diameter (d=1.8 m), pitch at 0.7R of P0.7=4.2 m, and maximum engine rotational speed in ice of n0.85=89 r/min. The maximum engine rpm and maximum delivered power per cylinder (2.35 MW) are considered the same for all three engines. Furthermore, DNV's excitation case 1, the most common case, is used to obtain the ice impact sequence for each propeller alternative. In DNV's excitation case 1, the excitation factor (Cq=0.75) and ice-propeller interaction angle (aice=90°) are combined with the appropriate ramp-up function and number of ice impacts (Nice) for the given ice class. The resulting ice impact sequences are summarized in Appendix A. Each sequence is multiplied with the corresponding Qmax, calculated for each ice class, which yields the ice-related torque (Qice).
Qice torque defines an external propeller input in the model, illustrated in Figure 2, and, together with hydrodynamic torque (Qhyd) from open water conditions, is used as a design load of the propulsion machinery system. Qhyd torque is calculated according to the propeller law: proportional to the square of propeller angular velocity (ωp). The presented rule-based design load does not consider correction of the hydrodynamic load (i.e., cavitation) due to the presence of submerged ice. The influence of the approach and blockage phase on the flow in front of the propeller is discussed in Walker (1996) and Sampson (2009).
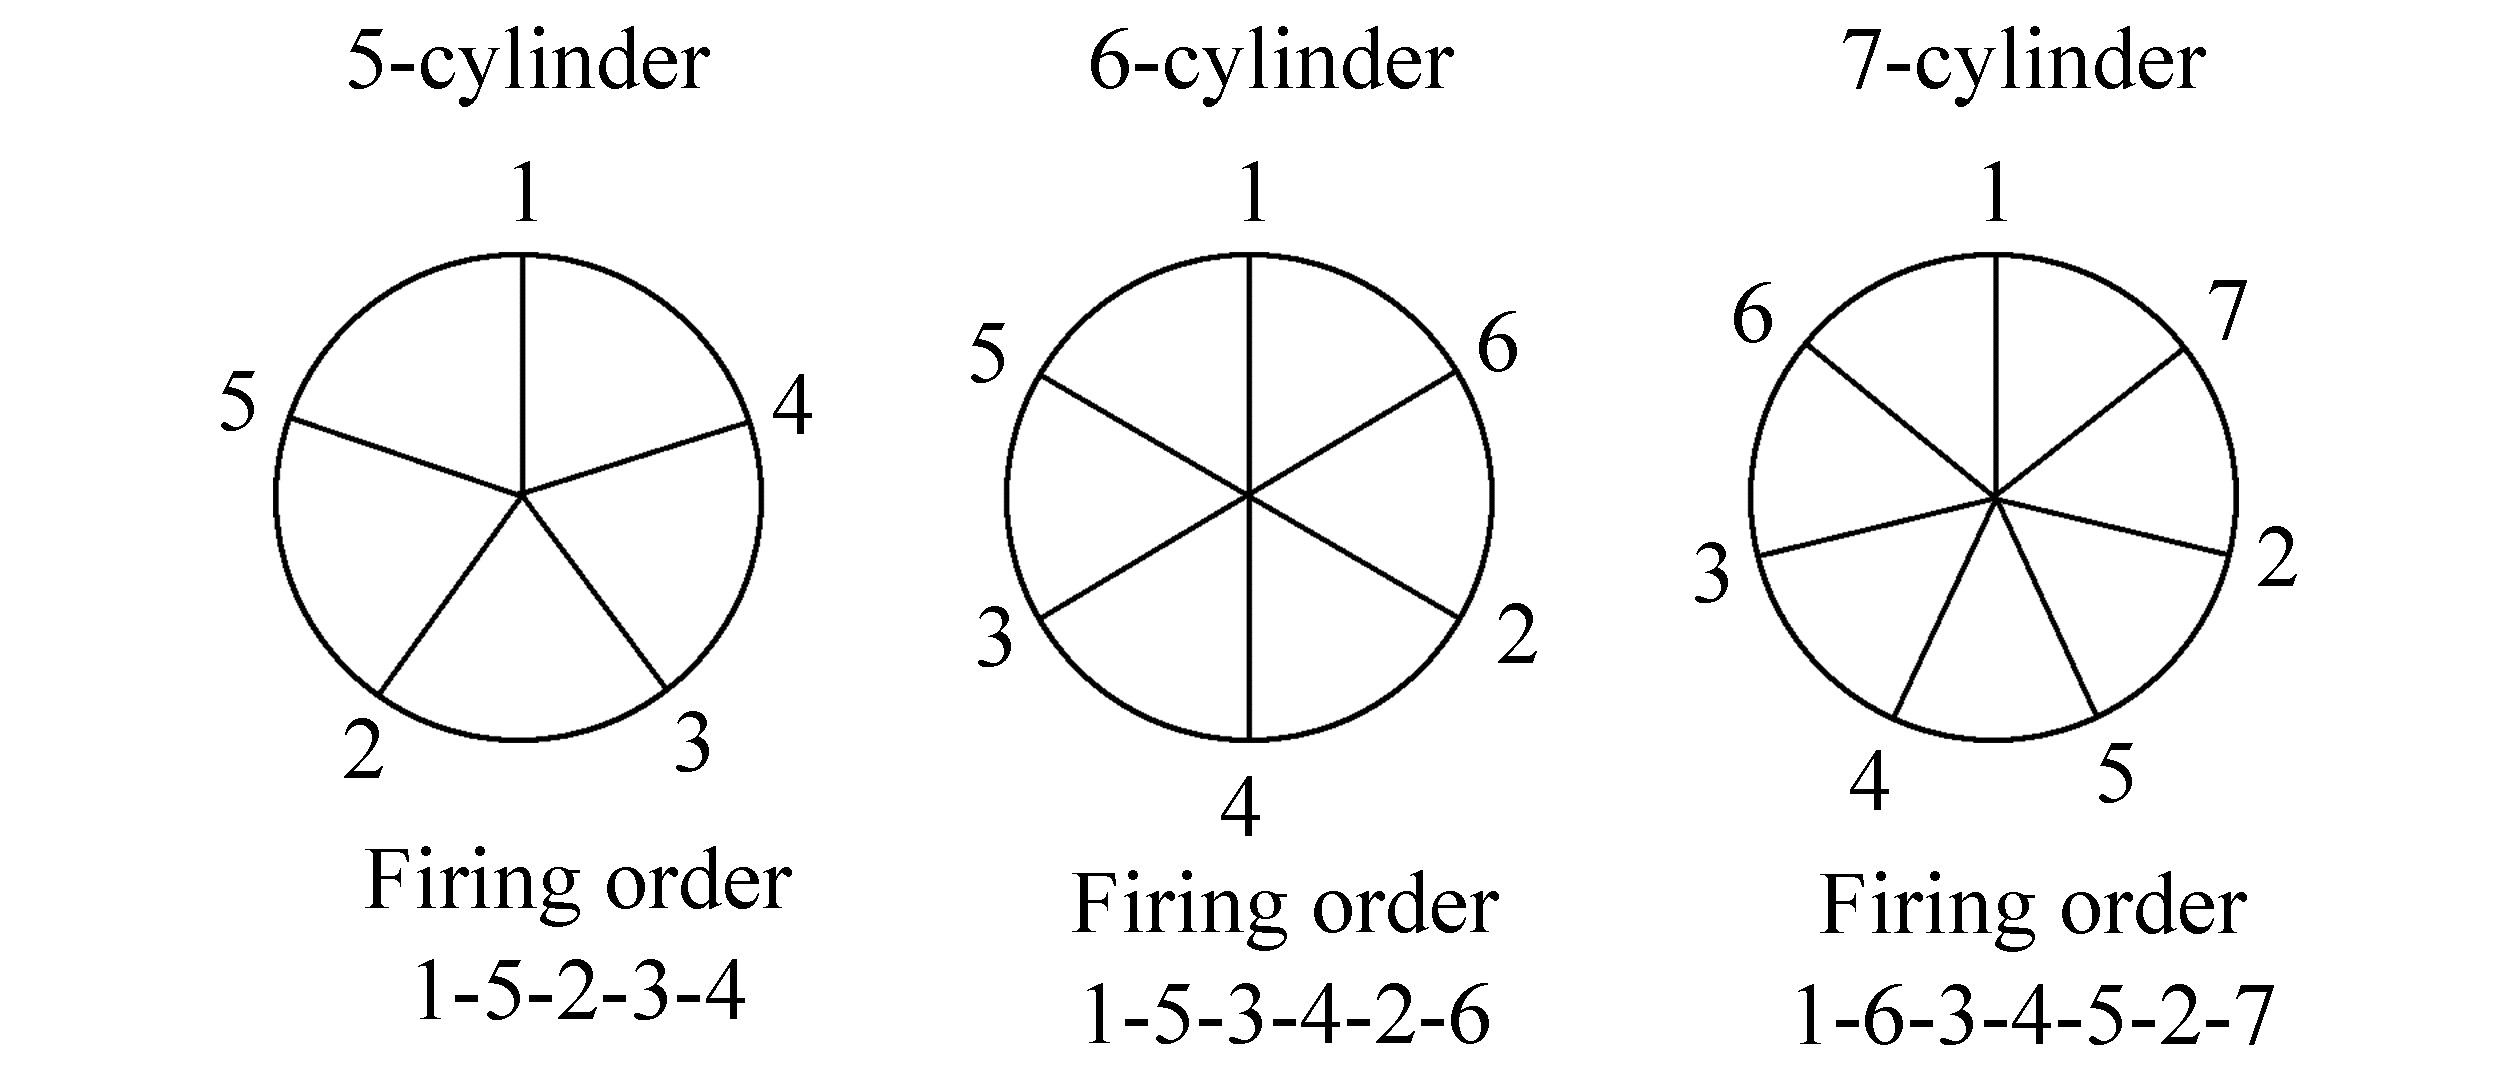
The third external input to the BG model, illustrated in Figure 2, is the cylinder pressure measured at engine's Maximum Continues Rating (MCR). The maximum pressure caused by combustion gasses is expressed as a function of the crankshaft angular position and scaled by the pressure-scaling factor, calculated by a Proportional-Integral-Derivative (PID) controller, at each step. PID controller minimizes the difference between angular velocity feedback, engine angular speed (ωe) return from the flow sensor, and the reference engine angular velocity defined byn0.85. The upper limit in the PID controller is set by the engine overload curve, which is commonly illustrated in the engine load diagram as curve 8. The equation for the pressure-scaling factor limit is given in Polić et al. (2016). After the scaled pressure curve is determined, the corresponding cylinder pressure (pcyl) for each cylinder unit is estimated from the crankshaft position, which is equal to the sum of the integral of crankshaft angular velocity and the adjoining phase angle. The phase angle and firing order for each engine are summarized in Figure 4.
|
| Figure 4 Firing order and phase angle for the investigated two-stroke engines |
The firing order, number of cylinders, and the adjoining structure are adjusted manually for each engine. Other values from Table 1 are parametrically set inside the model.
3 Analysis casesThe number of possible analysis cases (35=243) is reduced to 35 cases by separately analyzing the influence of machinery variables (w, kstatic, and Lshaft) and ice-propeller interaction variables (Z and Hice) for one base value of ice-propeller interaction or machinery variables. Hence, 27 different machinery cases and 9 different ice-propeller interaction cases are defined in Tables 2 and 3. The common case, case 15, presents the base case.
| Lshaft=12 m | |||||
| 0.5 Lshaft | Lshaft | 1.5 Lshaft | |||
| kstatic=12 MNm/rad | 0.5 kstatic | case 1 | case 10 | case 19 | w=5 |
| case 2 | case 11 | case 20 | w=6 | ||
| case 3 | case 12 | case 21 | w=7 | ||
| kstatic | case 4 | case 13 | case 22 | w=5 | |
| case 5 | case 14 | case 23 | w=6 | ||
| case 6 | case15 | case 24 | w=7 | ||
| 1.5 kstatic | case 7 | case 16 | case 25 | w=5 | |
| case 8 | case 17 | case 26 | w=6 | ||
| case 9 | case 18 | case 27 | w=7 | ||
| Ice-class 1A, Hice=1.5 m | |||||
| Z=4 | |||||
| Ice-class 1B | Ice-class 1A | Ice-class 1A* | |
| Hice=1.2 m | Hice=1.5 m | Hice=1.75 m | |
| Z=3 | case 28 | case 31 | case 33 |
| Z=4 | case 29 | case 15 | case 34 |
| Z=5 | case 30 | case 32 | case 35 |
| Lshaft=12 kstatic=12 MN·m/rad |
|||
| w=7 | |||
The proposed reduction of the cases is justified by the fact that this paper seeks to identify only the correlation between response and load within different propulsion machinery designs and ice-related loads.
4 Simulation results and discussionThe dynamic response of the propulsion machinery system is obtained using the Backward Euler method, a simple implicit numerical method used to solve ordinary differential equations, with a fixed time step of 1 ms. The BG model is modeled with the 20-sim-software version 4.4. The propeller moment of inertia (Jp) and loading coefficient (Lhyd) are assumed to be the same for all cases. Lhyd is estimated as 8800 kgm2 based on the absorbed propeller power suitable for a five-cylinder two-stroke diesel engine at a Specific Maximum Continuous Rating (SMCR) point. The same SMCR point, set as 85% of maximum power and 95% of engine speed, is considered for the other two engines as well. As a result, the margin between the absorbed propeller power and engine overload power increases with an increasing number of cylinders.
Each case is simulated for a period of 300 seconds or approximately 420 propeller revolutions. The DNV excitation case 1 is applied at 400 propeller revolutions, which is 40 to 45 propeller revolutions after a steady-state condition is reached. Each impact in the DNV excitation case 1 is determined to have a half sinus shape, where the half of the period is equal to angle αi and the amplitude is equal to the product of torque Qmax and factor Cq. During each simulation, time histories of the torque and angular velocity of each element are obtained, but only the results during ice-propeller interaction are illustrated in Figures 5 to 16.
|
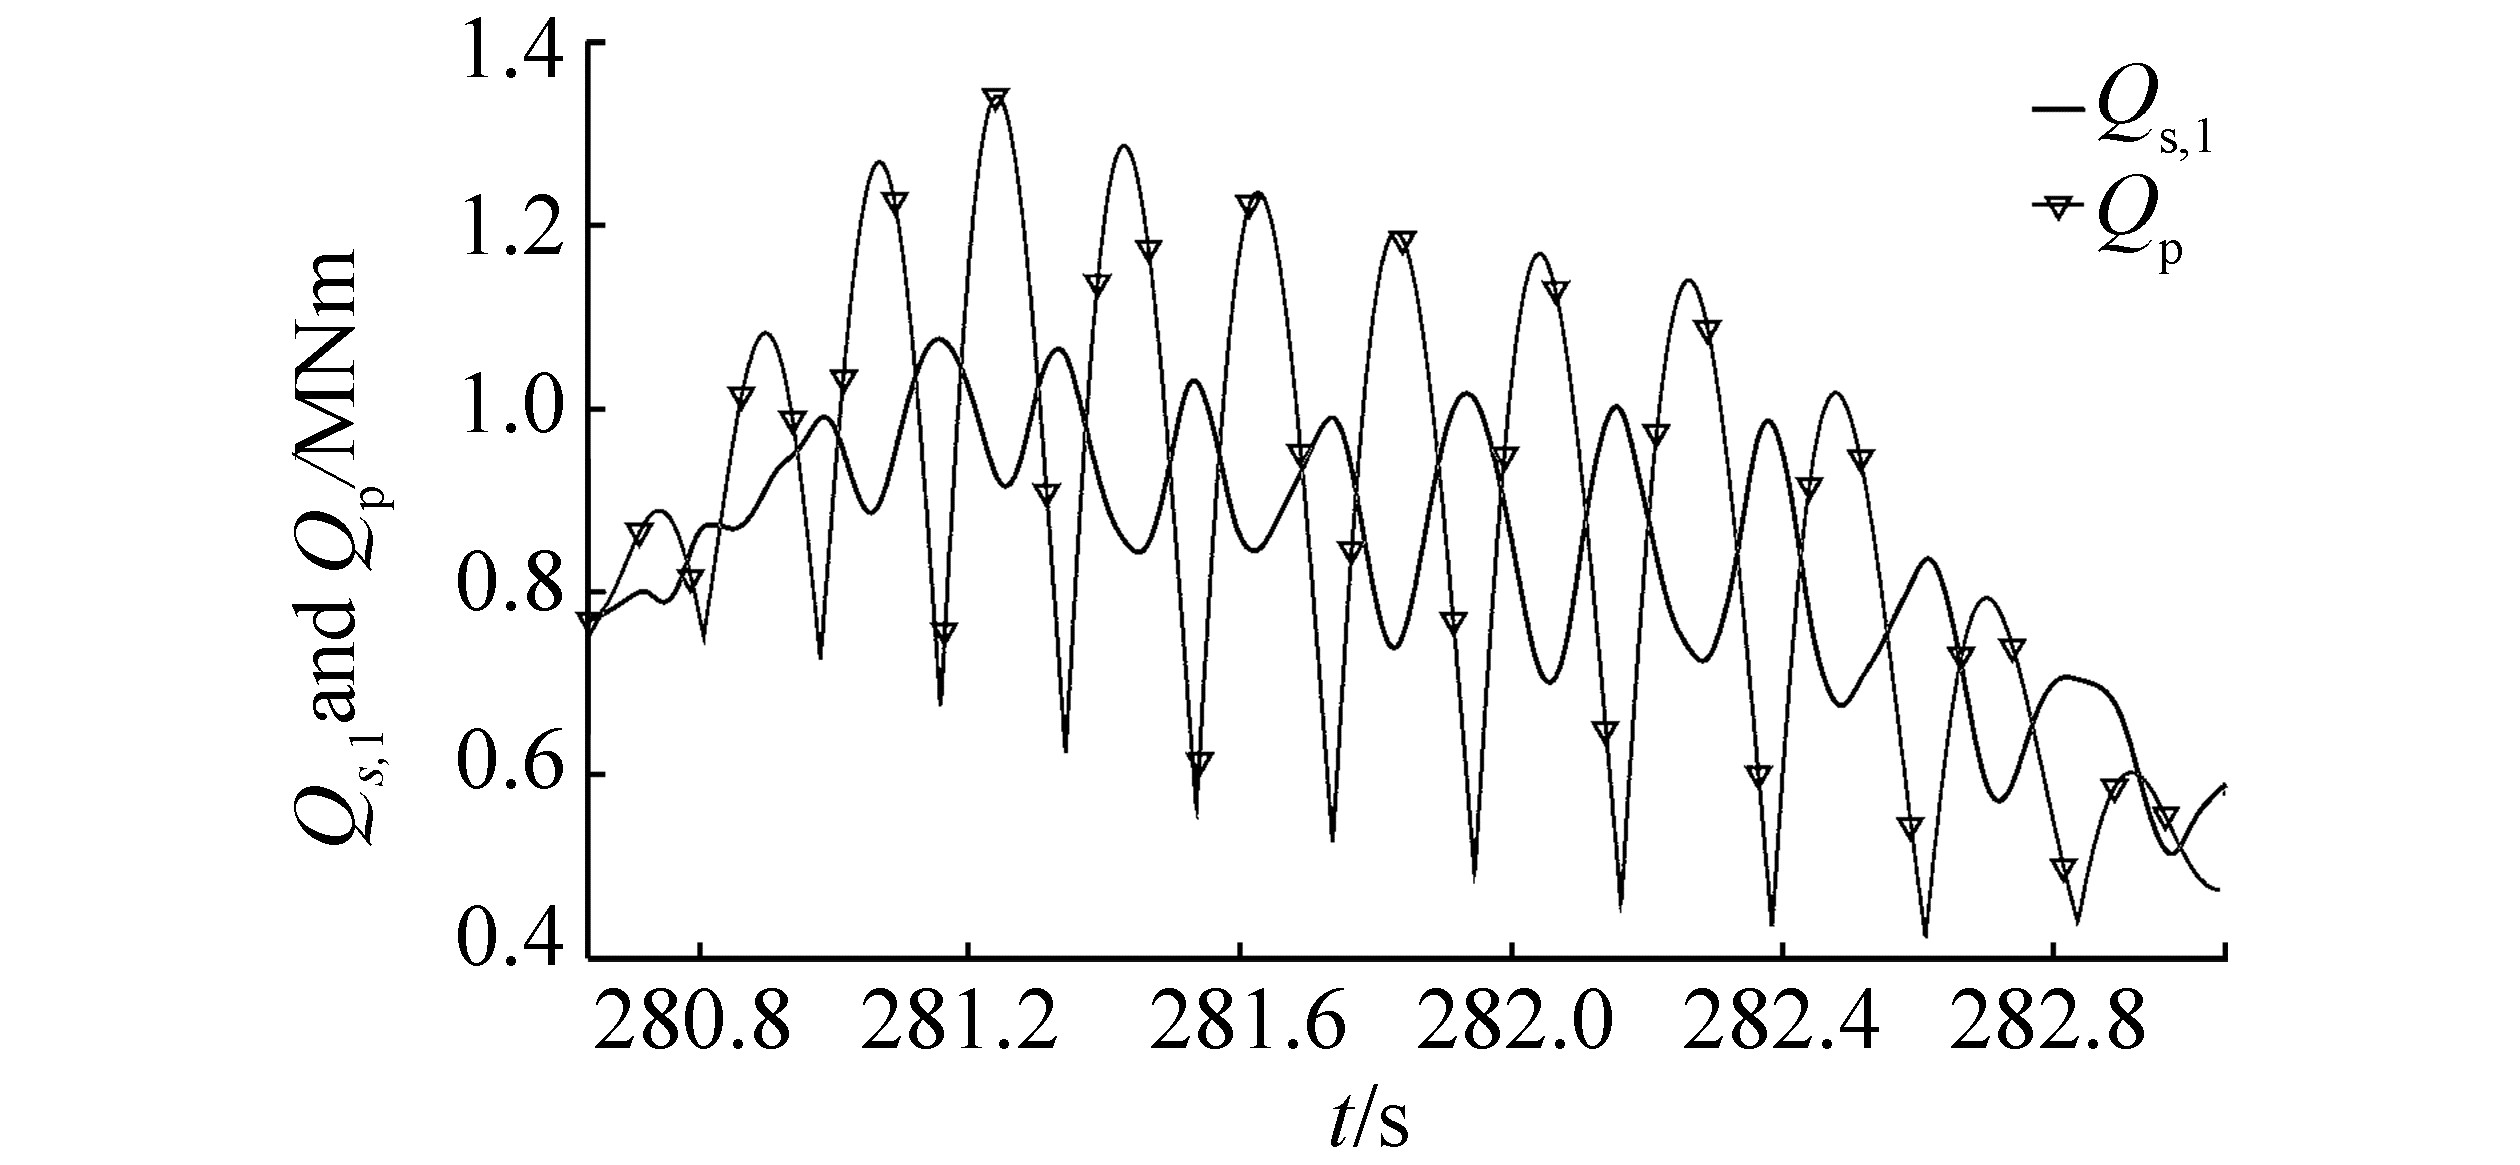
| Figure 5 Comparison of Qs, 1 and Qp torque for case 15 (base case) |
|
| Figure 6 Comparison of ωs, 1 and ωp angular velocity for case 15 (base case) |
|
| Figure 7 Maximum and minimum difference between Qs, 1 and Qp torque |
|
| Figure 8 Maximum and minimum difference between ωs, 1 and ωp angular velocity |
|
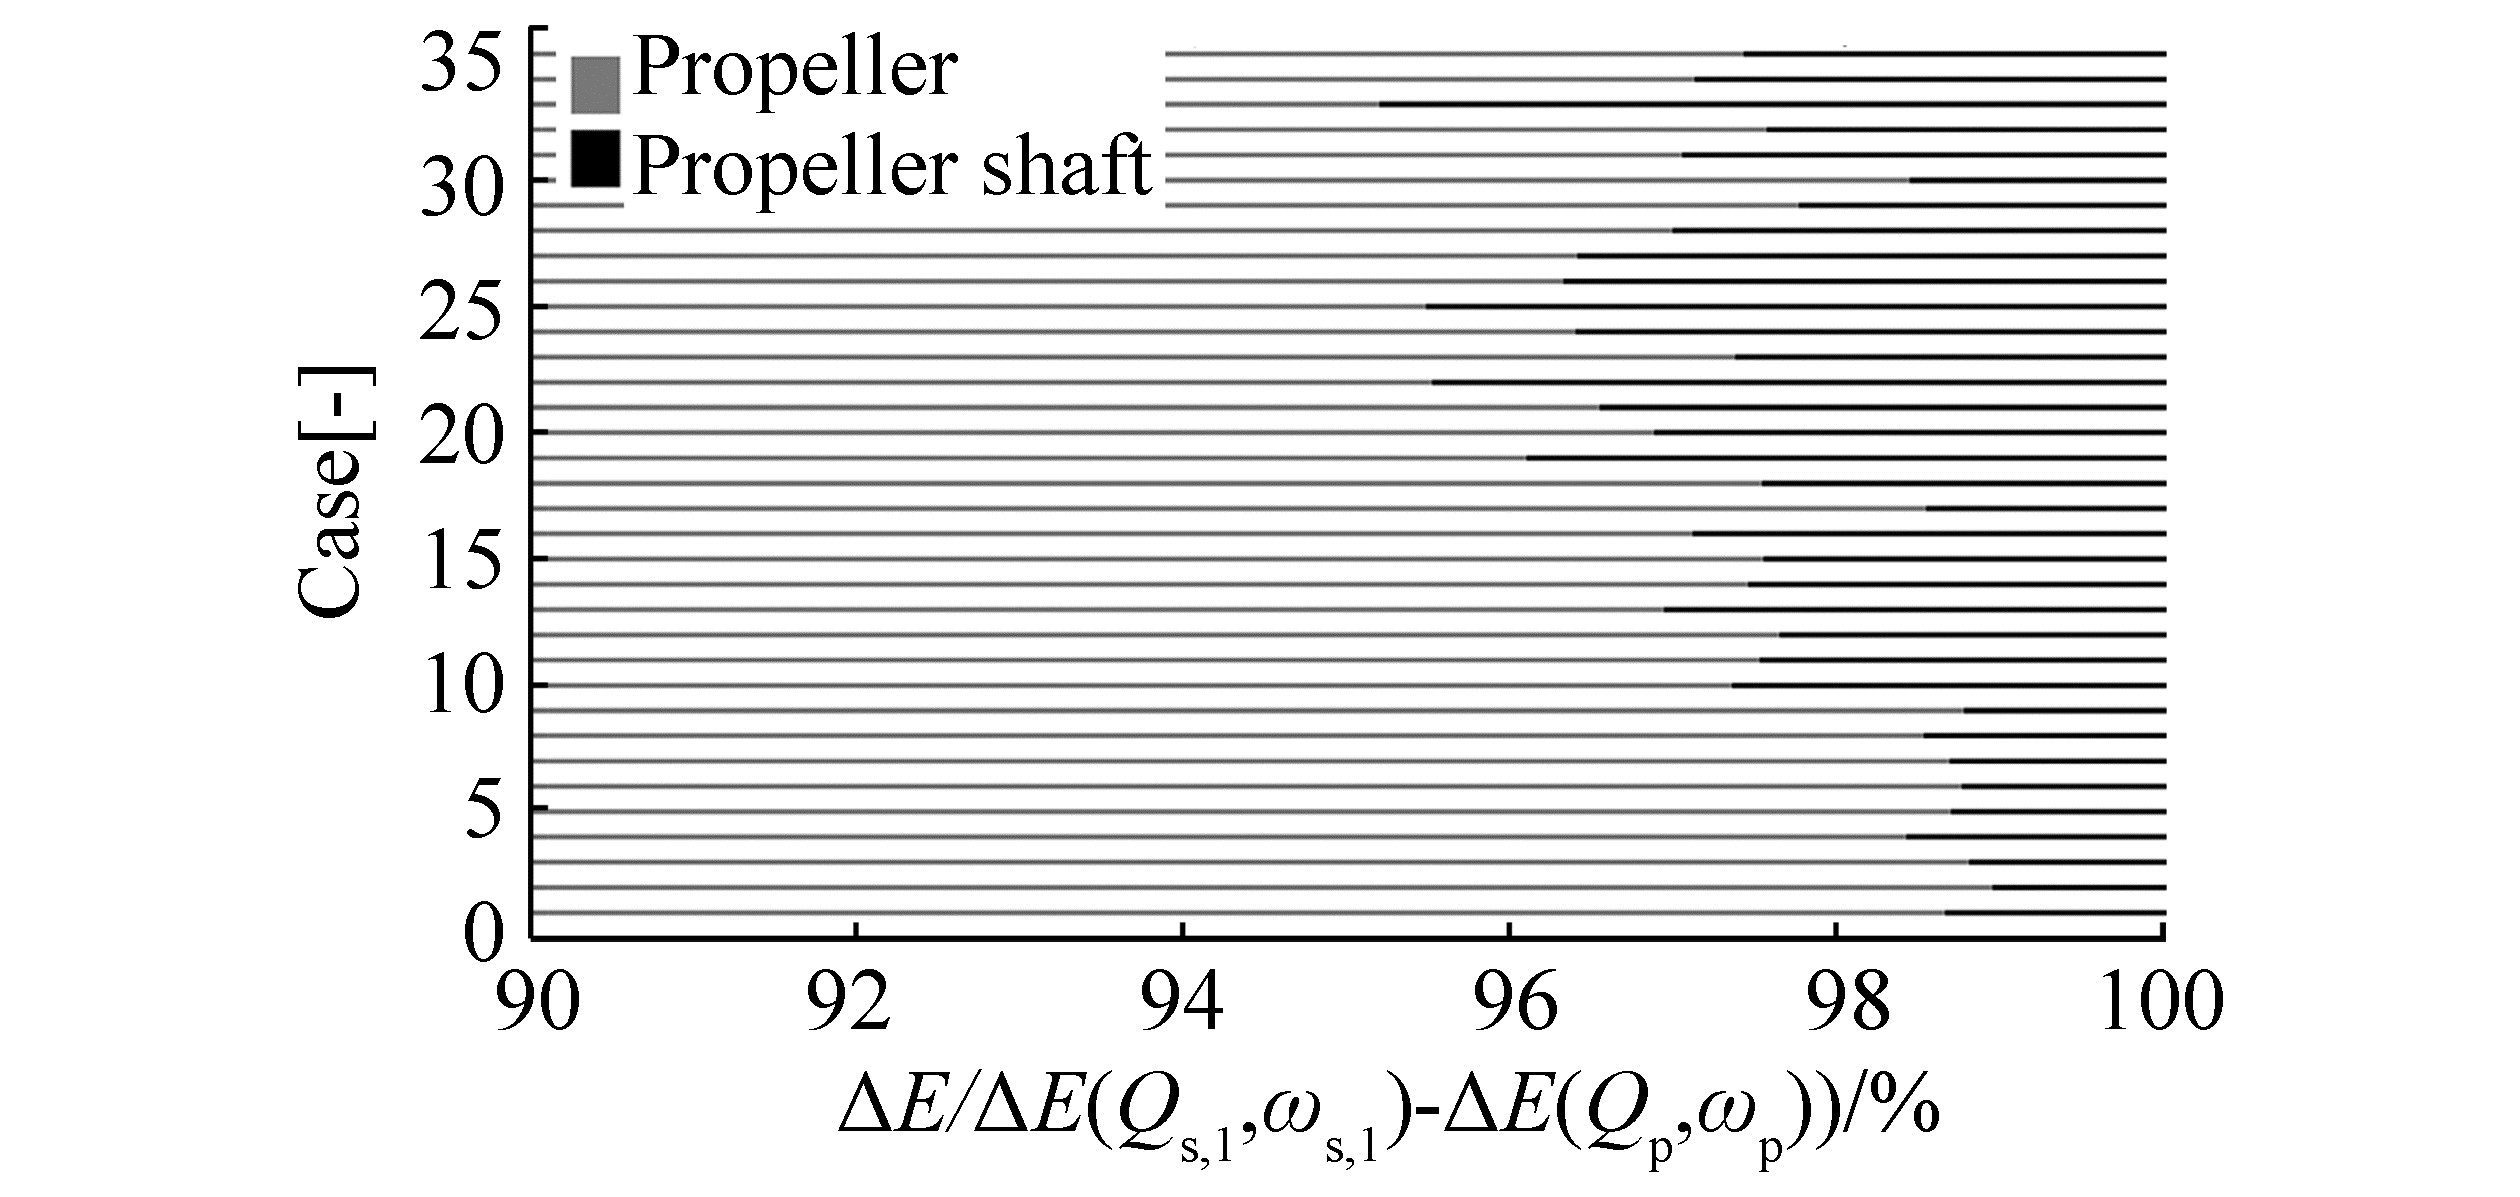
| Figure 9 Distribution of mechanical energy caused by the transient torque and angular velocity difference between the propeller shaft response and propeller load at the time instant with the maximum propeller torque load (Qp) |
|
| Figure 10 Distribution of mechanical energy caused by the transient torque and angular velocity difference between propeller shaft response and propeller load at the time instant with the minimum propeller torque load (Qp) |
|
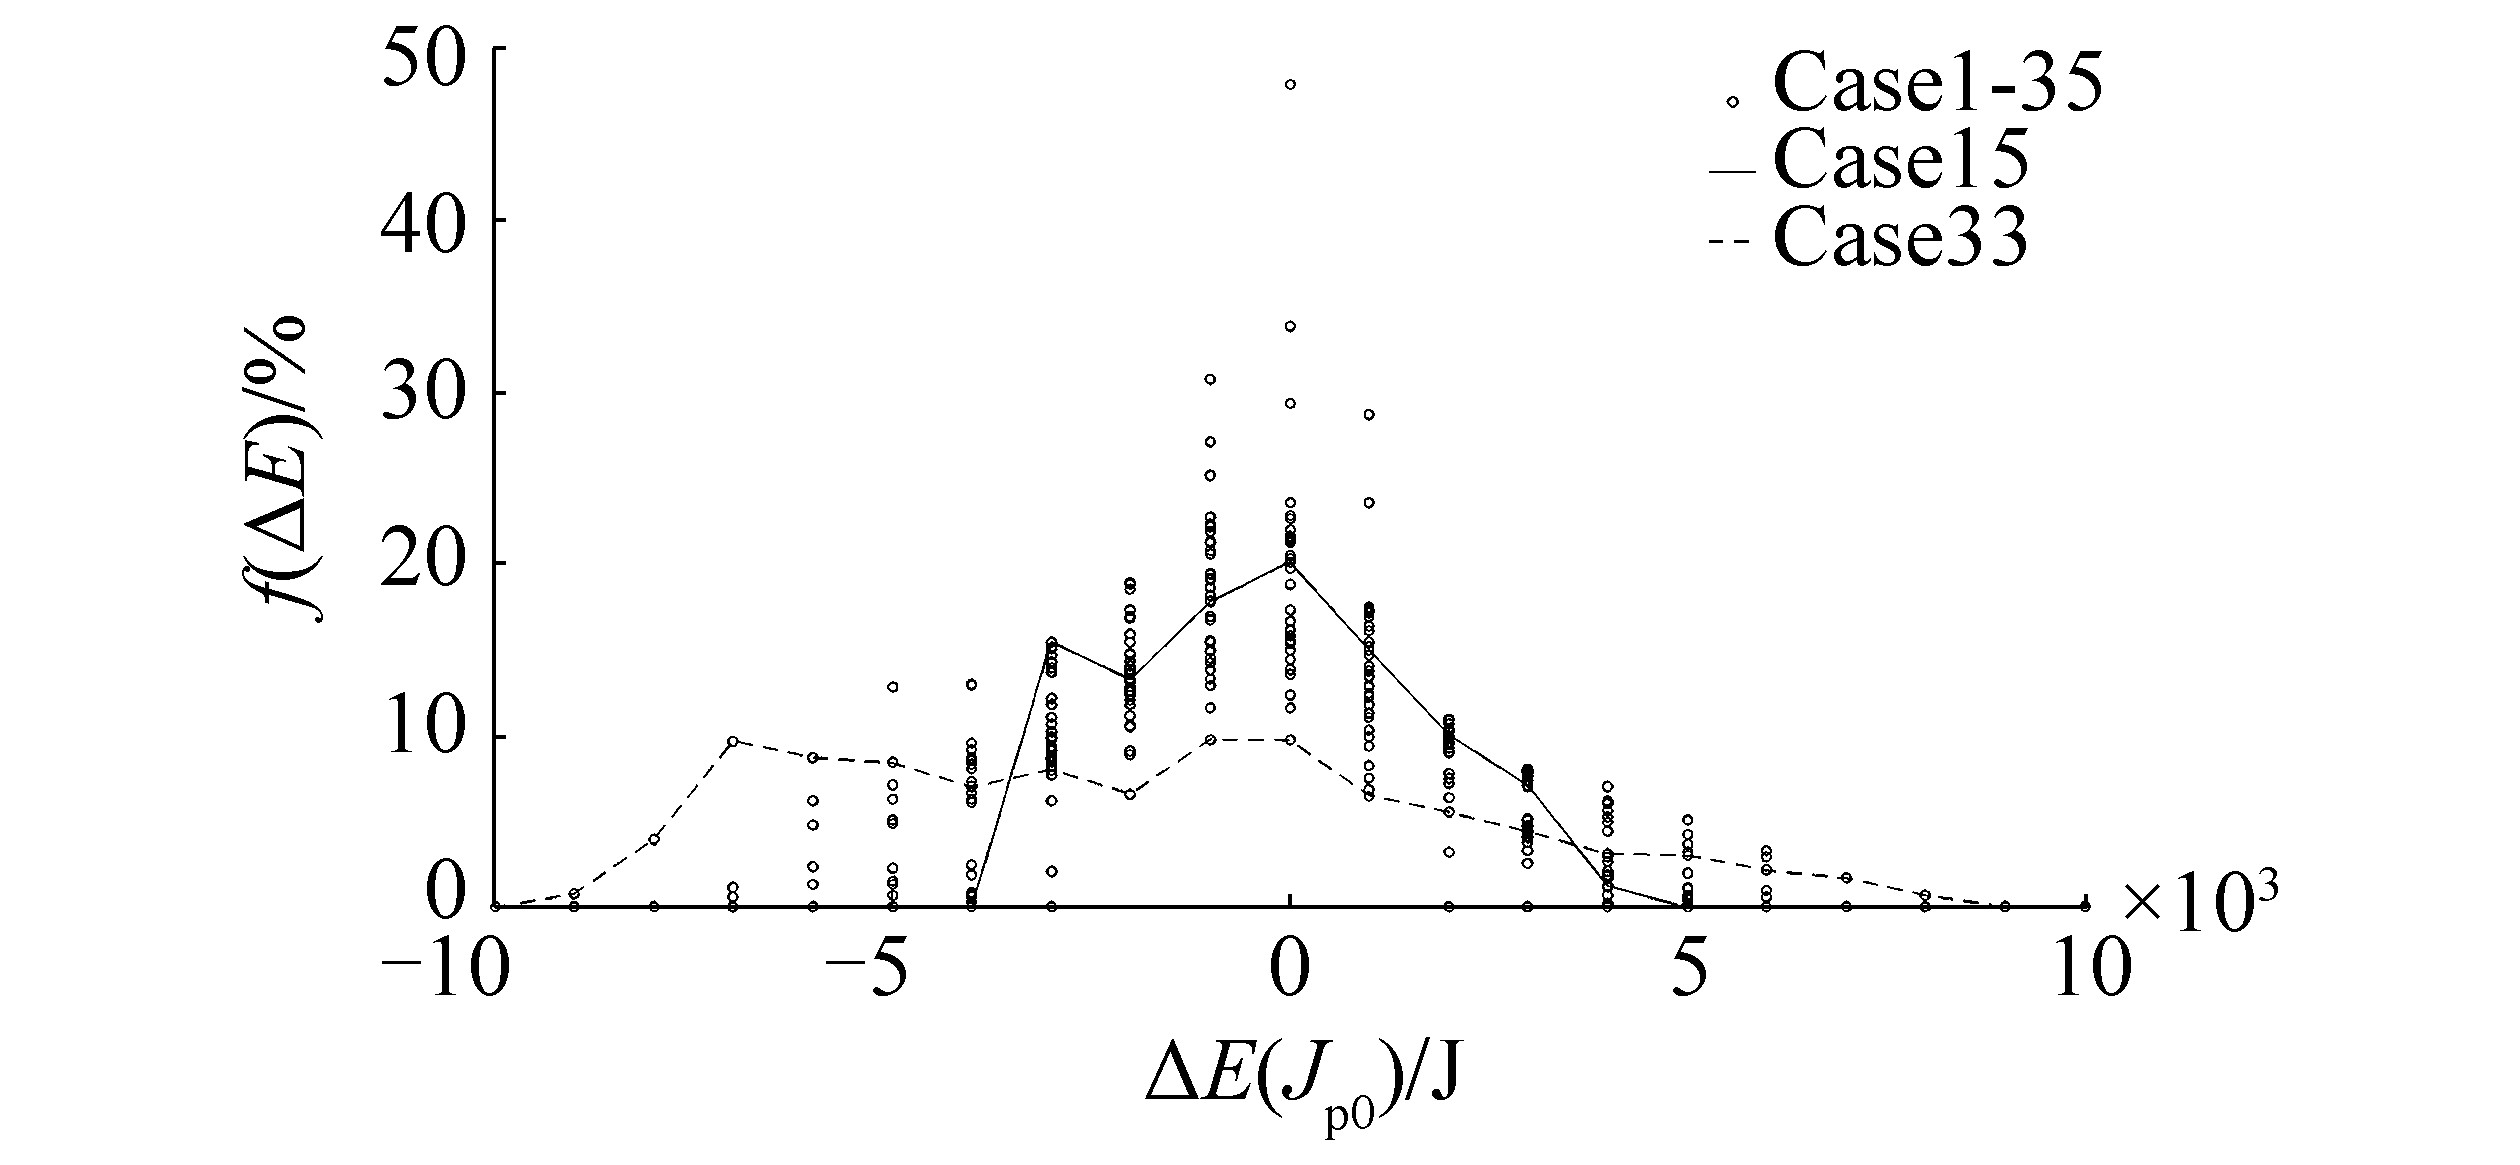
| Figure 11 Distribution of the kinetic energy absorbed by and released from propeller inertia Jp0 |
|
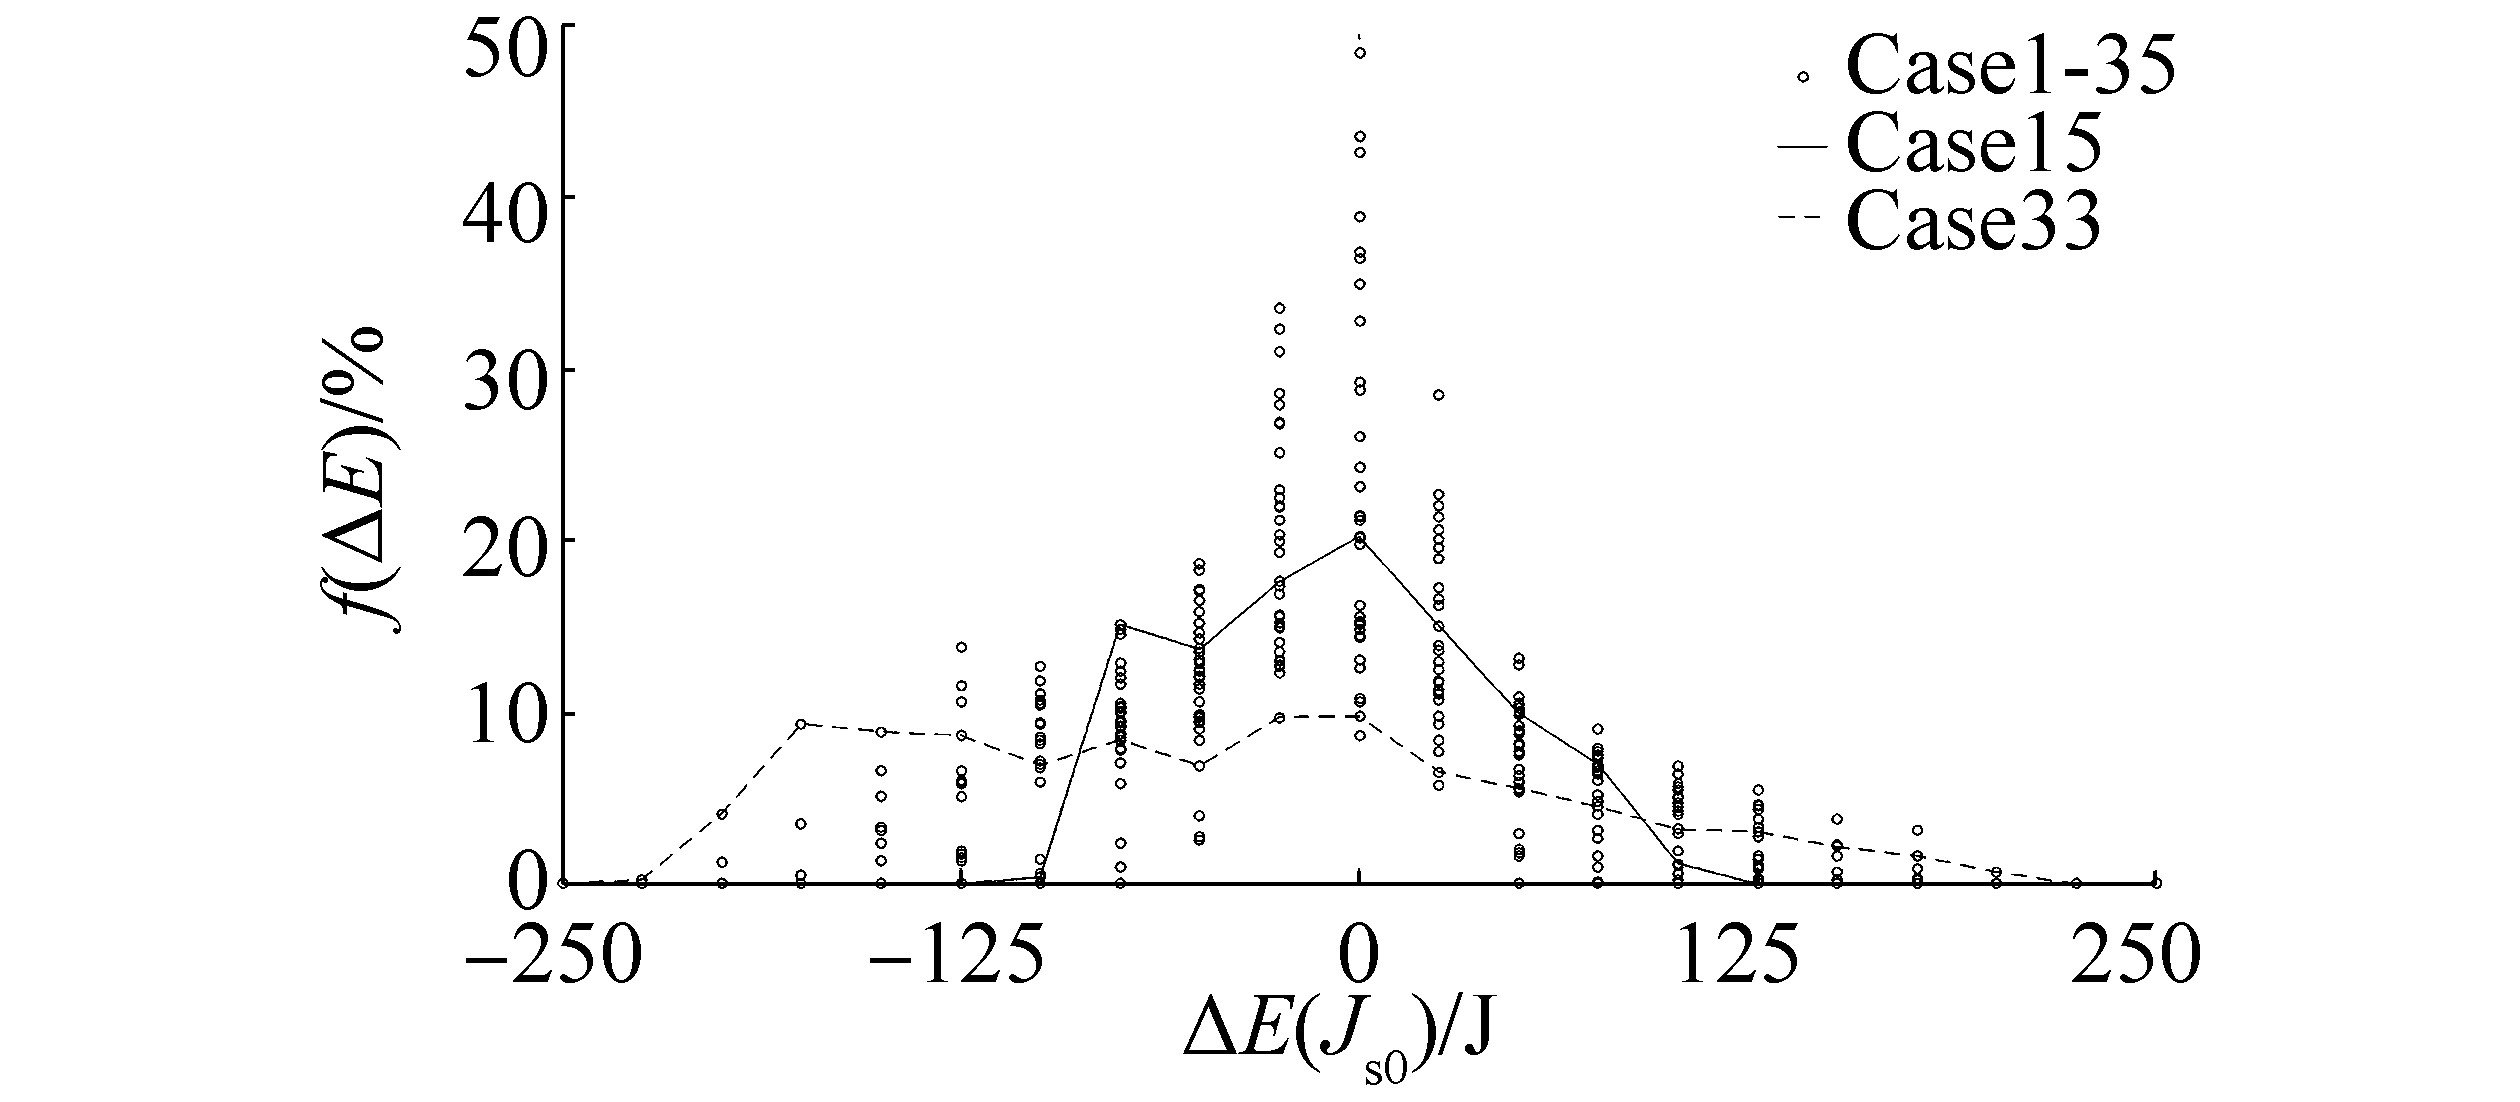
| Figure 12 Distribution of kinetic energy absorbed by and released from the rigid mode of the propeller shaft |
|
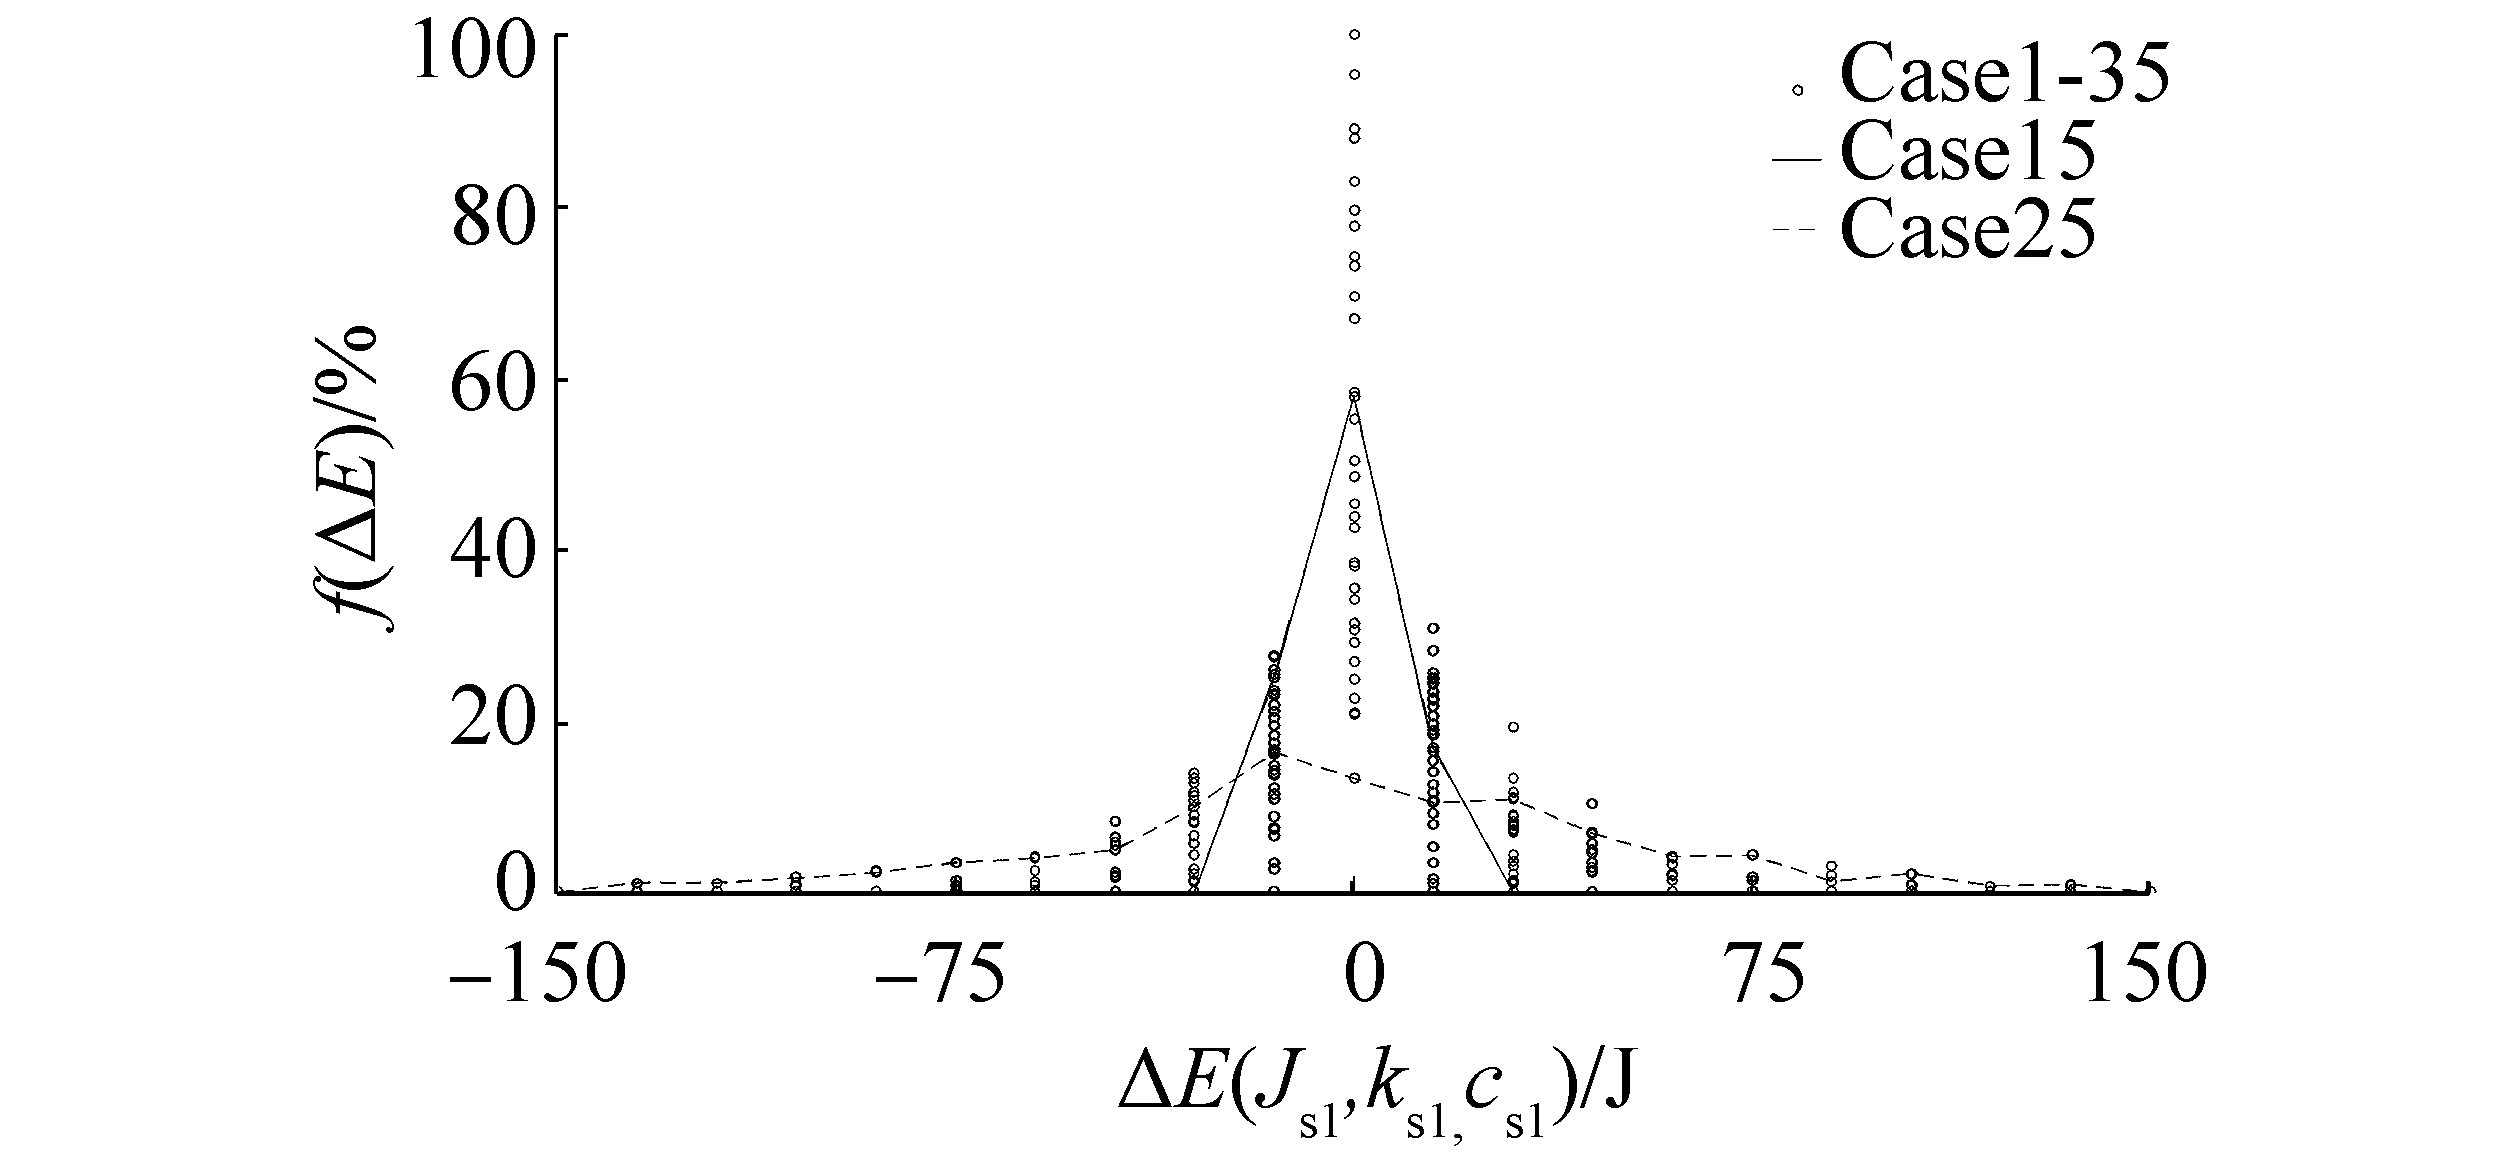
| Figure 13 Distribution of mechanical energy absorbed by and released from the first mode of the propeller shaft |
|
| Figure 14 Distribution of mechanical energy absorbed by and released from the second mode of the propeller shaf |
|
| Figure 15 Distribution of mechanical energy absorbed by and released from the third mode of the propeller shaft |
|
| Figure 16 Probability of absorbed or released mechanical energy from flexible modes of the propeller shaft that is above the threshold limit of 1 J for all cases |
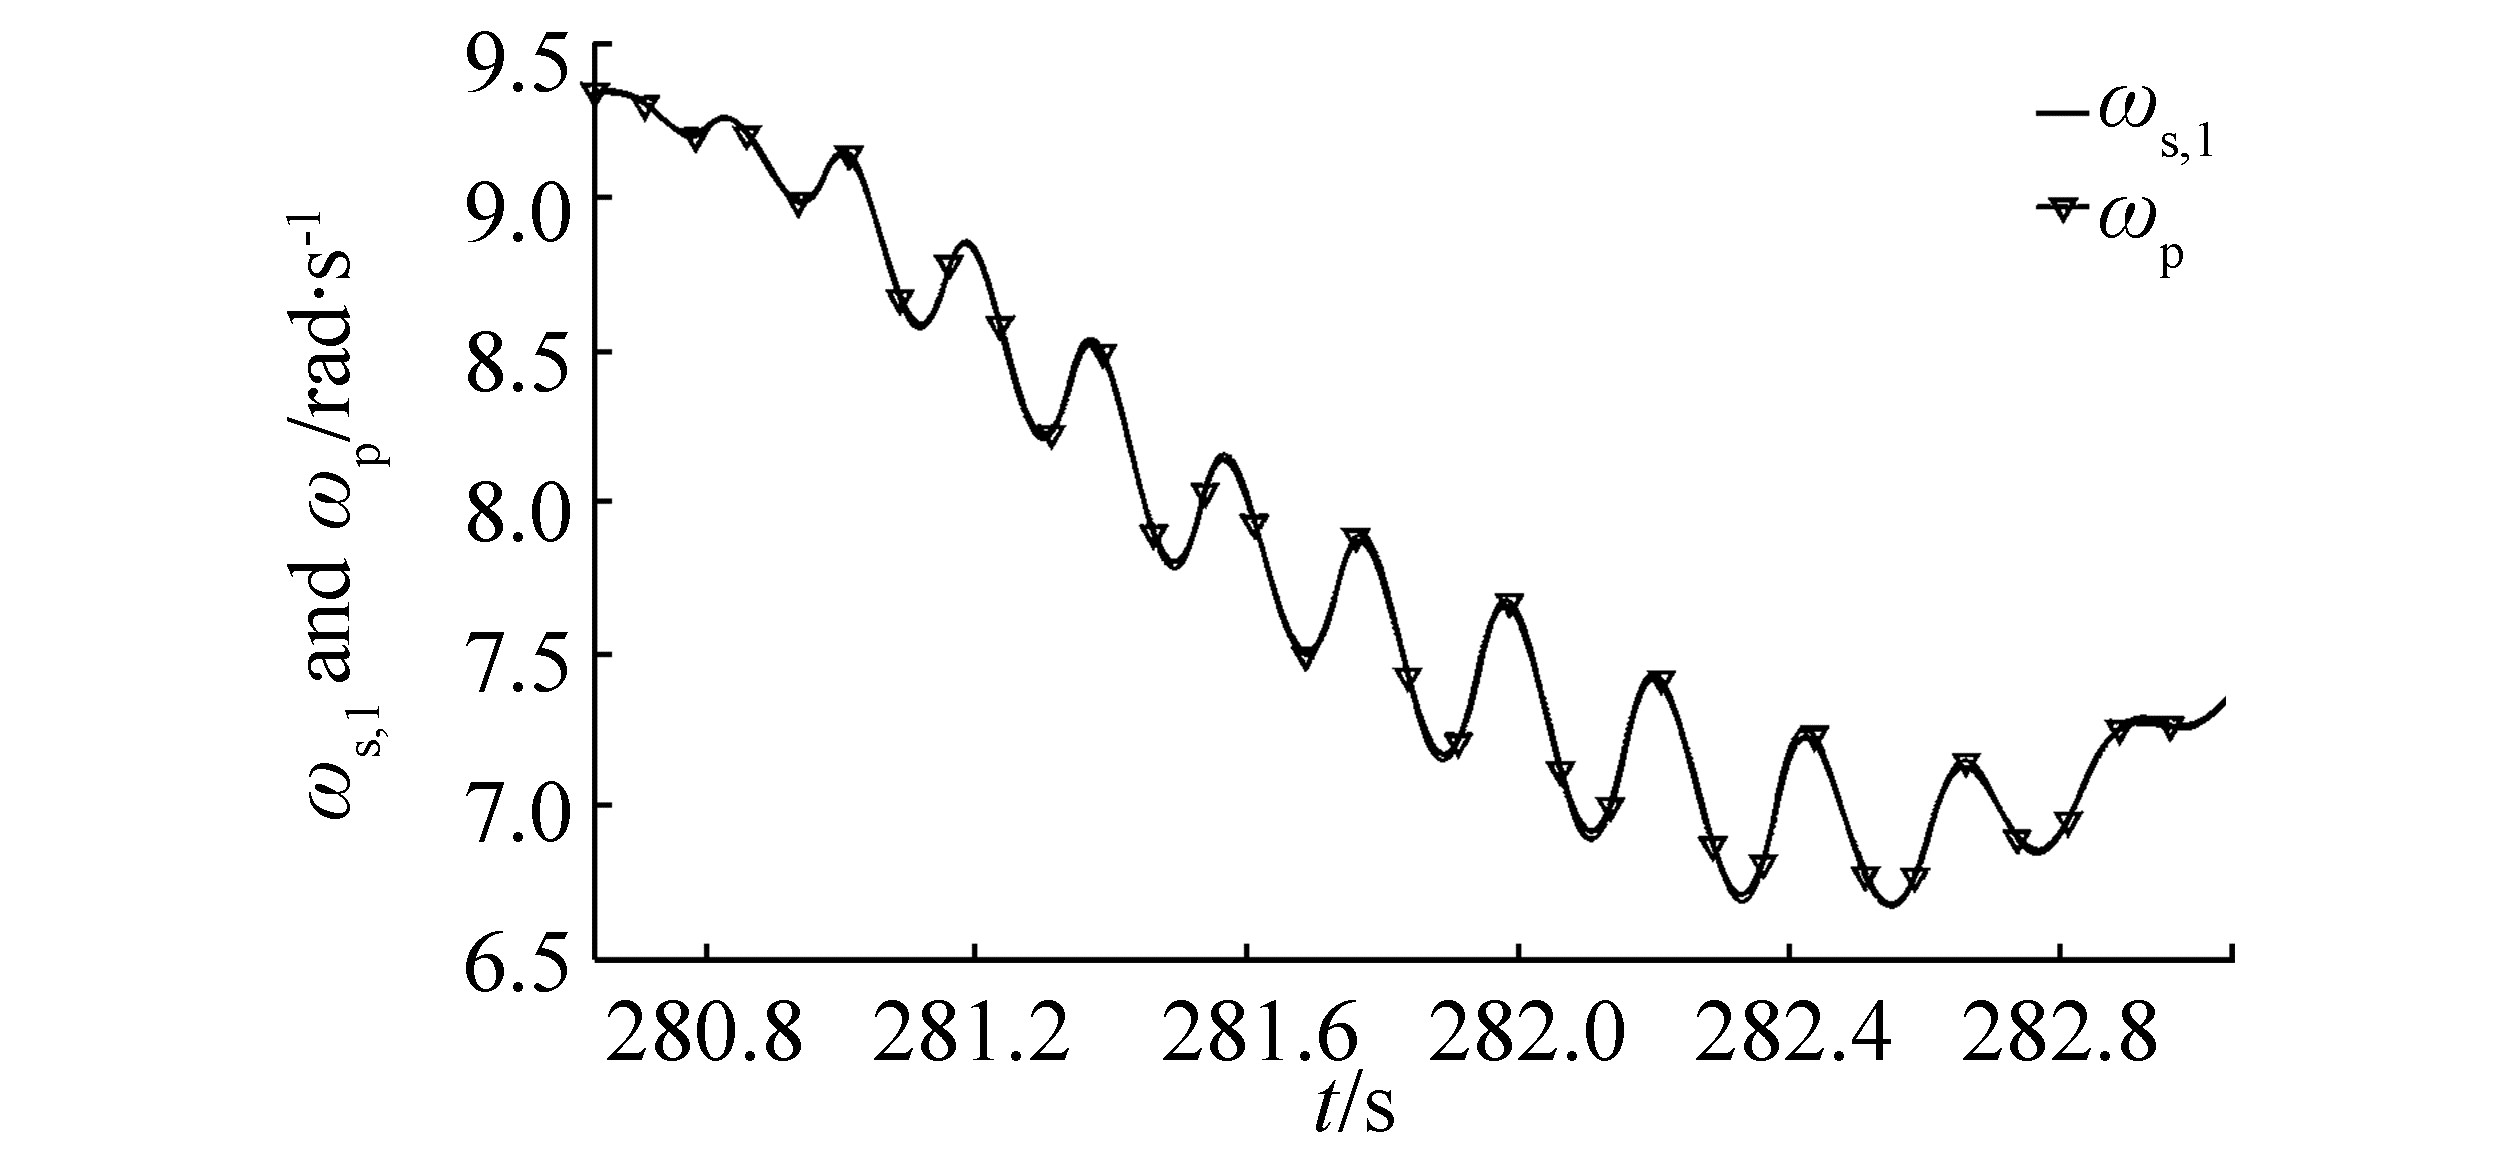
Figure 5 shows an example of a time history example of the propeller torque (Qp) (the sum of Qice and Qhyd) and the propeller shaft torque response (Qs, 1) at the end connected to the flexible coupling. The torque difference is significant. Local maximum peaks and oscillations are higher for the Qp load than for the Qs, 1 response, and a time delay between load and response is present. However, such differences were not observed between ωp and ωs, 1 angular velocity as illustrated in Figure 6.
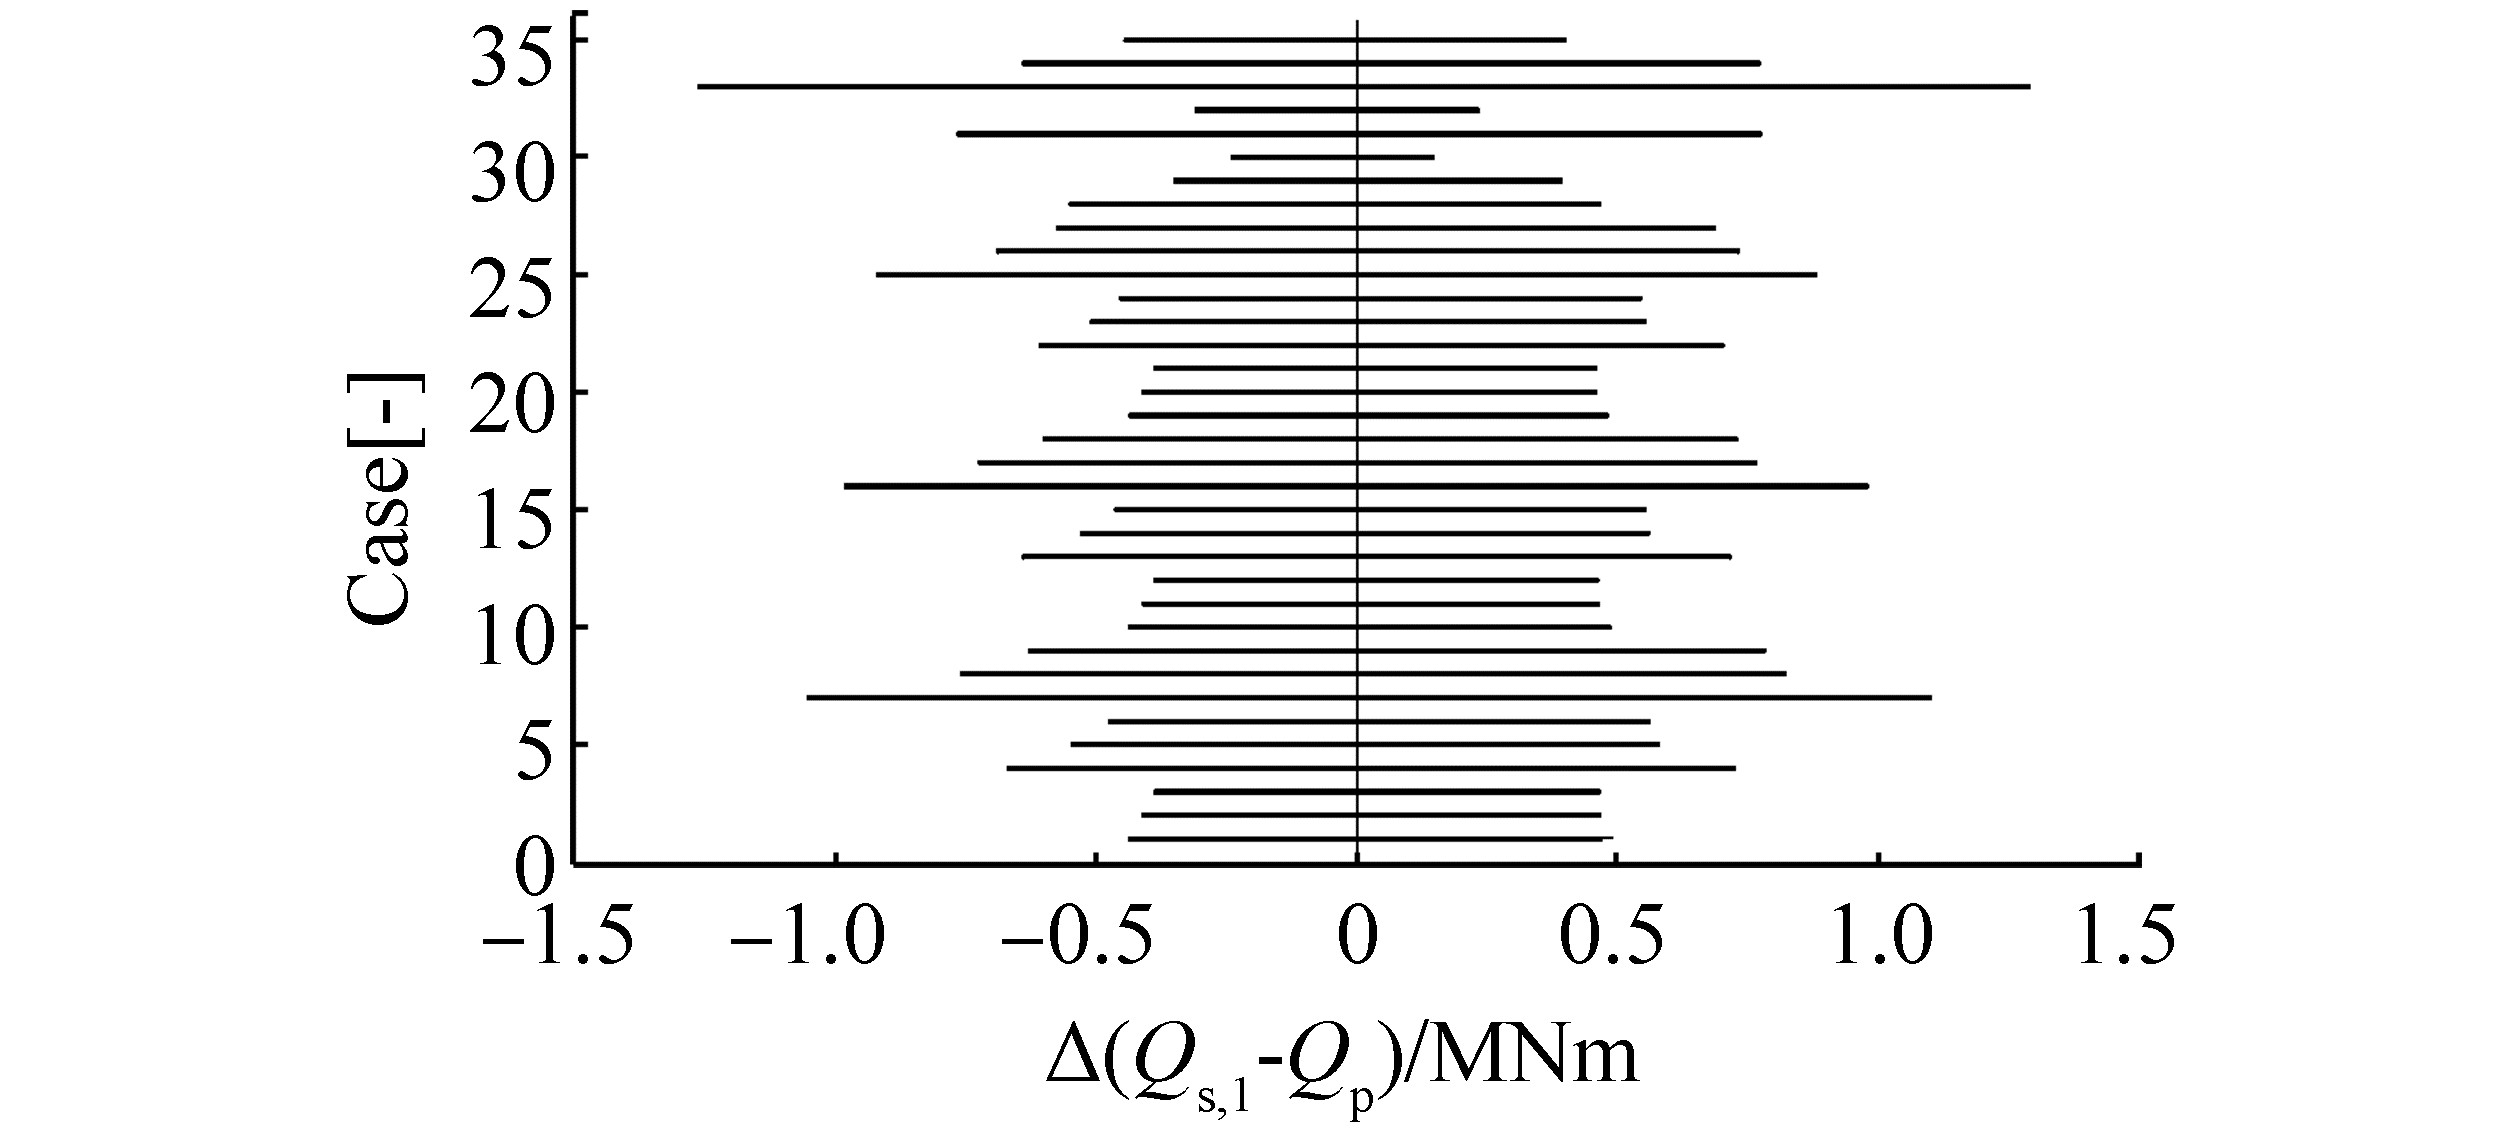
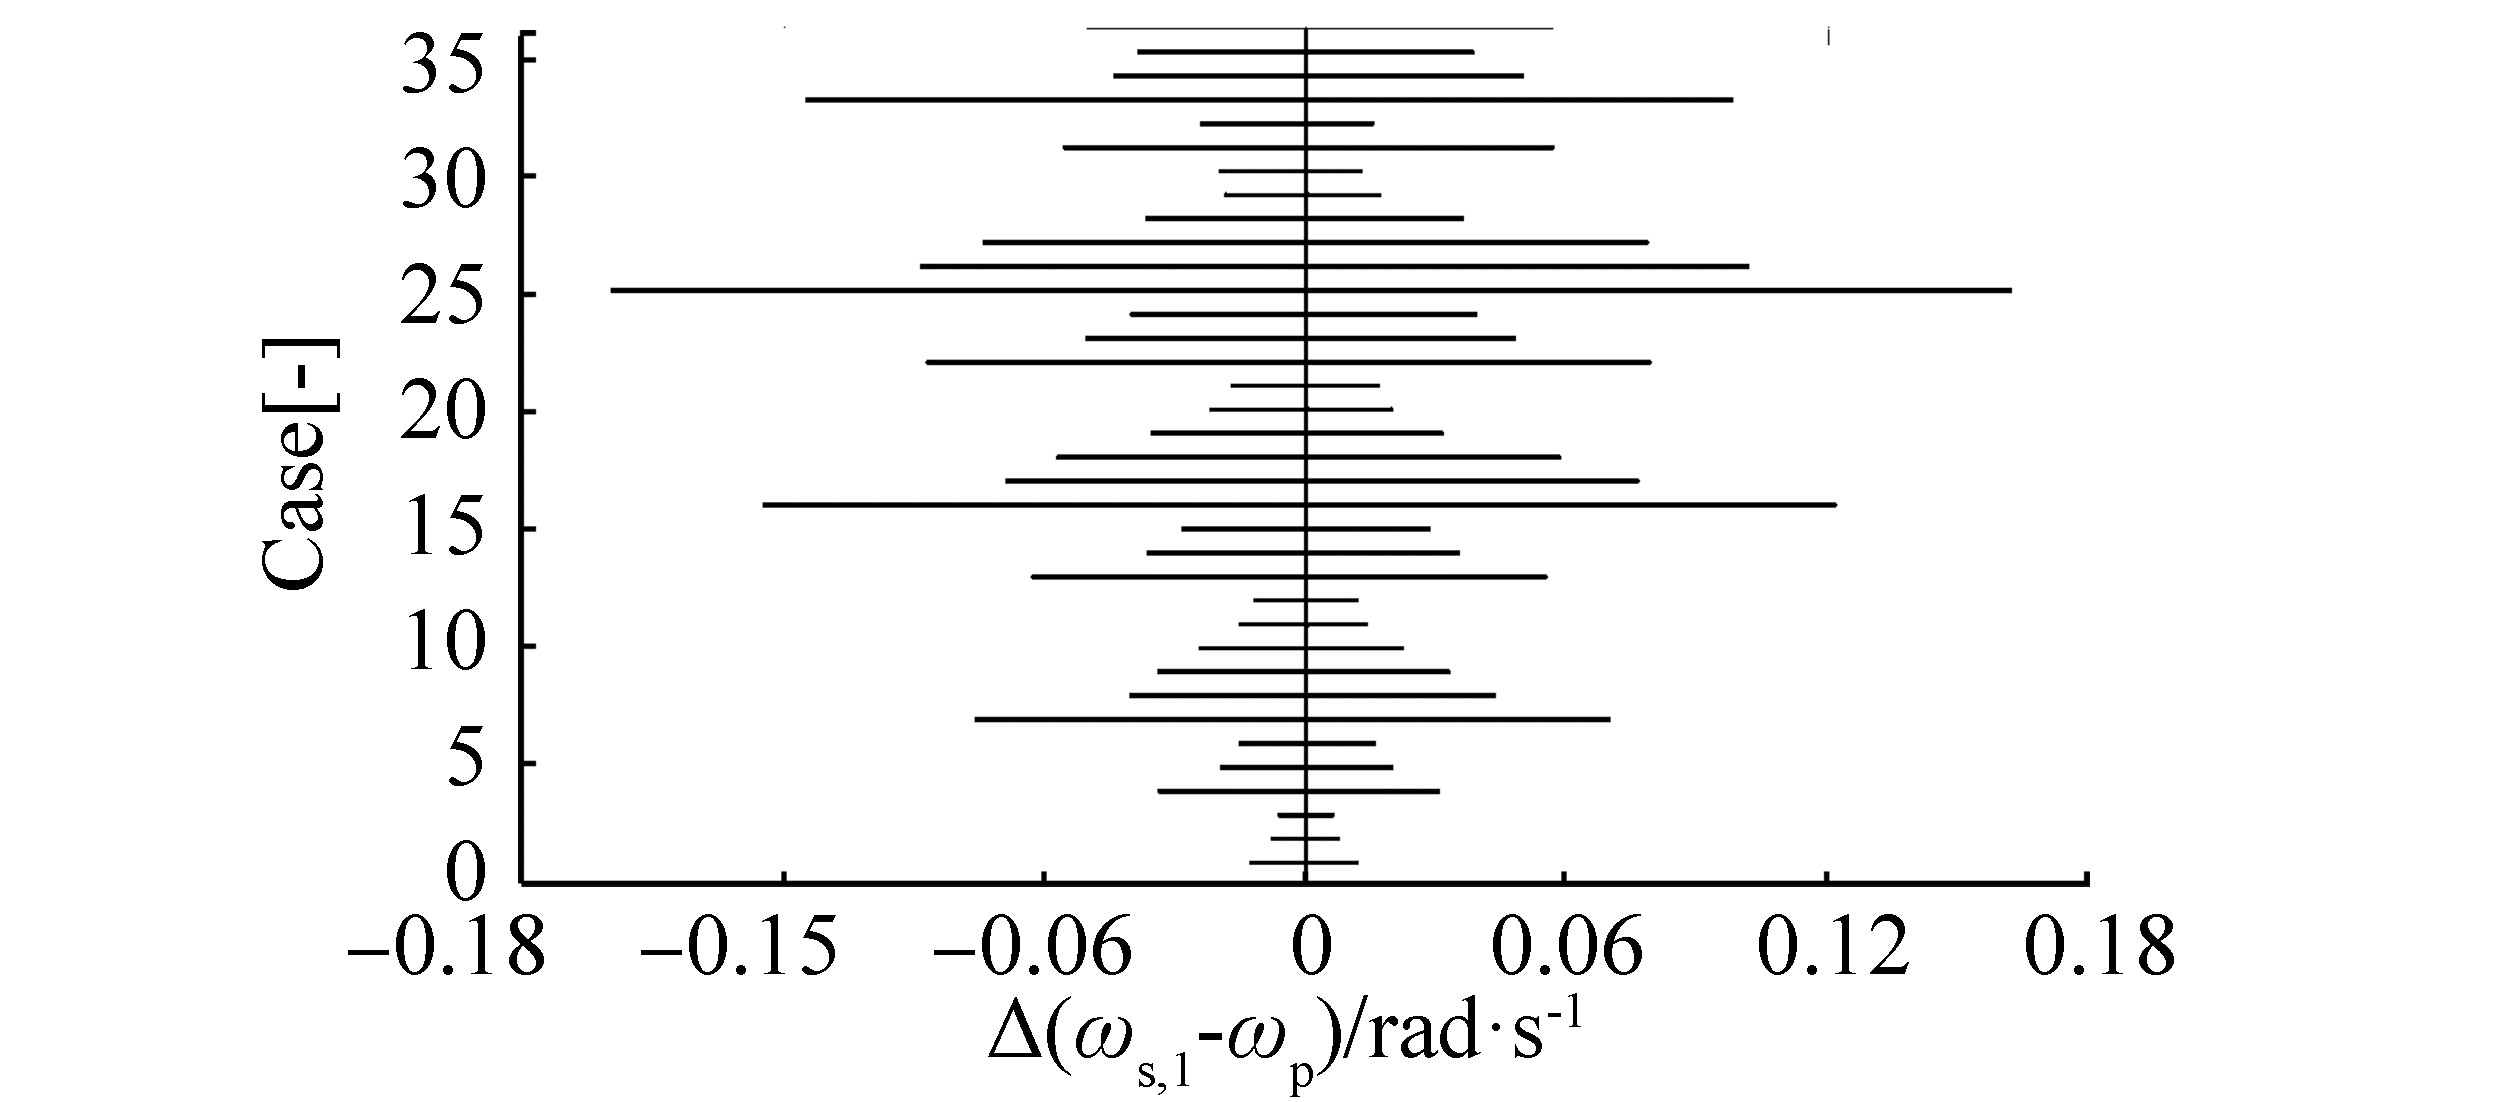
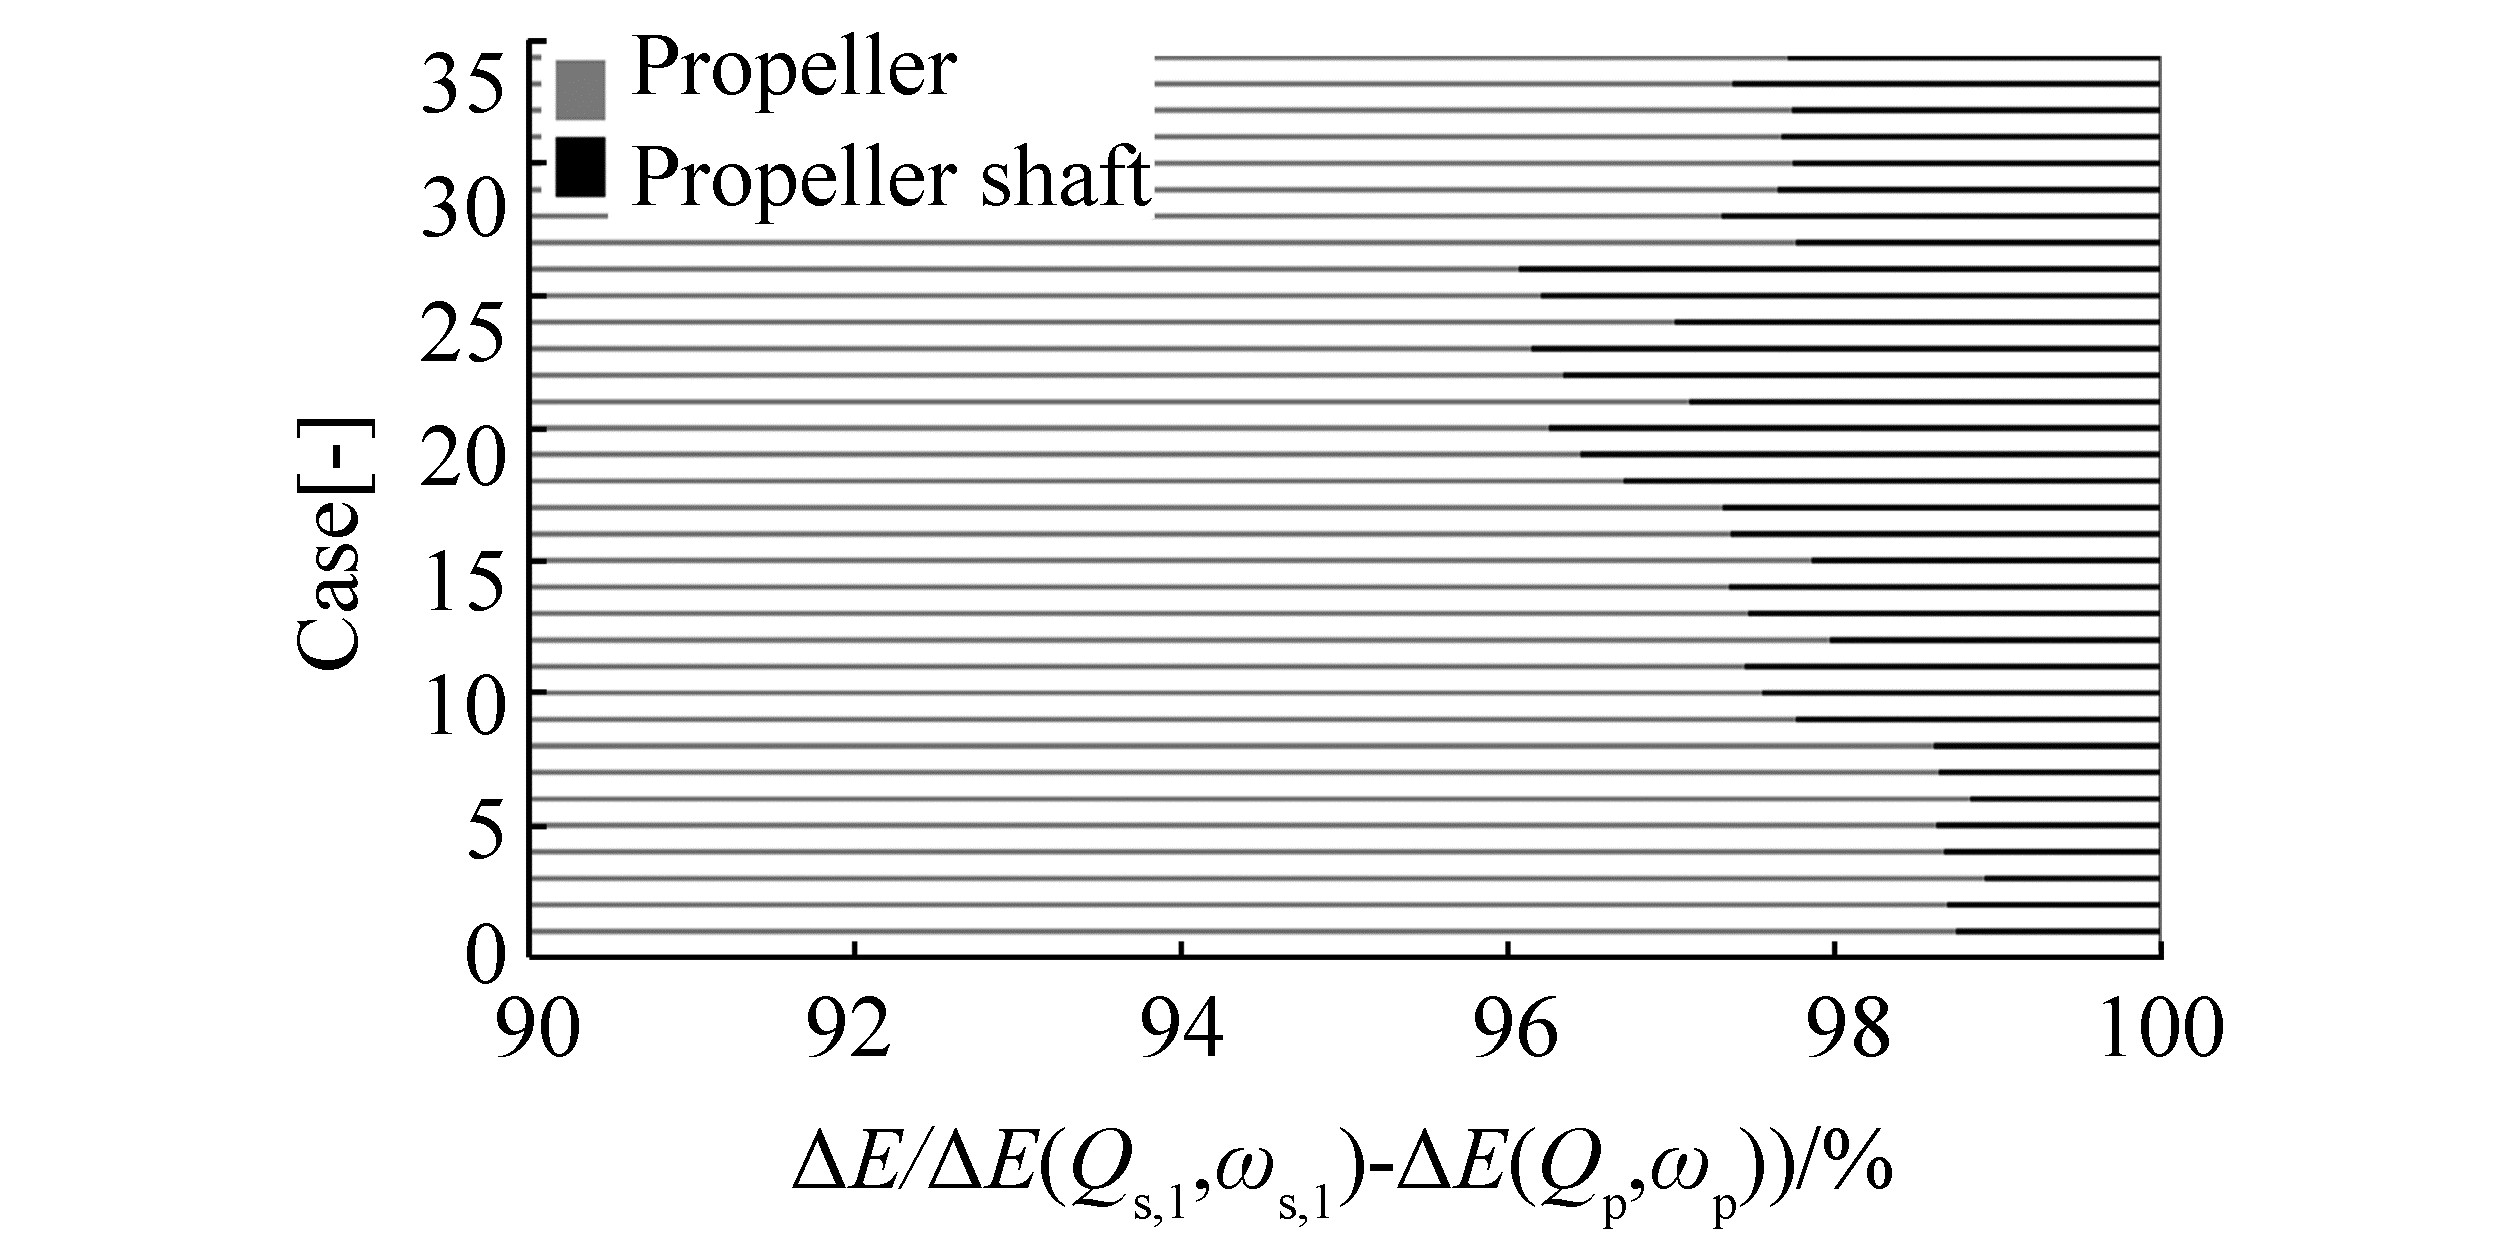
Although the maximum and minimum angular velocity difference in every analyzed case is smaller than the maximum and minimum torque difference (see Figure 8 and 7, respectively), the angular velocity difference cannot be neglected. This difference includes system deformation and should be treated in the same way as the torque difference. Therefore, the energy exchange between the propeller and propeller shaft at each point in the time is derived as a product of the torque, angular velocity, and time step. In Figures 9 and 10, the derived energy exchange [ΔE(Qs, 1, ws, 1)−ΔE(Qp, wp)] at two time instances is compared and correlated with the energy associated with the motion and position of the propeller and propeller shaft.
This energy is mechanical energy, and it is equal to the sum of kinetic, potential, and dissipated energy. The propeller, which is modeled as a rigid disc, possesses only kinetic energy because of its angular velocity, while the propeller shaft, which is modeled as a continuous body, possesses all three types of the energy because of its angular velocity, angular deformation, and non-conservative forces (e.g., damping).
The distribution of the mechanical energy between the propeller and propeller shaft illustrated in Figures 9 and 10 depends on the propulsion machinery design (inertia, stiffness, damping) and the transient state of the system (angular deformation and velocity). Kinetic energy is the most dominant mechanical energy in the system, and the propeller inertia is greater than the propeller shaft inertia. Thus, the propeller kinetic energy accounts for 95%-99% of the energy exchange between the propeller and propeller shaft.
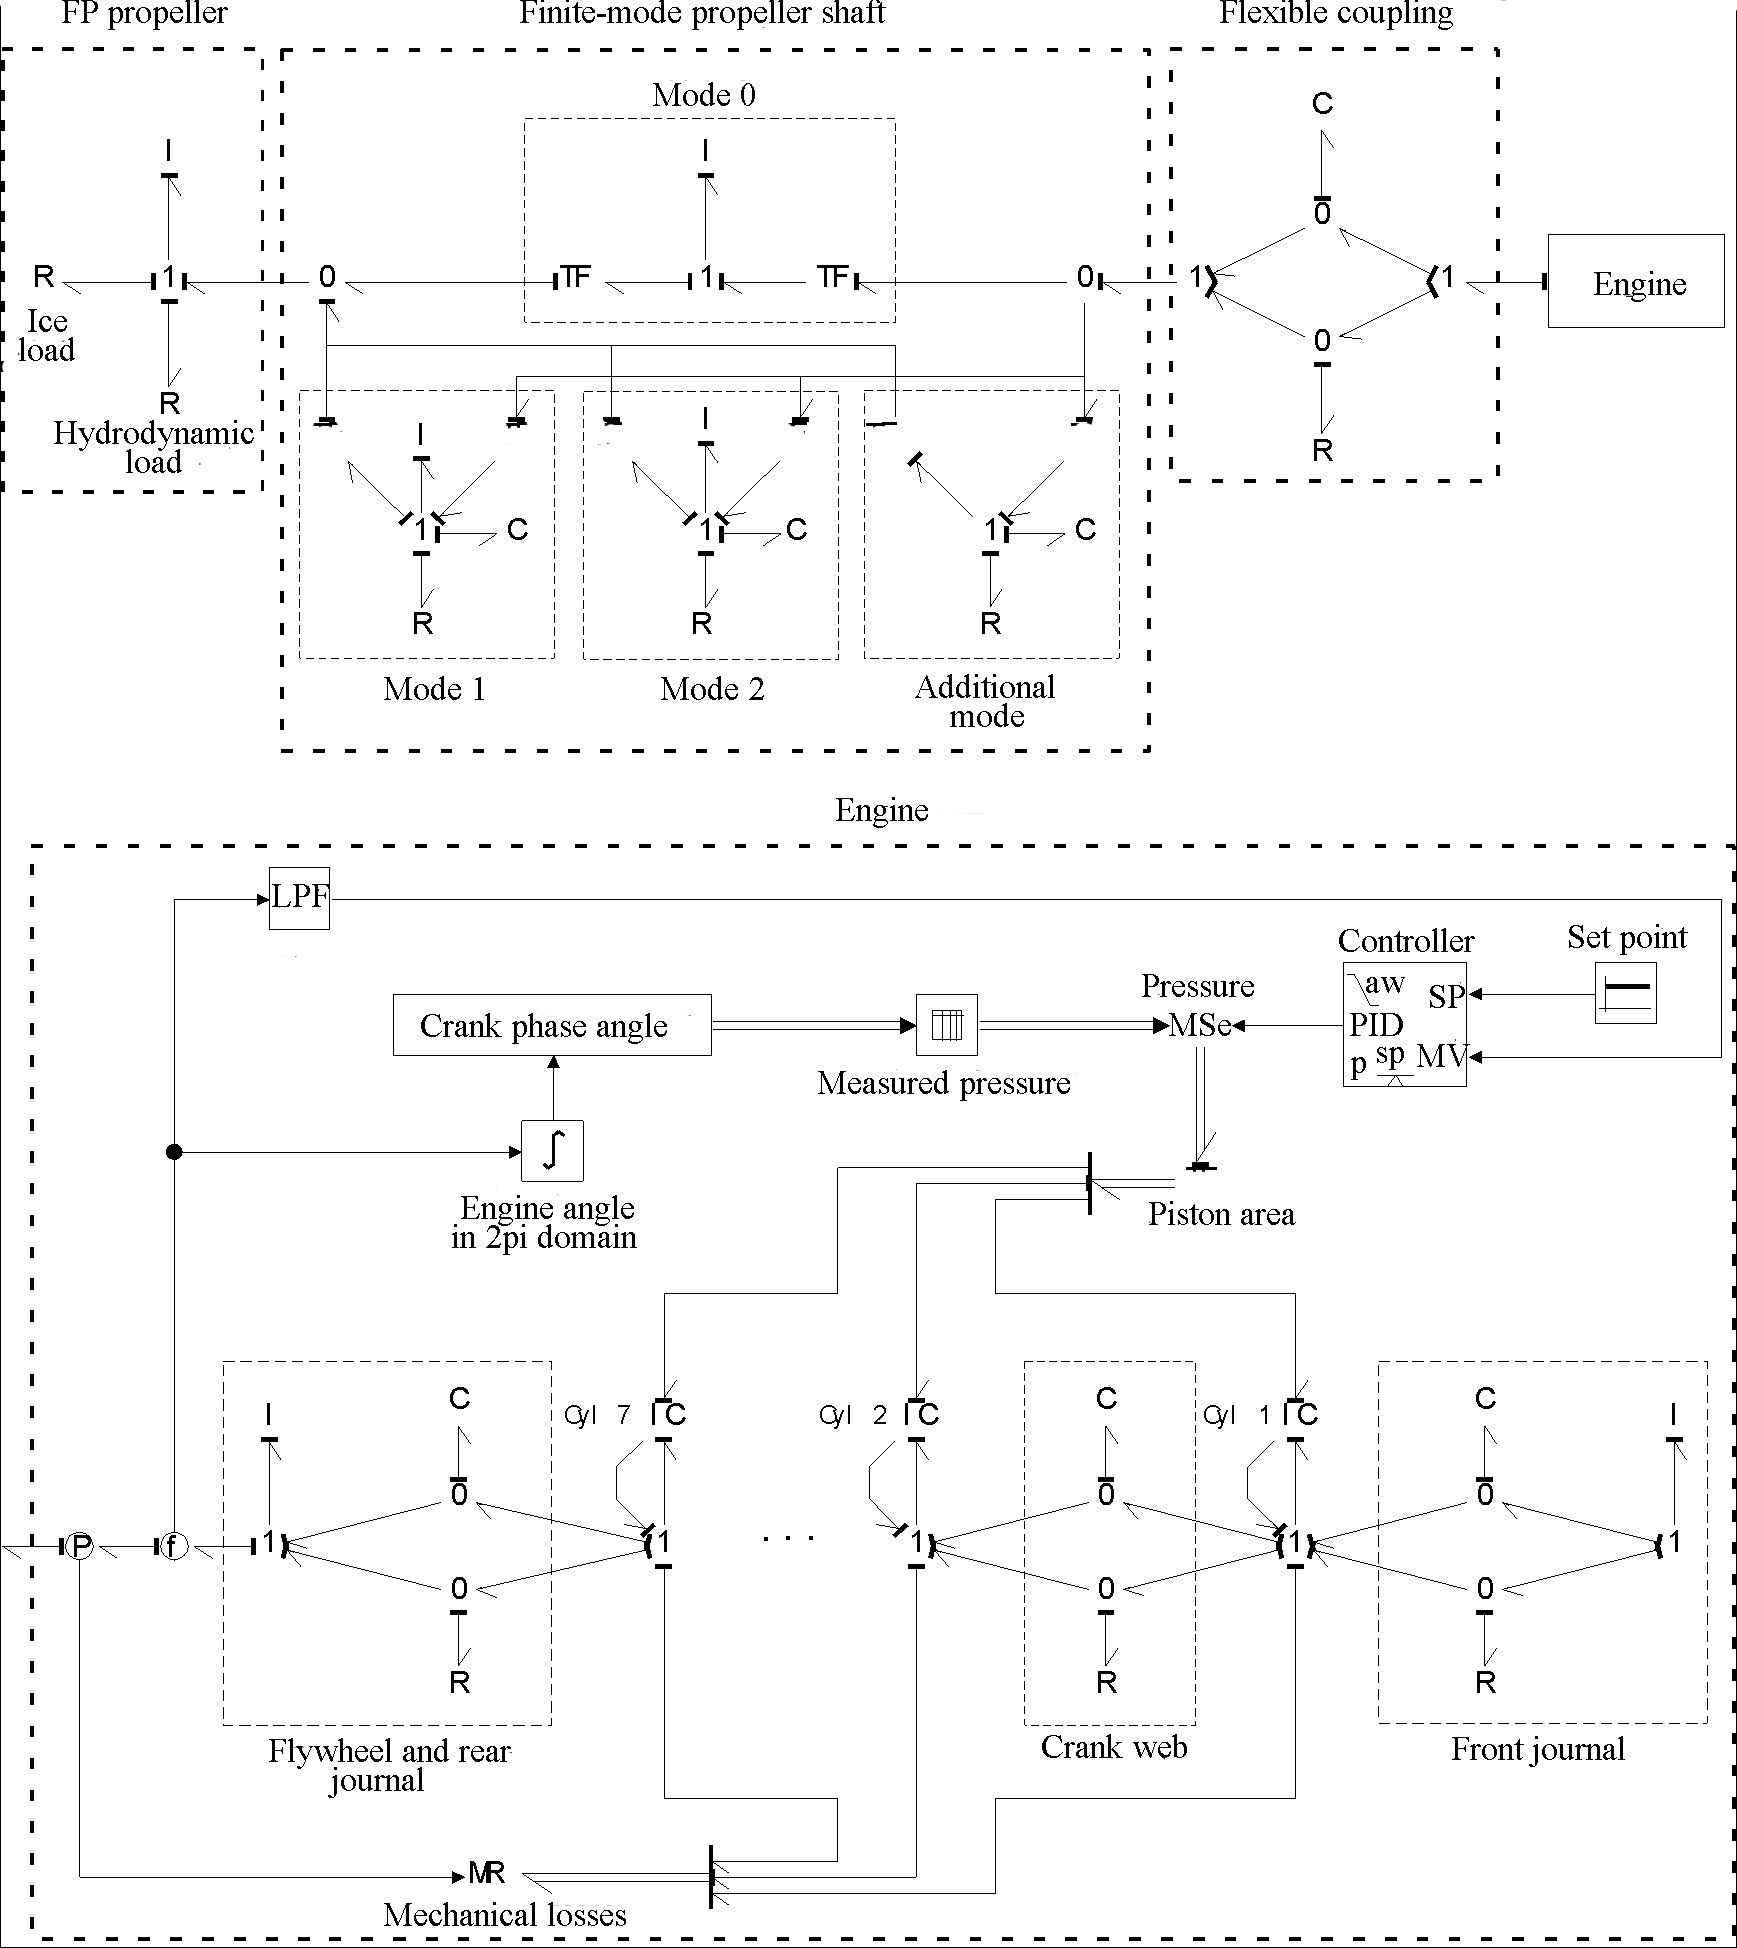
The mechanical energy subjected to conservative forces, summarized in the kinetic and potential energy, can be released or absorbed, while energy subjected to non-conservative forces can only be absorbed. An example is given in Tables 4 and 5 for case 15, where the release of mechanical energy is indicated with a minus sign and the absorption of mechanical energy is indicated with a plus sign. The choice of the sign is a result of the initial assumption in the BG model. The positive flow of the energy is set with the direction of the bond signal (half arrow) and, in the BG model illustrated in Figure 3, all I-, C-, and R-elements are assumed to absorb energy. The amount of absorbed or released energy in each I-, C-, and R-element represents kinetic, potential, and dissipated energy, respectively, and it is derived as a product of the torque, angular velocity, and time step.
| J | |||||||||||||||||
| Total difference | Propeller (mode 0) |
Propeller shaft | |||||||||||||||
| mode 0 | mode 1 | mode 2 | mode 3 | ||||||||||||||
| ΔE(Qs, 1, ωs, 1)-ΔE(Qp, ωp) | ΔE(Jp0) | ΔE(Js0) | ΔE(Js1) | ΔE(ks1) | ΔE(cs1) | ΔE(Js2) | ΔE(ks2) | ΔE(cs2) | ΔE(ks3) | ΔE(cs3) | |||||||
| −3577.6 | −3483.1 | −86.8 | −1·10−3 | −6.8 | 4·10−4 | 2·10−8 | 9·10−5 | 5·10−9 | −0.9 | 2·10−5 | |||||||
| =−6.8 | =0 | =−0.9 | |||||||||||||||
| =−3577.6 | |||||||||||||||||
| J | |||||||||||||||
| Total difference | Propeller (mode0) |
Propeller shaft | |||||||||||||
| mode 0 | mode 1 | mode 2 | mode 3 | ||||||||||||
| ΔE(Qs, 1, ωs, 1)-ΔE(Qp, ωp) | ΔE(Jp0) | ΔE(Js0) | ΔE(Js1) | ΔE(ks1) | ΔE(cs1) | ΔE(Js2) | ΔE(ks2) | ΔE(cs2) | ΔE(ks3) | ΔE(cs3) | |||||
| 2845.3 | 2774.1 | 69.2 | −3·10−4 | 1.8 | 3·10−5 | −5·10−7 | 2·10−4 | 4·10−8 | 0.2 | 2·10−6 | |||||
| =1.8 | =0 | =0.2 | |||||||||||||
| =2845.3 | |||||||||||||||
|
| Figure 3 Bond graph model of the propulsion machinery system modeled in the 20-sim software |
In the same tables, a detailed distribution of the mechanical energy between kinetic, potential, and dissipated components, as well as the balance of the energy, is given for two time instants.
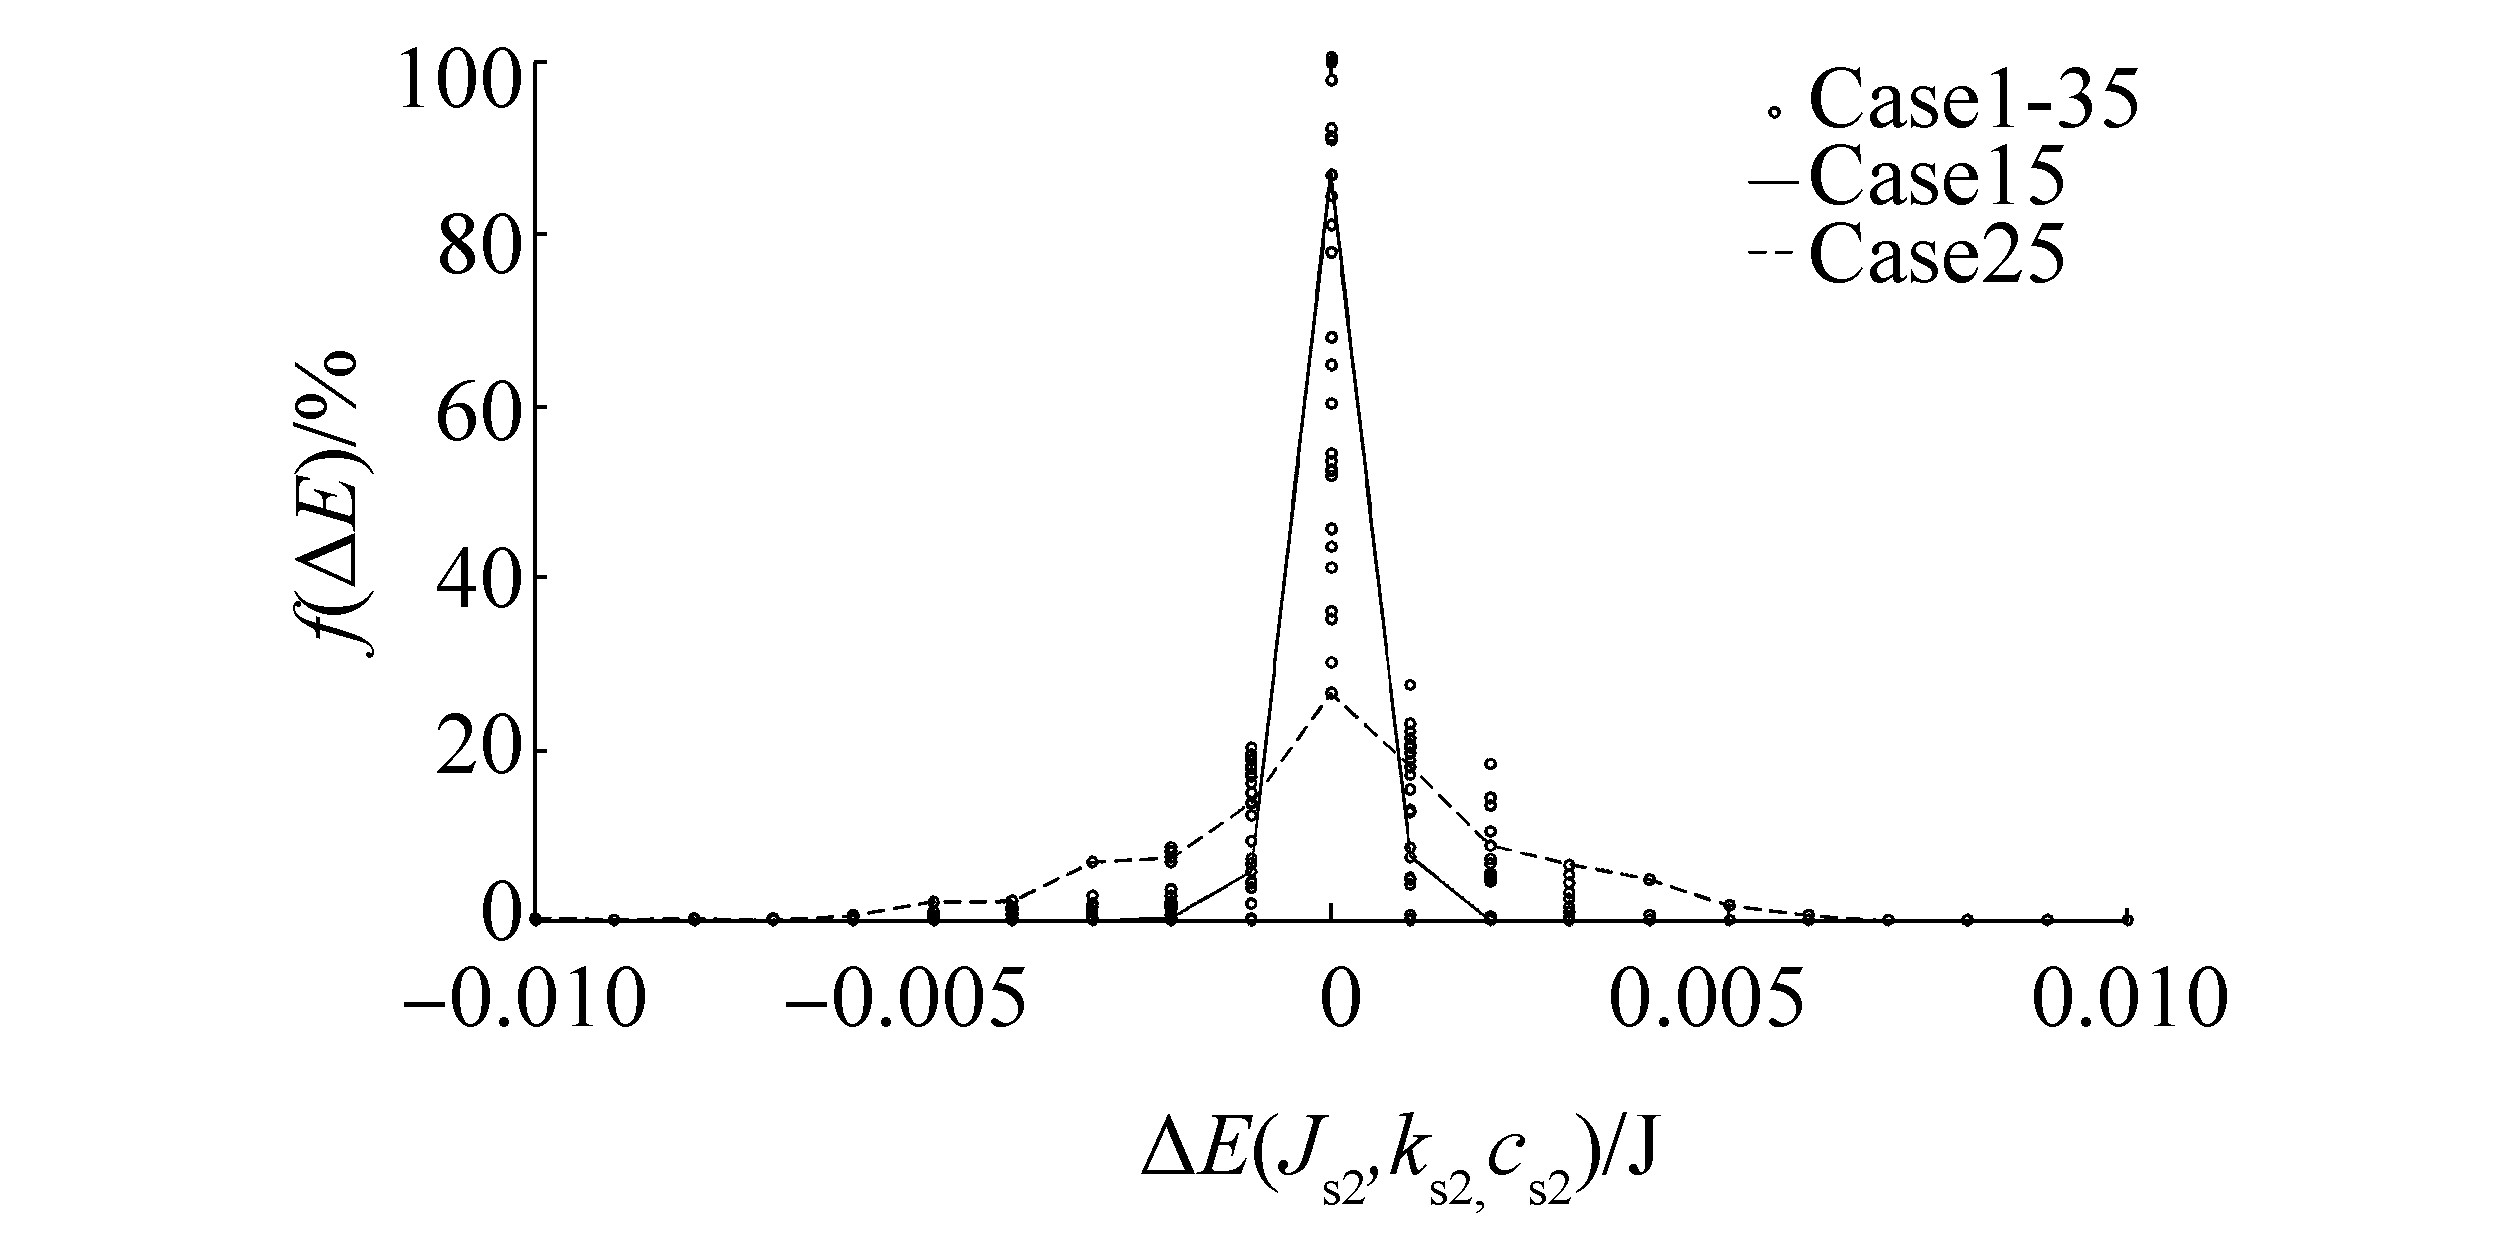
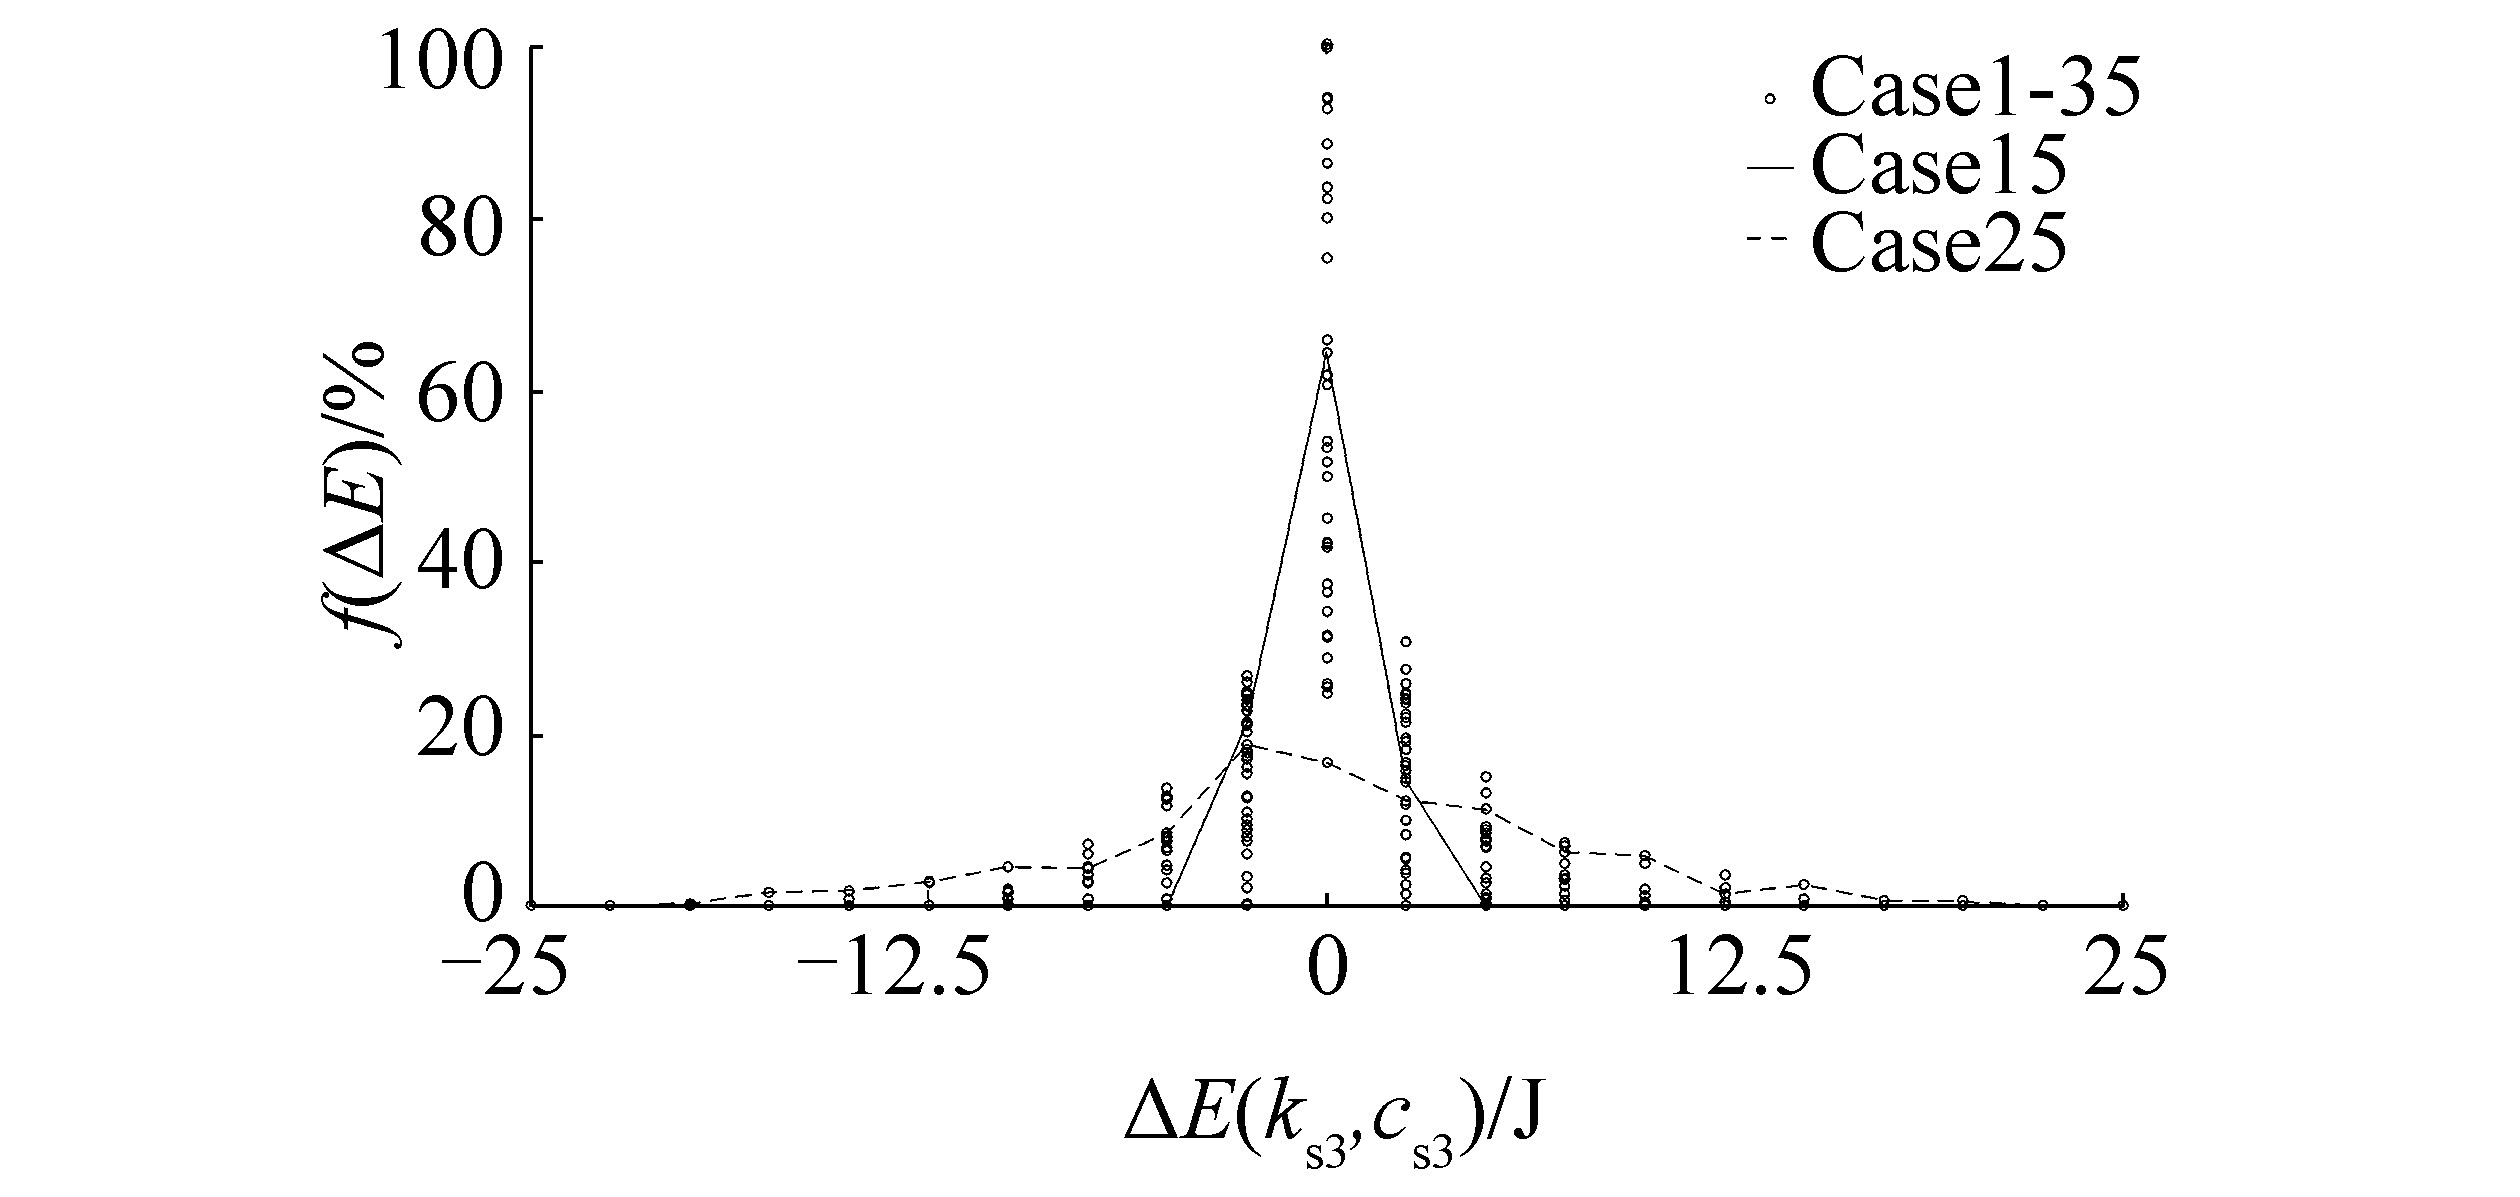
Given that the amount of the mechanical energy absorbed by BG elements is constantly changing during ice-propeller interaction, the distribution of mechanical energy between propeller and propeller shaft modes during the entire time history of all 35 cases is evaluated as a function of a span and Probability Density Function (PDF). The latter is illustrated in Figures 11 to 15 as a set of circles. Based on the span of the energy (ΔE), the difference between propeller and propeller shaft torque and angular velocity depends mostly on the propeller kinetic energy, followed by the kinetic energy of the rigid body mode of the propeller shaft, and finally the energy of the odd-numbered flexible modes of the propeller shaft. The contribution of the second mode, as expected, can be neglected because of the symmetry of the mode shape. In addition, an important detail to note is that 21 bins exist in Figures 11 to 15, and the corresponding PDF value (f(ΔE)) for the energy in the middle of graph denotes the energy in the range of the interval, set by the bin width, with a mean value of 0.
Considering individual cases, the span of the absorbed and released energy is approximately equal, but the shape of PDF is not necessary symmetrical for all cases. In Figures 11 and 12, the shape of the PDF changes from fairly symmetric (i.e., case 15) to skewed right (case 33). The explanation for the latter is that during the ice-propeller interaction, the angular velocity of the system drops and kinetic energy absorbed by the rigid body is released (indicated with a negative sign). Case 33 is an extreme case that considers the highest ice class (1A*) and a three-bladed propeller, which generates non-continuous ice-propeller impacts (see Figure A1 in Appendix A). As a result, case 33 has the largest drop in angular velocity and hence corresponding release of kinetic energy.
Unlike the rigid mode, angular velocities in the flexible modes are small and are the result of the deformation caused by the oscillation of the propeller torque load, which gives fairly symmetric oscillations in the case of the rule-based load. Consequently, the shape of the PDF for flexible modes, illustrated in Figures 13 to 15, is fairly symmetric. The largest torque difference and angular deformation between the two ends of the propeller shaft is observed in case 25, where the weakest diesel engine (w=5) is connected to the four-bladed FP propeller through the stiffest flexible coupling (1.5kstatic) and the longest propeller shaft (1.5Lshaft).
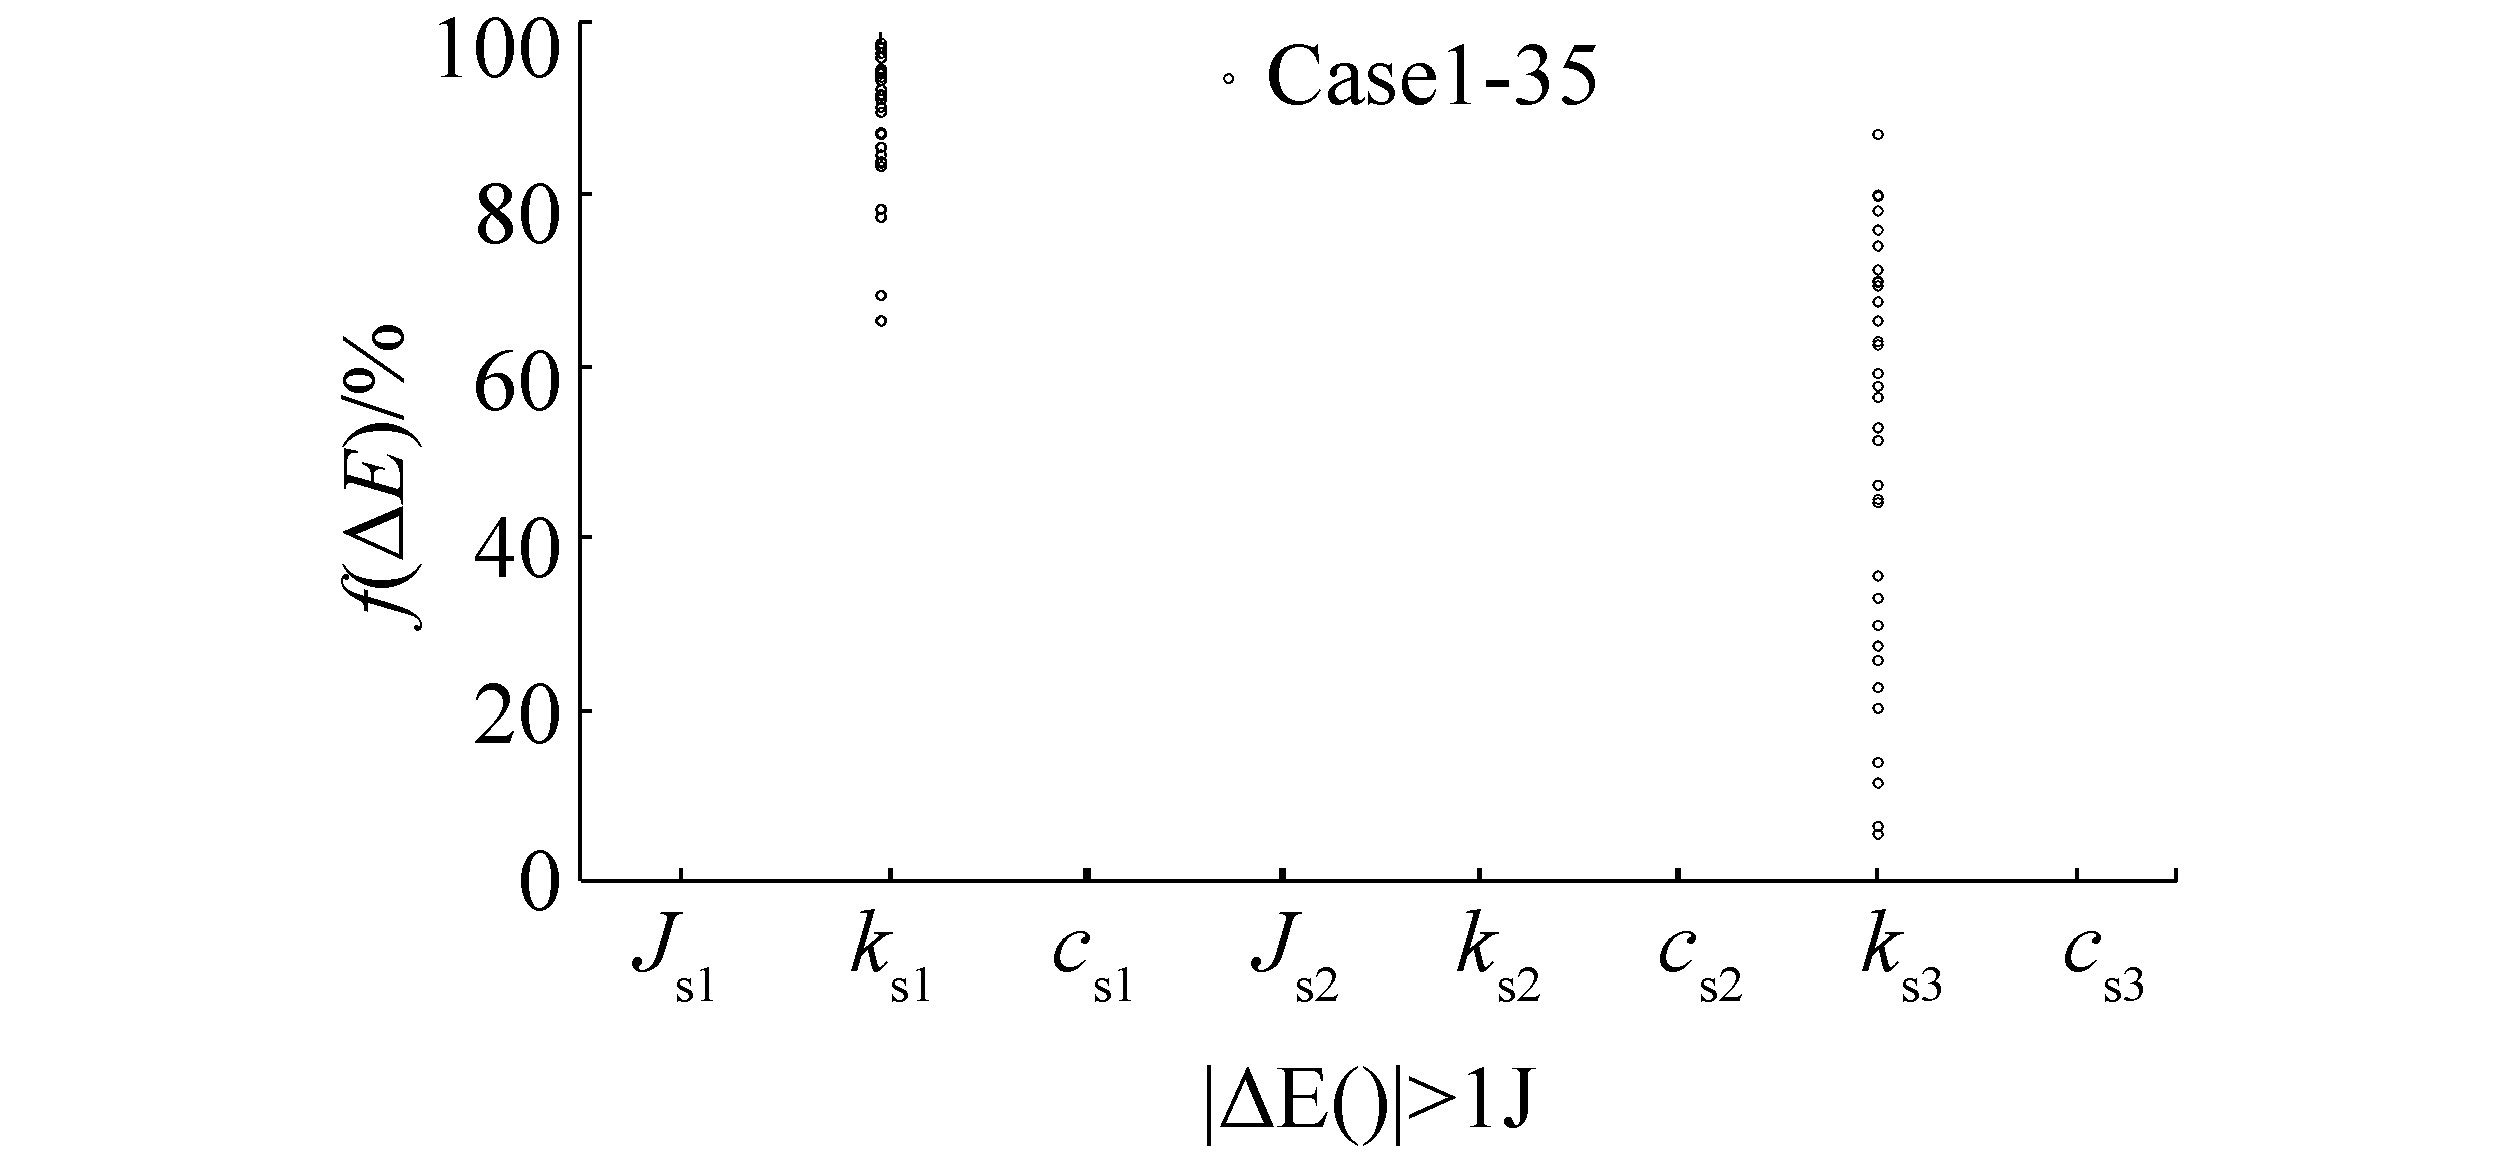
Because the width of the bin in Figures 13 to 15 varies, and the influence of kinetic, potential, and dissipated energy in the flexible propeller shaft modes is not illustrated; the probability of the energy taking on a value above the threshold limit of 1J for all cases at any point in the simulation time is illustrated in Figure 16. Therefore, the distribution of mechanical energy in Figures 13 and 15 can be related to the potential energy in the first and third modes, respectively.
5 Summary and ConclusionThe differences between the torque and angular velocity in the propeller and propeller shaft during the ice-propeller interaction are examined for 35 propulsion machinery system design cases (different ice classes, number of propeller blades, propeller shaft length, flexible coupling stiffness, and number of cylinders). Time history examples and minimum-maximum observations of the torque and angular velocity differences are shown. On the basis of the time history, the rate of energy exchange between the propeller shaft response and propeller torque is divided into mechanical energy stored in the propeller and the propeller shaft.
The dynamic exchange of mechanical energy is presented as a function of the span and PDF, and split between modes. On the basis of the span, we concluded that torque and angular differences mostly depended on the propeller kinetic energy, followed by the kinetic energy stored in the rigid mode of the propeller shaft, and finally the mechanical energy in the first and third flexible modes of the propeller shaft. Mechanical energy in the second flexible mode can be neglected and hence omitted from the model. Energy PDF is mostly skewed to the right for the rigid mode and fairly symmetrical for the flexible modes. The shape of the PDF distribution for the rigid and flexible modes is related to the angular velocity drop and the shape of the ice-related torque, respectively.
The influence of mechanical energy in the odd-numbered flexible modes can be related to the potential energy because the contribution of the kinetic and dissipated energy at any point in time is smaller than 1 J.
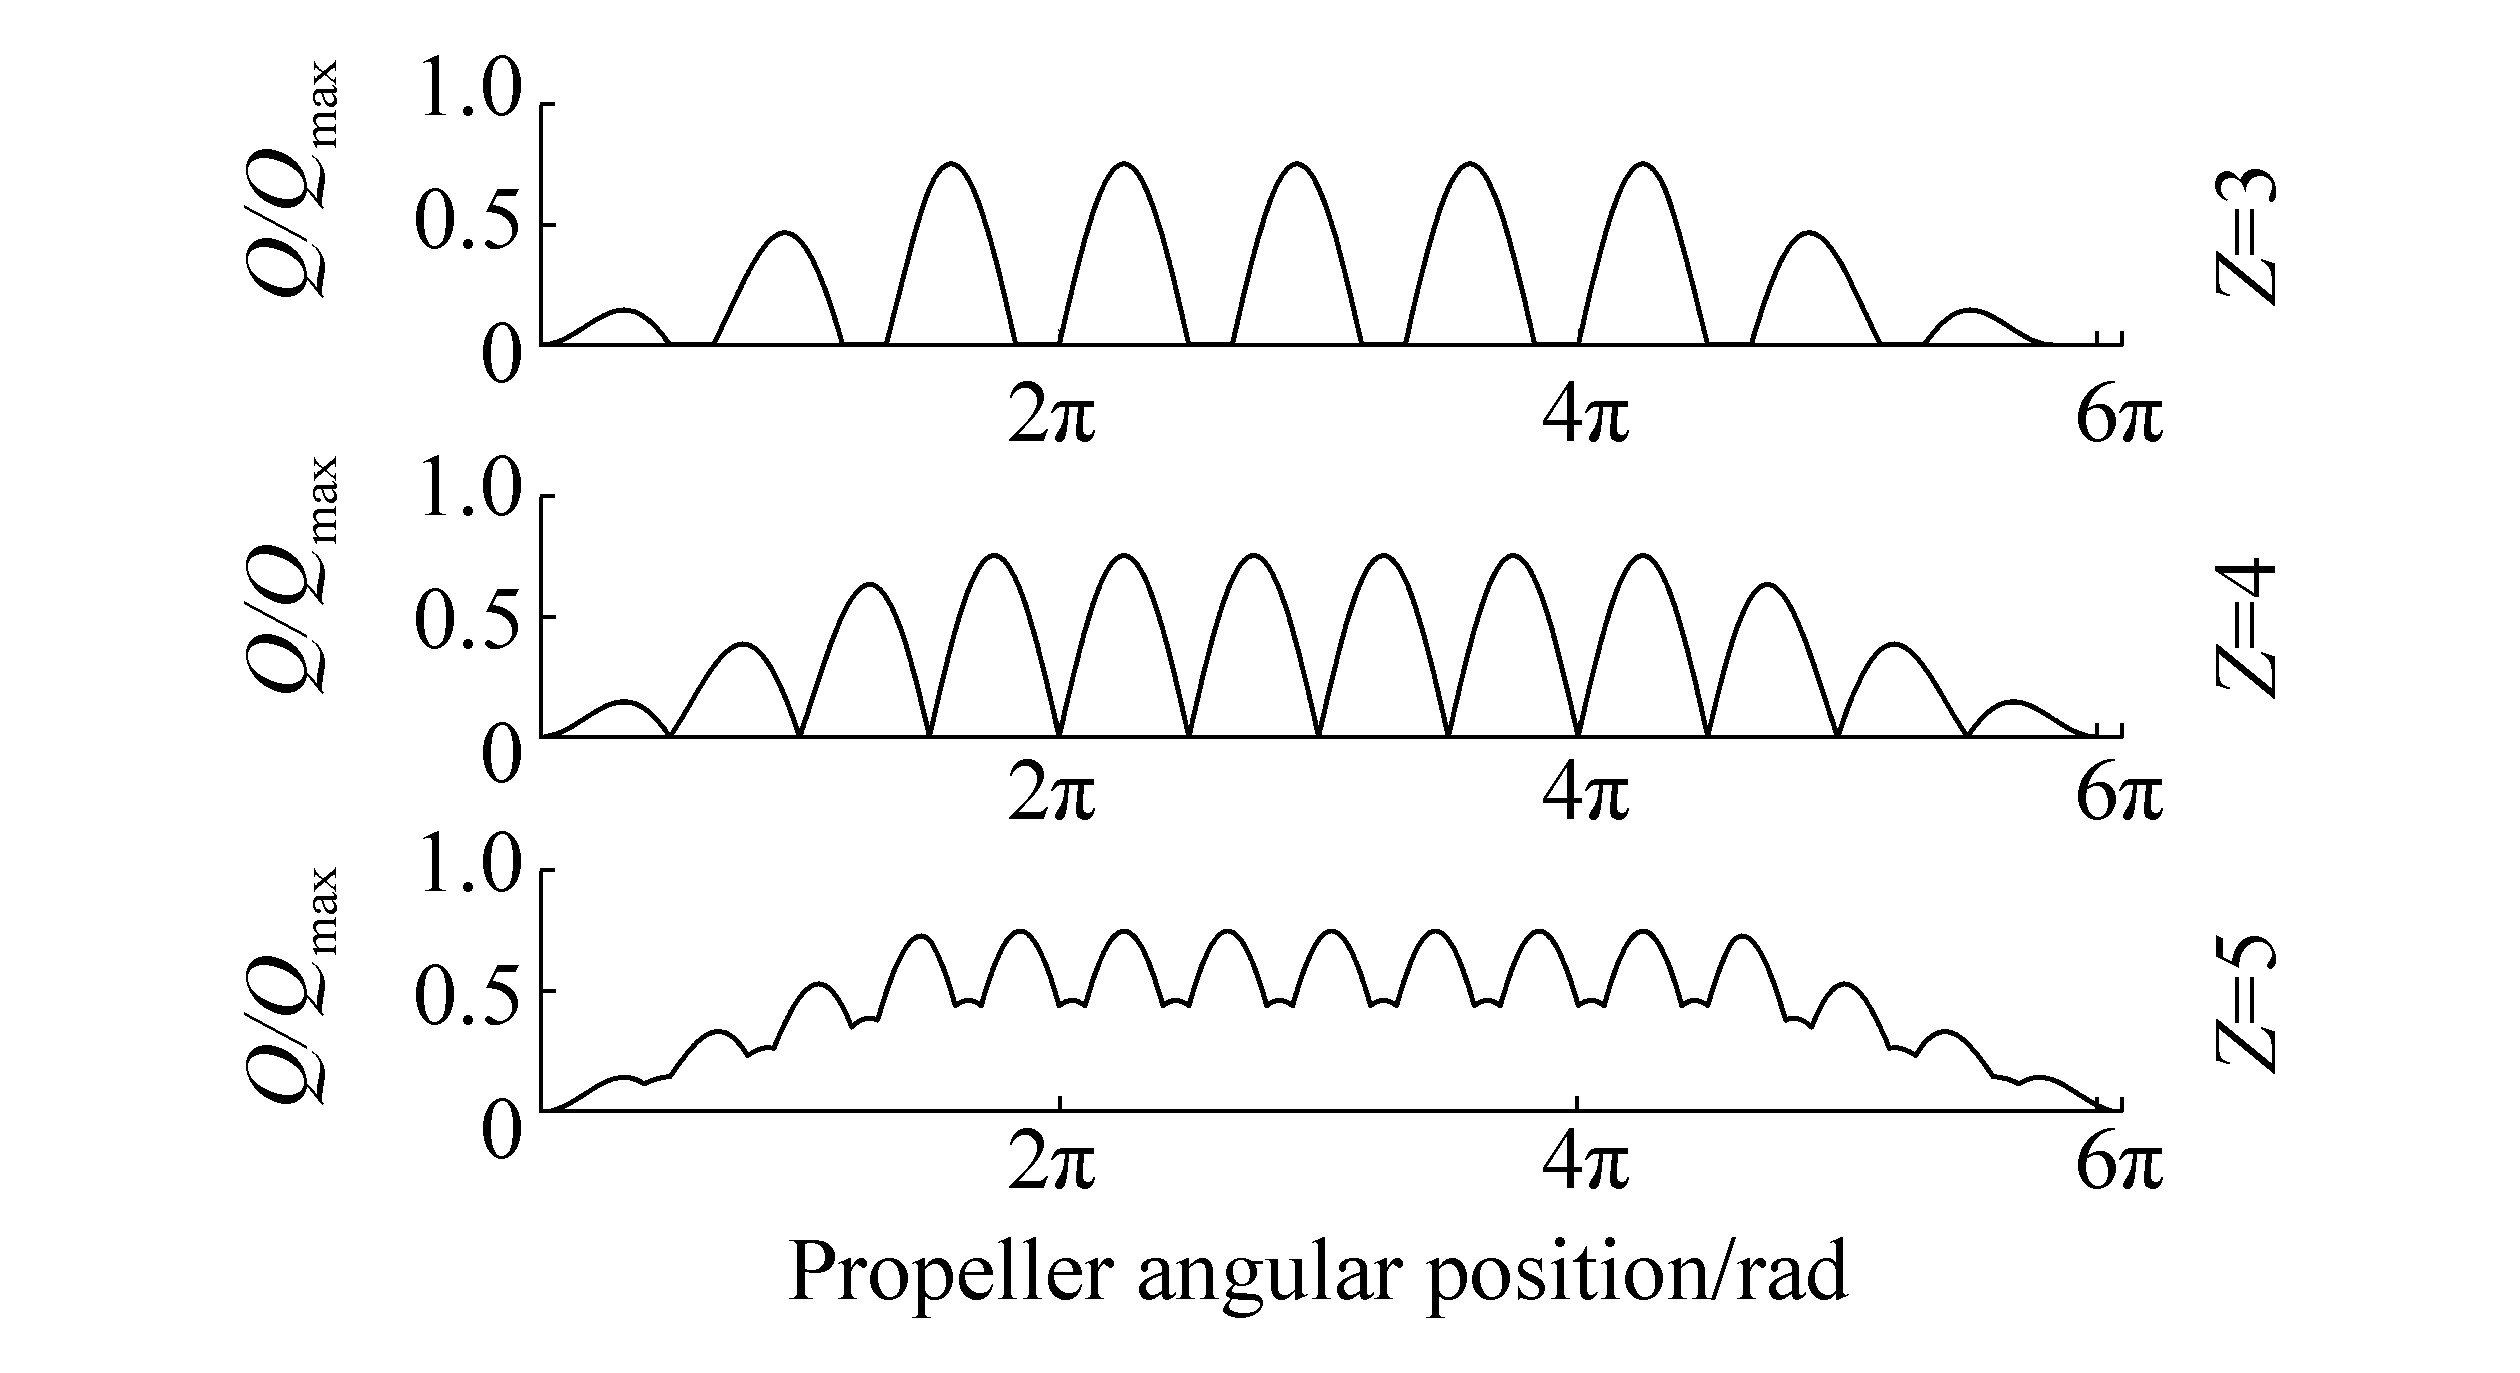
Appendix A: Ice-propeller interactionThe most common ice-propeller interaction angle (αice=90°) is adopted from DNV rules (2016) for ice-strengthened vessels. The resulting impact sequences for each propeller alternative are calculated according to the rules as a function of ice-class, the number of blades Z, and angle αice. Figure A1 illustrates the impact sequence for a 1A ice class propeller with variable Z, while all impact sequences used in the paper are summarized in Table A1.
|
| Figure A1 Impact sequence for 1A ice class propellers with DNV excitation case 1 (Hice=1.5 m). Distinct angular difference between ice impacts is a result of a different angle between blades and the number of propeller blades (Z) |
| Ice-class 1B | Ice-class 1A | Ice-class 1A* | |||||||
| Nice | φice | Nice | φice | Nice | φice | ||||
| Z=3 | 8 (7.2) | 5π+π/6 | 9 | 5π+5π/6 | 11 (10.5) | 7π+π/6 | |||
| Z=4 | 10 (9.6) | 5π | 12 | 6π | 14 | 7π | |||
| Z=5 | 12 | 4π+9π/10 | 15 | 6π+π/10 | 18 (17.5) | 7π+3π/10 | |||
| Nice is the number of ice impacts and φice is the total angular propeller displacement during the ice-propeller interaction. | |||||||||
| Allen RR, 1979. Multiport representation of inertia properties of kinematic mechanism. Journal of The Franklin Institute, 308 (3), 235-253. DOI: http://dx.doi.org/10.1016/0016-0032(79)90115-7 |
| Balyts'kyi OI, Kawiak M, Kawiak P, 2013. Assessment of the fatigue damage to the propeller shaft in a sea water. Materials Science, 49(1), 130–133. DOI:10.1007/s11003-013-9592-4 |
| Borutzky W, 2010. Bond graph methodology. London: Springer. |
| Borutzky W, 2011. Bond graph modelling of engineering systems. London: Springer. |
| Brown RP, Revill CR, Ritch AR, Keinonen AJ, 1998. Propeller design load model. Report No. TP 13243E. Institute for Ocean Technology, National Research Council of Canada. |
| Dahler G, Stubb JT, Norhamo L, 2010. Propulsion in ice-big ships. ICETECH '10, paper No. 133. |
| DNV (Det Norsk Veritas), 2016. Ships for navigation in ice. |
| Hänninen S, 2004. Incidents and accidents in winter navigation in the Baltic Sea, winter 2002-2003. Research report No. 54, Winter Navigation Research Board, 44 pages. |
| Ikonen T, Peltokorpi O, Karhunen J, 2014. Inverse ice-induced moment determination on the propeller of an ice-going vessel. Cold Regions Science and Technology, 112, 1-13. DOI: http://dx.doi.org/10.1016/j.coldregions.2014.12.010 |
| Karnopp DC, 1992. An approach to derivative causality in bond graph models of mechanical systems. Journal of the Franklin Institute, 329(1), 65-75. DOI: http://dx.doi.org/10.1016/0016-0032(92)90096-Y |
| Karnopp DC, 1997. Understanding multibody dynamics using bond graph representations. Journal of the Franklin Institute, 334(4), 631-642. DOI: http://dx.doi.org/10.1016/S0016-0032(96)00083-X |
| Karnopp DC, Margolis DL, Rosenberg RC, 2005. System dynamics-modeling and simulation of mechatronic system. John Wiley & Sons Inc. |
| Koskikivi J, Kujala P, 1985. Long-term measurements of ice induced loads on the propulsion machinery of product tanker Sotka. Research Report No. 42, Technical Research Center of Finland (VTT), Espoo, 105 pages. |
| Polić D, Ehlers S, Æsøy V, Pedersen E, 2014. Shaft response as a propulsion machinery design load. Proc. 33rd International Conference on Offshore Mechanics and Arctic Engineering, (OMAE), San Francisco, USA. |
| Polić D, Æsøy V, Ehlers S, 2016. Transient simulation of the propulsion machinery system operating in ice-modeling approach. Ocean Engineering, 124, 437-449. DOI: http://dx.doi.org/10.1016/j.oceaneng.2016.07.011 |
| Sampson R, 2009. The effect of cavitation during propeller ice interaction. PhD Thesis, University of Newcastle, Newcastle. |
| Varma G, 2000. Ice loads on propellers under extreme operating conditions. Master of Engineering Thesis, Memorial University of Newfoundland, St. John's, Newfoundland. |
| Veitch B, 1995. Predictions of ice contact forces on a marine screw propeller during the propeller-ice cutting process. Acta Polytechnica Scandinavica, Mechanical Engineering Series No. 118, Helsinki. |
| Walker D, 1996. The influence of blockage and cavitation on the hydrodynamic performance of ice class propellers in blocked flow. PhD Thesis, Memorial University of Newfoundland, St. John's, Newfoundland. |
| Wang J, 2007. Prediction of propeller performance a model podded propulsor in ice. PhD Thesis, Faculty of Engineering and Applied Science Memorial University of Newfoundland, St. John's, Newfoundland. |


