2. Faculty of Geoscience and Petroleum Engineering, Universiti Teknologi PETRONAS, 32610 Perak, Malaysia;
3. Department of Civil Engineering, Univerisiti Tenaga Nasional, Selangor, 43650, Malaysia;
4. Department of Civil & Environmental Engineering, Universiti Teknologi PETRONAS, 32610 Perak, Malaysia
1 Introduction
A 9.3-Mw earthquake off the north west coast of Aceh, Indonesia on December 26, 2004 led to the generation of tsunami waves that tragically resulted in the loss of thousands of lives across 12 countries in Southeast Asia.
Malaysia is located in an area affected by tsunamis, which are caused mainly by earthquakes in the neighboring seismically active Philippines. Within and around the Philippines, there are several active trenches that are classified as subduction zones, namely the Manila Trench, Negros Trench, Sulu Trench, Cotabato Trench, and Philippine Trench. At the Manila Trench, the Sunda Plate is currently undergoing subduction under the Philippines Mobile Belt, at a rate of 70 millimeters per year. In 2006, it was categorized by the United States Geological Survey's (USGS's) Tsunami Sources Workshop as one of the most risky trenches for earthquakes. Hence, while there is a need to proactively quantify this risk, it is not possible without purpose-specific research. It has been noted that the assessment of hazard in this area may be impeded due to uncorrelated earthquake magnitudes and resulting tsunamis (Vita-Finzi, 2015).
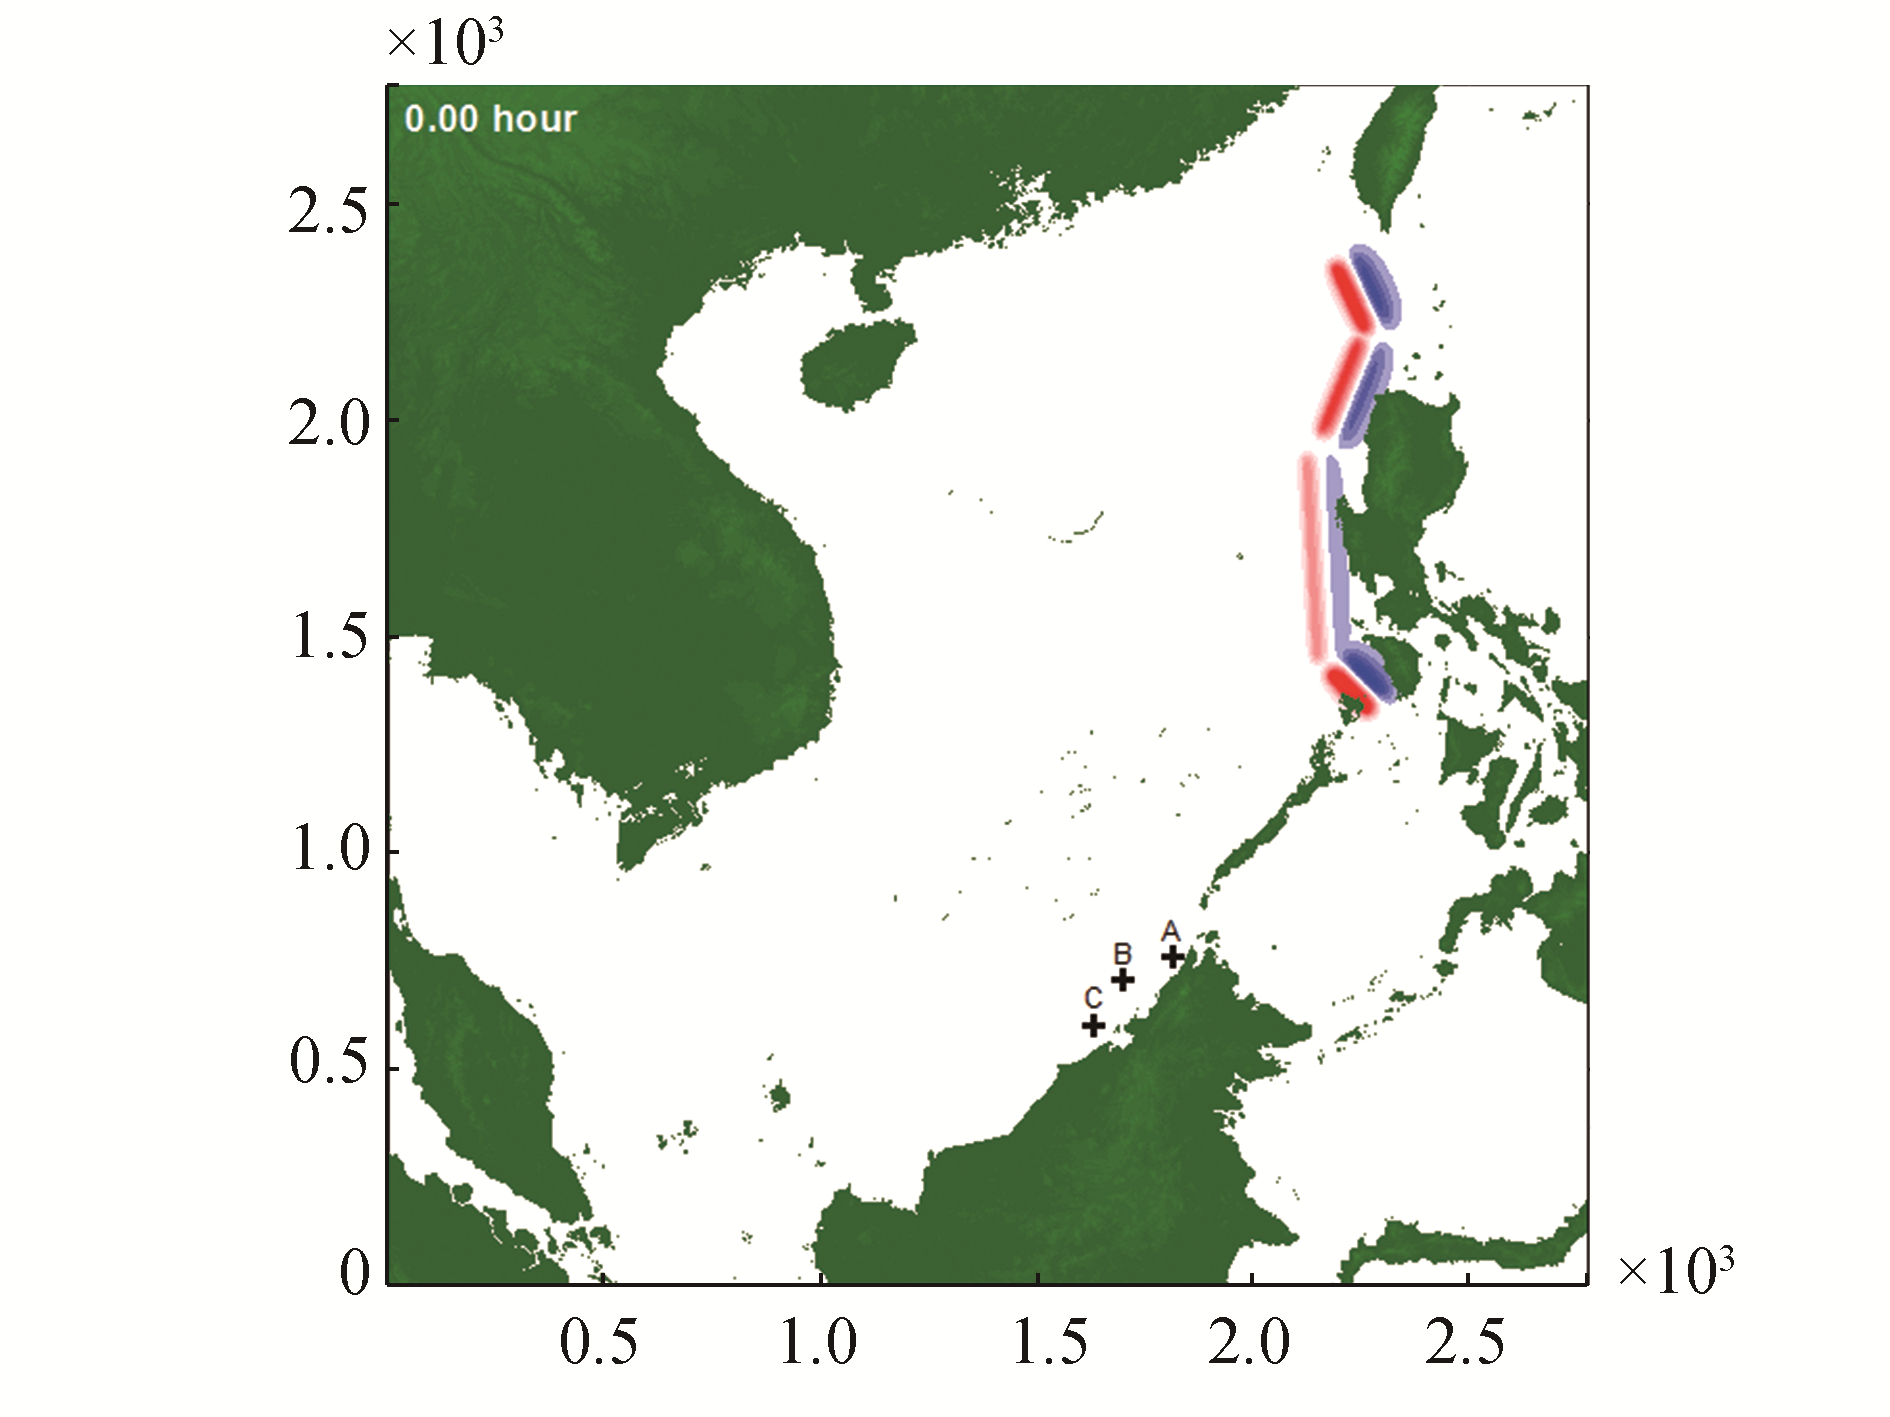
Many researchers have predicted that the next earthquake to come from the Manila Trench has a high potential to trigger a powerful tsunami. As shown in Fig. 1, a tsunami propagating from the highlighted source may inflict damage to several countries immediately in its path, including Malaysia's West Peninsular Coast, Sabah, and Sarawak which are home to over 800 offshore oil and gas facilities. The purpose of this work is to simulate tsunami waves propagating across the South China Sea from the Manila Trench to ascertain their effects on conventional four-legged jacket platforms in Malaysian waters. We propose a novel front-end risk matrix model for these platforms and utilize it to categorize the risk level to a specific jacket. Although designed specifically for similar four-legged jackets, this work also lays a sound framework for use with other global platforms in formulating their respective tsunami-risk rating models. The proposed risk-matrix model is can enable effective fast-track, front-end decision making in the aftermath of a tsunami. The application of this model is also appropriate where seaquake information is made immediately available to the platform owner, to enable the estimation of the in-situ tsunami magnitude, and to gauge its risks. The need for this model was accentuated by Megawati et al. (2009), who pointed out that the Manila Trench has been dormant for almost 440 years, suggesting that the strain has been accumulating since that time. Work by Wu and Hui (2009) reiterated that the USGS, during the 2006 Tsunami Sources Workshop, categorized the Manila Trench as being a risky zone for a tsunami source. The authors also quoted Kirby et al. (2006) in stating that there are up to six possible fault planes based on the azimuth of the Manila Trench.
|
| Figure 1 Position of the Manila Trench |
Since the 2004 tsunami, many researchers have simulated tsunami waves in the vicinity of nearby countries such as Thailand, the Philippines and Taiwan region. As yet, however, the effects of a tsunami event from the Manila Trench on Malaysia's offshore regions are relatively uncertain and unstudied. In the wake of a mature offshore oil and gas industry and aging fixed offshore platforms, it is prudent to systematically study, quantify, and categorize the effects of a tsunami event on such offshore installations. The simulations and analyses performed in this study will enable better management of hazard risks and mitigation measures. In this paper, we mainly discuss the region offshore North Borneo in Sabah, where a conventional four-legged fixed-jacket living-quarters platform is located, referred to in this paper as Platform A, and model this platform being subjected to tsunami waves propagating from the Manila Trench.
A toppled offshore platform is not only a serious threat to human life and investment, but also poses environmental degradation issues. It is crucial that the risks posed by a tsunami event on fixed jacket platforms be evaluated. One of the main characteristics of a resilient community in the face of natural disasters such as tsunamis is having the“ability to access, manage, and monitor its risks” (ARUP Int., 2011). In addition, communities should not solely depend on man-designed protection for defense against tsunami events (Koshimura et al., 2014). Tsunami wave heights, from earthquakes of different magnitudes at oil blocks of interest, were obtained from a tsunami model simulation utilizing the propagation software TUNA-M2, which is based on linearized shallow water equations. TUNA-M2 software has been shown to produce outputs comparable to those of more established models such as the Cornell Multi-grid Coupled Tsunami Model (COMCOT) (Koh, et al., 2009), hence it is inferred that the depth-averaged formulation of its equations yield reasonably accurate results. Linear shallow-water equations are often utilized to simulate the oceanic propagation of tsunami waves (Kim et al., 2011), while neglecting the non-linear advective forces due to their small wave slope (Imamura et al., 1988). In this study, we simulate a hydrodynamic coupled finite element structural analysis of an offshore platform using SACS v5.3 suite software. To compute the forces on the jacket's tubular members by the impact of the simulated tsunami wave, we used the solitary wave theory, which is consistent with the practice of describing tsunamis as a solitary wave in shallow water (Takagi, 1996). As with a great majority of fixed offshore platforms in Malaysian waters, Platform A is located 60 km from the nearest coastline, on the relatively flat continental shelf that has negligible slope effects in even long wave simulations. Therefore, the non-linear effects of the bathymetry and coastal features were not not considered in this study, as the structure in question is outside the dynamic coastal zone.
We also formulated a methodology to quantify risk for an offshore platform in the event of a tsunami. The proposed method assesses the risks to offshore assets as deterministic metrics with a clear demarcation of risk levels and consequent brief standard operating procedures. This approach differs from probabilistic models, such as those applied by Jaimes et al. (2016), wherein the authors proposed a model for financial risk assessment of a near-coastal infrastructure based on historical data sets. To be effective, risk rating systems must be designed for the structure that is being evaluated and, currently, offshore systems lack quantification in this aspect. Most research to date has focussed on coastal or near-shore infrastructure with various work addressing the failure mechanisms and the availability of risk mitigation measures for such assets (Jayaratne et al., 2015). Tsunami warning systems such as the Deep-ocean Assessment of Reporting Tsunamis (DART) (Hayashi and Schirling, 2015) are reactive models that warn people of an incoming tsunami. In contrast, the risk metric proposed in this work is based on a proactive risk management philosophy. These systems can work together to reduce the potential damage and havoc created by an unexpected event. We apply this risk rating system to an existing living-quarters platform, which is modeled in finite element software. We modeled the structure in its intact as-designed condition. Due to the similarity of the many aging fixed-jacket platforms in Malaysian waters, we anticipate that the proposed risk matrix may be applied to other jackets with similar air gaps and water depths.
2 Background theory 2.1 EarthquakesSince the 1950s, a considerable amount of research has been conducted with respect to the relationship between the fault parameters and moment magnitudes of earthquakes. Papazachos et al. (2004) stated that the relationship between fault parameters such as fault length, fault area, and fault slip and the magnitude of a corresponding earthquake is important in:
1) the estimation of the magnitude of an earthquake when such parameters are available; and
2) the verification of the validity of models of the mechanics of seismic rupture.
With an estimation of the magnitude of an earthquake, a tsunami simulation can be performed via the numerical model TUNA-M2. It is of primary importance that the parameters of the earthquake be determined with acceptable accuracy.
In this study, we based our simulation on the earthquake parameters identified by Wu (2012). In his paper, the author examined many historical tsunamis, including 18 trench-type and four fault-type tsunami sources. For all of these tsunami sources, the construction of the earthquake was scrutinized, including the subsurface rupture length and width, the scale of the seismic moment, and the slip and the dip angles. From Wu (2012), we extracted the earthquake parameters of the Manila Trench, and adjusted them for the purposes of this study.
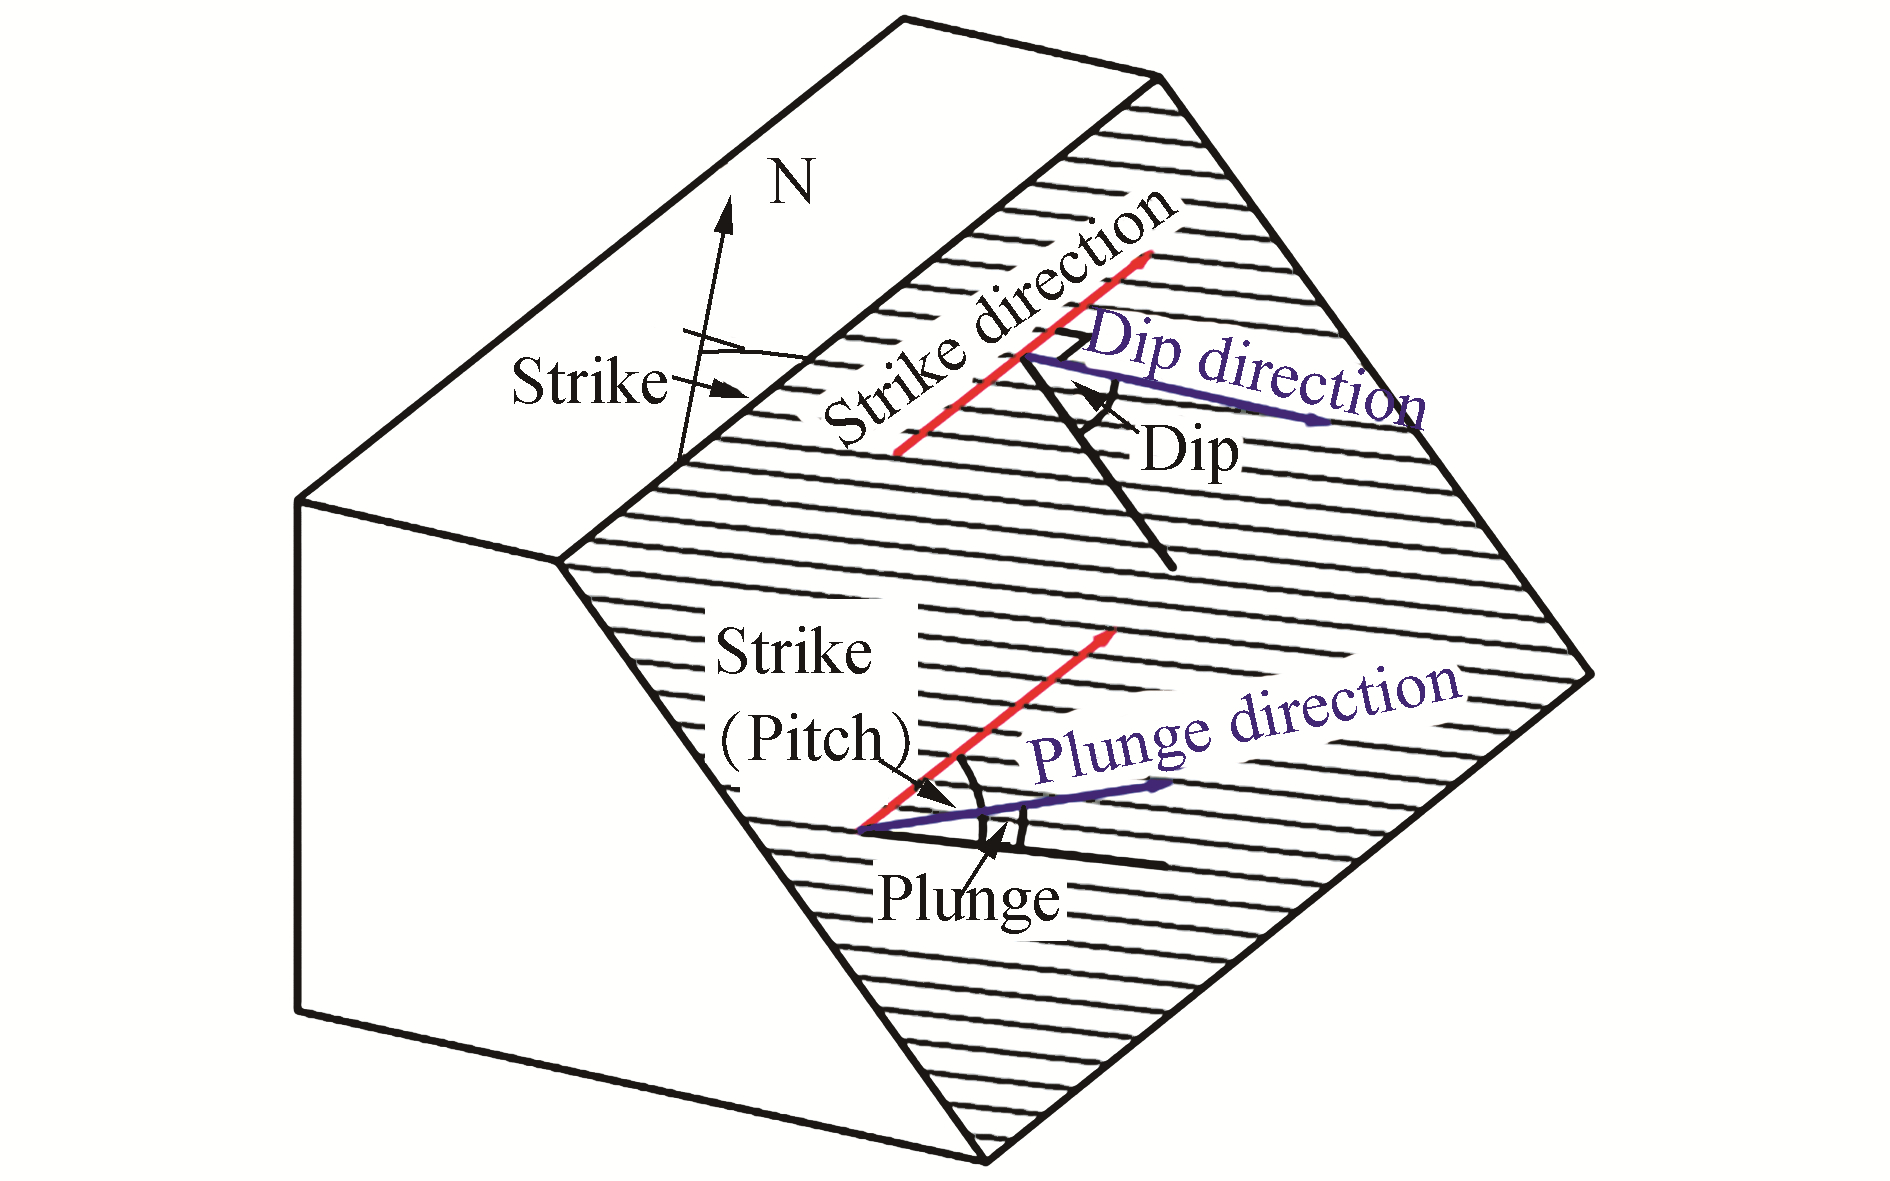
The earthquake source parameters employed in this study include dip angles, rake angles, strike angles, and focal depth. The dip angle, a permanent fault characteristic, is the angle between the fault and a horizontal plane. The rake angle refers to the moving direction of a hanging block during rupture, as measured on the plane of the fault. Strike angles refers to the direction of a line created by the intersection of a fault plane and a horizontal surface, relative to true north. The basic parameters are illustrated in Fig. 2.
|
| Figure 2 Earthquake parameters |
We simulated tsunami wave propagation using TUNA-M2 software—an in-house software designed by H. L. Koh and S.Y. Teh from the Universiti Sains Malaysia following the December 26, 2004 tsunami. TUNA-M2 is one part of a three-part module of the TUNA software package, which simulates the propagation of tsunami waves. According to Koh et al. (2009), when using TUNA, the propagation of tsunamis is governed by depth-averaged 2-dimensional Shallow-Water Equations (SWE), as expressed in Eqs. (1) through (5):
| $\frac{{\partial \eta }}{{\partial t}}{\text{ + }}\frac{{\partial M}}{{\partial x}}{\text{ + }}\frac{{\partial N}}{{\partial y}}{\text{ = }}0$ | (1) |
| $\frac{{\partial M}}{{\partial t}} + \frac{\partial }{{\partial x}}\left( {\frac{{{M^2}}}{D}} \right) + \frac{\partial }{{\partial x}}\left( {\frac{{MN}}{D}} \right) + gD\frac{{\partial \eta }}{{\partial x}} + \frac{{g{n^2}}}{{{D^{\frac{7}{3}}}}}M\sqrt {{M^2} + {N^2}} = 0$ | (2) |
| $\frac{{\partial N}}{{\partial t}} + \frac{\partial }{{\partial x}}\left( {\frac{{MN}}{D}} \right) + \frac{\partial }{{\partial y}}\left( {\frac{{{N^2}}}{D}} \right) + gD\frac{{\partial \eta }}{{\partial y}} + \frac{{g{n^2}}}{{{D^{\frac{7}{3}}}}}N\sqrt {{M^2} + {N^2}} = 0$ | (3) |
In the Eqs. (1) through (3), the parameters M and N in the 2-dimensional x-and y-directions relate to the velocities u and v by the expressions detailed in Eqs. (4) and (5), respectively:
| $M = u\left( {h + \eta } \right) = uD$ | (4) |
| $N = v\left( {h + \eta } \right) = vD$ | (5) |
where h is the sea depth, η is the water elevation above mean sea level, and D is the instantaneous depth (Koh et al., 2009). The equations are cast in flux form, which essentially describes the depth-averaged conservation of mass and momentum (Cham et al., 2006).
We utilized the finite difference numerical scheme to discretize the fundamental partial differential equations, as approximated over a staggered grid system as illustrated in Fig. 3. To ensure numerical stability, we imposed the Courant–Friedrichs–Lewy (CFL) criterion on the time step, shown in Eq. (6) (Cham et al., 2006):
| $\Delta t \le \frac{{\Delta x}}{{\sqrt {2gh} }}$ | (6) |

|
| Figure 3 Staggered scheme for finite difference |
The finite difference equations formulated to discretize the partial derivatives are as written in Eqs. (7) through (11).
| $\eta _{i,j}^{k + 1} = \eta _{i,j}^k-\frac{{\Delta t}}{{\Delta x}}\left( {M_{i + 0.5,j}^{k + 0.5}-M_{i-0.5,j}^{k + 0.5}} \right)-\frac{{\Delta t}}{{\Delta y}}\left( {N_{i,j + 0.5}^{k + 0.5}-N_{i,j-0.5}^{k + 0.5}} \right)$ | (7) |
| $M_{i + 0.5,j}^{k + 0.5} = M_{i + 0.5,j}^{k-0.5}-gD_{i + 0.5,j}^k\frac{{\Delta t}}{{\Delta x}}\left( {\eta _{i + 1,j}^k-\eta _{i,j}^k} \right)$ | (8) |
| $D_{i + 0.5,j}^k = {h_{i + 0.5,j}} + 0.5\left( {\eta _{i + 1,j}^k-\eta _{i,j}^k} \right)$ | (9) |
| $N_{i,j + 0.5}^{k + 0.5} = N_{i,j + 0.5}^{k-0.5} + gD_{i,j + 0.5}^k\frac{{\Delta t}}{{\Delta y}}\left( {\eta _{i,j + 1}^k-\eta _{i,j}^k} \right)$ | (10) |
| $D_{i,j + 0.5}^k = {h_{i,j + 0.5}}0.5\left( {\eta _{i,j + 1}^k-\eta _{i,j}^k} \right)$ | (11) |
Koh et al. (2009) also simulated the Andaman 2004 tsunami to study its impact on Malaysian waters, with an emphasis on the East Peninsular Coast. In-depth comparisons were made between the results produced by TUNA and those from the more established tsunami simulation software COMCOT, which was developed by Professor Liu at Cornell University, United States. TUNA-M2 and COMCOT were shown to have good correlation in terms of a wave height time series and wave height contours. Koh et al. (2009) also studied wave impact on Penang and Langkawi. In a follow up, Koh et al. (2009) studied the Andaman tsunami's general impact on the Straits of Malacca, and proved that the TUNA software package performs with a level of accuracy and consistency comparable with the more established models such as COMCOT.
2.3 Simulation using TUNA-M2
For this study, we narrowed our scope to address the pressing need for the simulation of tsunami waves generated by an undersea earthquake in the Manila Trench. This need was highlighted by Megawati et al. (2009), who pointed out that the Manila Trench has been quiet for almost 440 years, indicative of strain accumulation.. Wu and Hui (2009) also noted a critical point made by the USGS at the 2006 Tsunami Sources Workshop that categorized the Manila Trench as being a risky tsunami source zone. Liu et al. (2009) stated that the Manila subduction zone has not experienced seismicity larger than 7.6 Mw in the past 100 years which statistically indicates high probability of occurences for larger earthquakes.
According to a simulation by Teh and Koh (2011), tsunami waves originating from the Manila Trench and affecting the shores of Sabah, North Borneo, are reduced by the presence of the Palawan Islands. In principle, these islands deflect the tsunami waves considerably, forcing them to run parallel to the coast of Sabah, as shown in Fig. 4. At the same time, we emphasize that this deflection does not discount the effect that such waves would have on offshore installations and facilities of the oil and gas industry. A large number of aging platforms are located offshore of Sabah, directly in the path of Manila-Trench-generated tsunamis.

|
| Figure 4 Tsunami propagation from the Manila Trench (Teh et al., 2011) |
Using the Advanced National Seismic System (ANSS), Anat and Nopporn (2009) analyzed collected data of earthquakes from 1963 to 2006, with fault parameters partly based on work by Papazachos et al. (2004). Using the TUNAMI simulation model, the authors simulated the December 26, 2004 tsunami, as well as a hypothetical tsunami originating from the Manila Trench. The results show that if a tsunami were to originate from the Manila Trench, the minimum time for the tsunami to reach Thailand was about 13.5 h, and the maximum wave height reaching Thailand from a tsunami from the Manila Trench was 0.42m. Thailand is shielded from much of the devastating effects of waves emanating from this direction. A major portion of Malaysia's West Peninsular and offshore facilities of Sabah and Sarawak, however, will likely suffer significantly higher wave energies.
Wu and Hui (2009) also performed simulations of tsunamis from seaquakes in the Manila Trench, but with the point of observation being in Taiwan. In their studies, the fault planes along the Manila Trench were based on the three largest historical tsunami-generating earthquakes. These include the 9.5MwChile earthquake in 1960, the 9.2Mw earthquake in Alaska in 1964, and the earthquake that created the 2004 Sumatra tsunami. The analyses of these earthquakes revealed that they possessed similar fault lengths varying from 740 to 1300 km, and similar rupture widths varying from 200 to 300 km. To obtain the Manila Trench earthquake parameters, we utilized the global Centroid Moment Tensor (CMT) seismic database, fault parameters issued by the USGS, and hindcasts from the aforementioned three largest historical tsunami-generating earthquakes. Based on the results, we estimated the time of arrival for the first wave to hit Taiwan as 20 minutes, with the peak of the first wave occurring at the 23rd minute, with a 5m wave height. The maximum wave height was simulated at the 40th minute, with a height of 11 m. We note that results from a joint inversion technique employed in a finite fault model to determine the seismic source parameters in a study to approximate the Mentawai tsunami earthquake are in agreement with those from the CMT (Zhang et al., 2015).
Liu et al. (2009) also studied the hazards of a tsunami in the South China Sea, but the scope of magnitude of the earthquake was fixed at 8.0. The source parameters used in Liu et al.'s paper incorporated the fault parameters suggested by Kirby et al. (2006) together with the rupture width estimated using the Wells and Coppersmith's relationship. Their results showed that a tsunami will reach southern Taiwan region within 20 minutes, Vietnam in 2 h, and Malaysian waters in approximately 3 h.
From the aforementioned studies, we can conclude that a tsunami from the Manila Trench will, to varying extents, affect all the countries surrounding Philippines, which is a stark reminder of the crucial need to thoroughly study this hazard. In this study, we address the existing gaps in the detailed sensitivity analyses of seaquakes of various magnitudes from the Manilla Trench, the resulting tsunami waves, and their impact on fixed-jacket installations in the South China Sea.
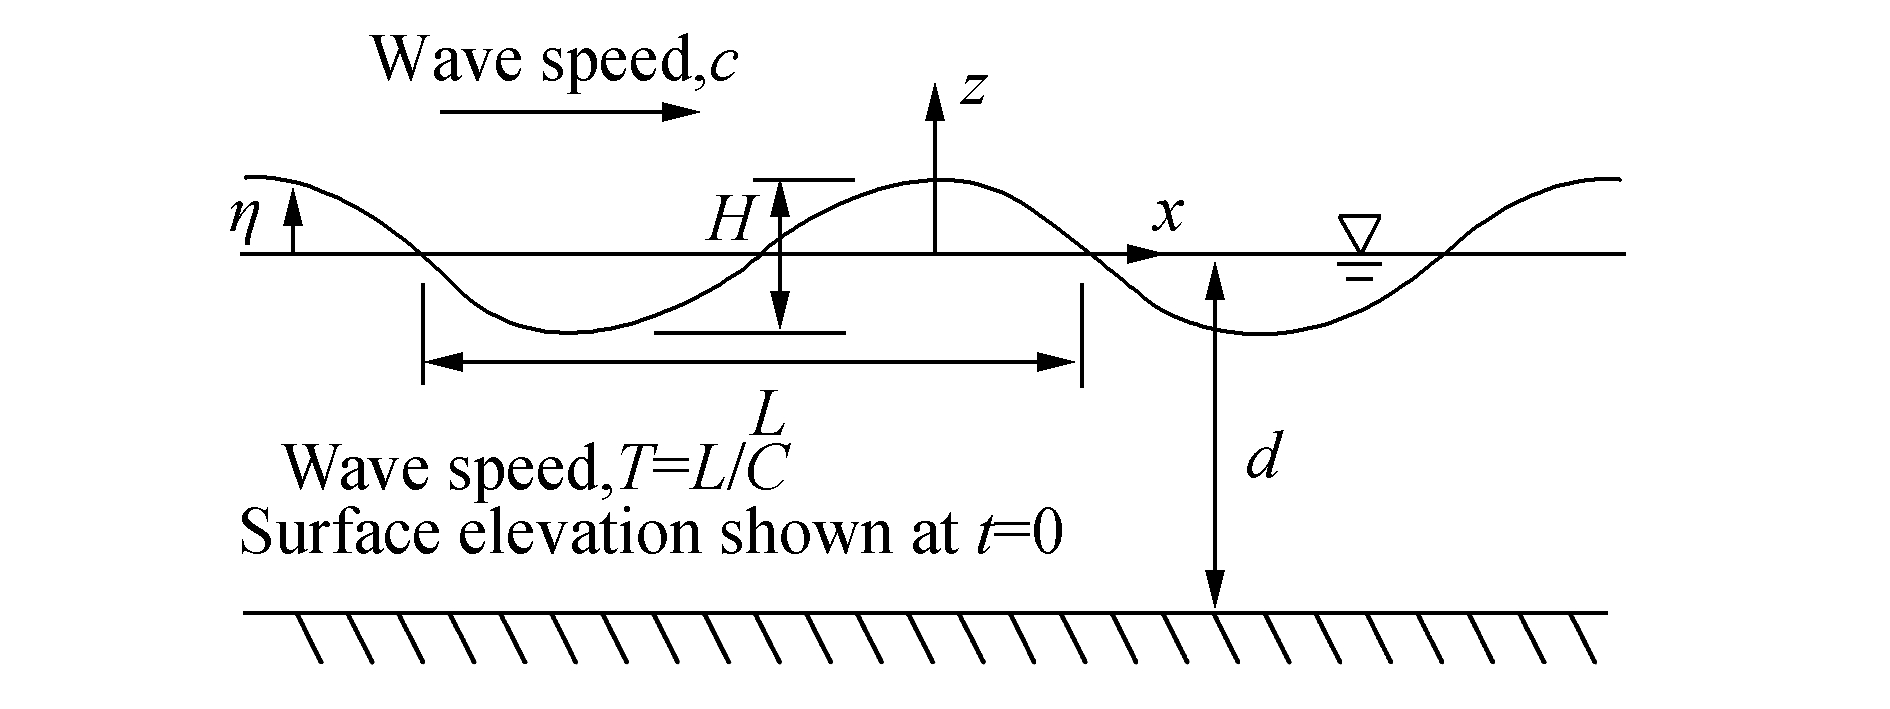
2.4 Simulation using SACS v5.3The 3-D structural finite element software SACS v5.3 generates environmental waves, wind, and current loading via its Seastate module. The static analysis program SACS IV utilizes the output of Seastate to compute the full Finite Element Model (FEM). The static analysis assumption is justified by the long-wave lengths of tsunami waves wherein the associated wave periods are many orders of magnitude greater than the fundamental mode of frequency of a typical fixed steel offshore structure, which is approximately in the 2–4 seconds range. Hence, the dynamic amplification effects due to sea waves or swells whose periods are in the typical range of 3–20 seconds are negligible when dealing with very long tsunami waves. The SACS model we developed can capture the effects of topside green water, that is, when the tsunami wave exceeds the air gap and inundates the decks. Nonetheless, we note that for this platform, the tsunami wave does not inundate the deck as its air gap was sufficiently engineered to remain well above waves associated with even 100-year storms. The Seastate module has the capability to generate wave velocity and acceleration fields based on Airy, Stokes'fifth order, stream function, cnoidal, and solitary wave theories. These wave theories are approximations of the solutions of the equations governing free-surface fluid motion and each provides reasonable results over unique ranges of wave period, amplitude, and water depth. Loads are generated on the structure at predefined wave steps, by which the wave propagates from its defined crest origin. The governing critical wave positions can be specified as those that produce the maximum values of the overturning moment, base shear, or vertical force on the structure. Fig. 5 illustrates Seastate's definition of the wave theories'basic parameters.
|
| Figure 5 Definitions of basic wave parameters in SACS |
The wave theories embedded in SACS Seastate assume that the fluid is continuous, inviscid, irrotational, and incompressible and can be described by potential flow physics. The governing equations of motion for an ideal fluid are described in the following paragraphs.
The fluid velocity field must satisfy the continuity condition, in the sense that the total fluid mass remains constant:
| $\nabla \cdot {\mathbf{V}} = 0$ | (12) |
where
| $\frac{{\partial {U_x}}}{{\partial x}} + \frac{{\partial {U_y}}}{{\partial y}} + \frac{{\partial {U_z}}}{{\partial z}} = 0$ | (13) |
where
| ${\mathbf{V}} = {U_x}{\mathbf{i}} + {U_y}{\mathbf{j}} + {U_z}{\mathbf{k}}$ | (14) |
we can show that an ideal fluid flow can be approximated by the use of the potential theory, wherein the velocity potential is described as a gradient of a scalar function known as the velocity potential, ϕ :
| ${\mathbf{V}} = \nabla \phi $ | (15) |
By combining the continuity condition and the velocity potential, it is a straightforward matter to obtain the Laplace's equation:
| ${\nabla ^2}\phi = 0$ | (16) |
The remaining governing equations for ideal potential flow would include the continuity principle, free-surface condition, and the governing boundary conditions for a plane wave written in Eqs. (15) through (20). The non-linearity of the governing equations, in addition to the fact that they are defined on the exact free surface, which is itself unknown, has spawned several approximate solutions, the more notable of which exist as the various wave theories embedded in the SACS Seastate algorithm.
| $\frac{{\partial \phi }}{{\partial z}} = 0\begin{array}{*{20}{c}} {}&{{\text{at}}} \end{array}\begin{array}{*{20}{c}} {}&{} \end{array}Z = -d$ | (17) |
| $\frac{{\partial \eta }}{{\partial t}} + \frac{{\partial \phi }}{{\partial x}}\frac{{\partial \eta }}{{\partial x}}-\frac{{\partial \Phi }}{{\partial z}} = 0\begin{array}{*{20}{c}} {}&{{\text{at}}} \end{array}\begin{array}{*{20}{c}} {}&{} \end{array}Z = \eta $ | (18) |
| $\frac{{\partial \eta }}{{\partial t}} + \frac{1}{2}\left[ {{{\left( {\frac{{\partial \phi }}{{\partial x}}} \right)}^2} + {{\left( {\frac{{\partial \Phi }}{{\partial z}}} \right)}^2}} \right] + {g_n} = 0$ | (19) |
| $\phi \left( {x{\text{, }}y{\text{, }}z} \right) = \phi \left( {x-ct{\text{, }}z} \right)$ | (20) |
The solitary wave is, in essence, a limiting case of the cnoidal wave theory, as the wave length approaches infinity. Solitary waves are frequently employed to model waves whose wavelength is significantly greater than the water depth through which they are propagating. Tides, seiches, and tsunamis are examples of such waves. The solitary wave theory employed in SACS Seastate can be reviewed in more depth by referring to the paper by Fenton (1979). In this study, we assume that the tsunami wave does not break in 63-m water depth, which is consistent with many accounts of tsunami breaking (Levin, 2008).
The solitary wave theory has been used to model tsunamis since the 1970s (Madsen et al., 2008). In Madsen's study, the application of finite amplitude solitary wave theory for a tsunami resulted in measurable errors when using approximate long waves on sloping bottoms and nonlinear geophysical conditions during run-up (Madsen et al., 2008). In this study, we did not investigate run-up along the coasts, as the platform being studied is situated 60 kilometers from the coast of Kota Kinabalu, Sabah in water 63 m deep. Similarly, the bathymetry surrounding the platform is reported to be relatively flat with no abrupt or steep slope of the continental shelf. Hence, in this study, we do not take into account the nonlinearity that would arise from sloping bottoms or consider run-up, which enabled the use of generation-propagation only software such as TUNA-M2. For studies with run-up considerations, full Non-Linear Shallow-Water Equations (NSWEs) are embodied into the TUNA-RP—the run-up simulator of the TUNA software suite—which has the capability to account for bathymetric effects. An alternative to the use of NSWEs in run-up modeling is the use of the Green–Naghdi theory, wherein the time history effects of bathymetry are effectively captured, and which has shown good correlation with experimental results (Duan and Zhao, 2013). We emphasize herein that future studies utilizing high-powered computer centers can pave the way to predicting more physically realistic events. With the advent of Big Data, predictions will mirror actual geophysical phenomenon by the utilization of real-world geo-spatial and bathymetric information.
3 Research methodologyThe general methodology used in this research is shown in Fig. 6. First, we performed an intensive review to obtain earthquake parameters from notable research results. These earthquake parameters include longitude, latitude, length, and dip, rake, and strike angles, which were input into TUNA-M2 to simulate tsunami generation and propagation. We used the FEM software SACS to model the effects of the tsunami on a real-world fixed-jacket platform operated by a local Malaysian oil company. We considered various earthquake moment magnitudes in this study.

|
| Figure 6 Generic research methodology |
We obtained the rupture length and width and dip and rake angles from past studies by Wu (2012). These values are summarized in Tables 1 and 2. Given length L and width W of the subsurface rupture, along with μ, which is the rigidity of the earth's mantle, given as 3×10¹¹dyn/cm2, the Mo parameter can be computed as in Eq. (22). The earthquake's moment magnitude Mw can then be calculated using Eq. (21), as follows:
| ${M_W} = \frac{2}{3}\lg {M_o}-10.7$ | (21) |
The Mo formula is given in Eq. (22), where D is the slip amount:
| ${M_o} = \mu DLW$ | (22) |
Table 1 lists the earthquake parameters from Wu (2012), along with elaborations regarding the assumptions and rationales of the parameters used. Table 2 shows the four faults that were used in the tsunami simulation, with the exact values of their respective seismic fault parameters. We note that the longitude and latitude data refer to the position of the fault epicenters.
| Earthquake Parameters | Elaboration |
| Rupture length, L | Value ofL is assumed based on many studies on the topography and geological conditions of the trench. |
| Rupture width, W | Value ofW is obtained by referring to past large-scale earthquakes and their widths. |
| Slip of the fault, D | Value ofD is obtained by computing the seismic momentMo which is then scaled with the seismic scaling law. |
| Dip angle | Value of the dip angle is applied at 20°to study worst-case scenarios. |
| Rake angle | Value of rake angle is set at 90°, as large-scaled trench-type earthquakes and worst-case scenarios are being studied. |
| Fault | Length/km | Width/km | Approximate Longitude/(°) | Approximate Latitude/(°) |
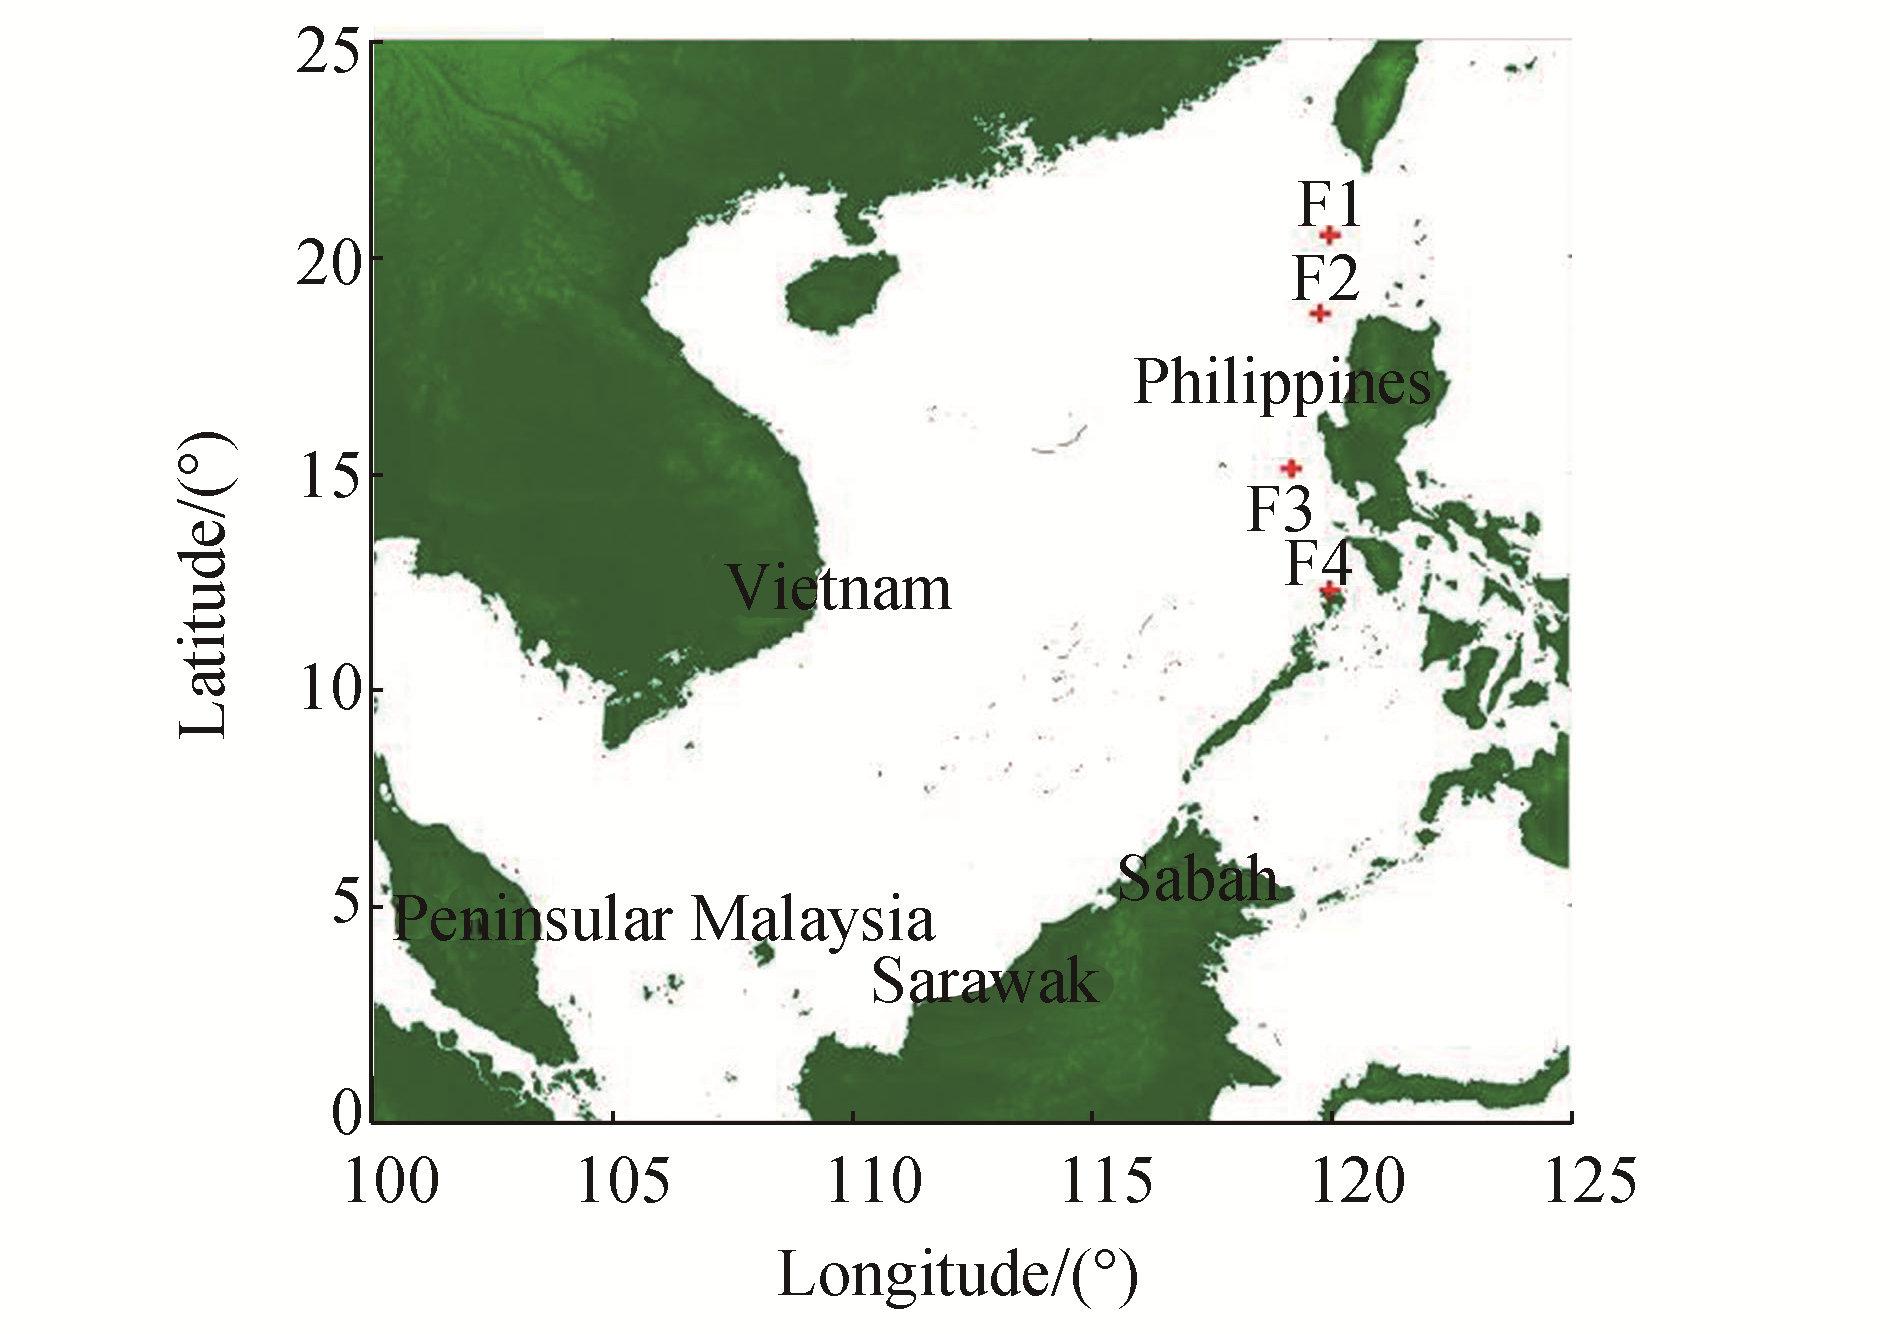
| 1 | 169.96 | 50 | 120.0 | 20.5 |
| 2 | 236.53 | 50 | 119.8 | 18.7 |
| 3 | 478.16 | 50 | 119.2 | 15.1 |
| 4 | 127.08 | 50 | 120.0 | 12.3 |
In this study, we used SACS v5.3 software to model a living-quarters platform, referred to as Platform A, which is located in the vicinity of the shores of Sabah. This platform is a typical four-legged platform constructed about 60-km offshore from Kota Kinabalu in water depth of 63.1 m. This platform has two plan levels, a cellar deck, and a main deck. This configuration is very common in many four-legged jacket structures in Malaysian waters.
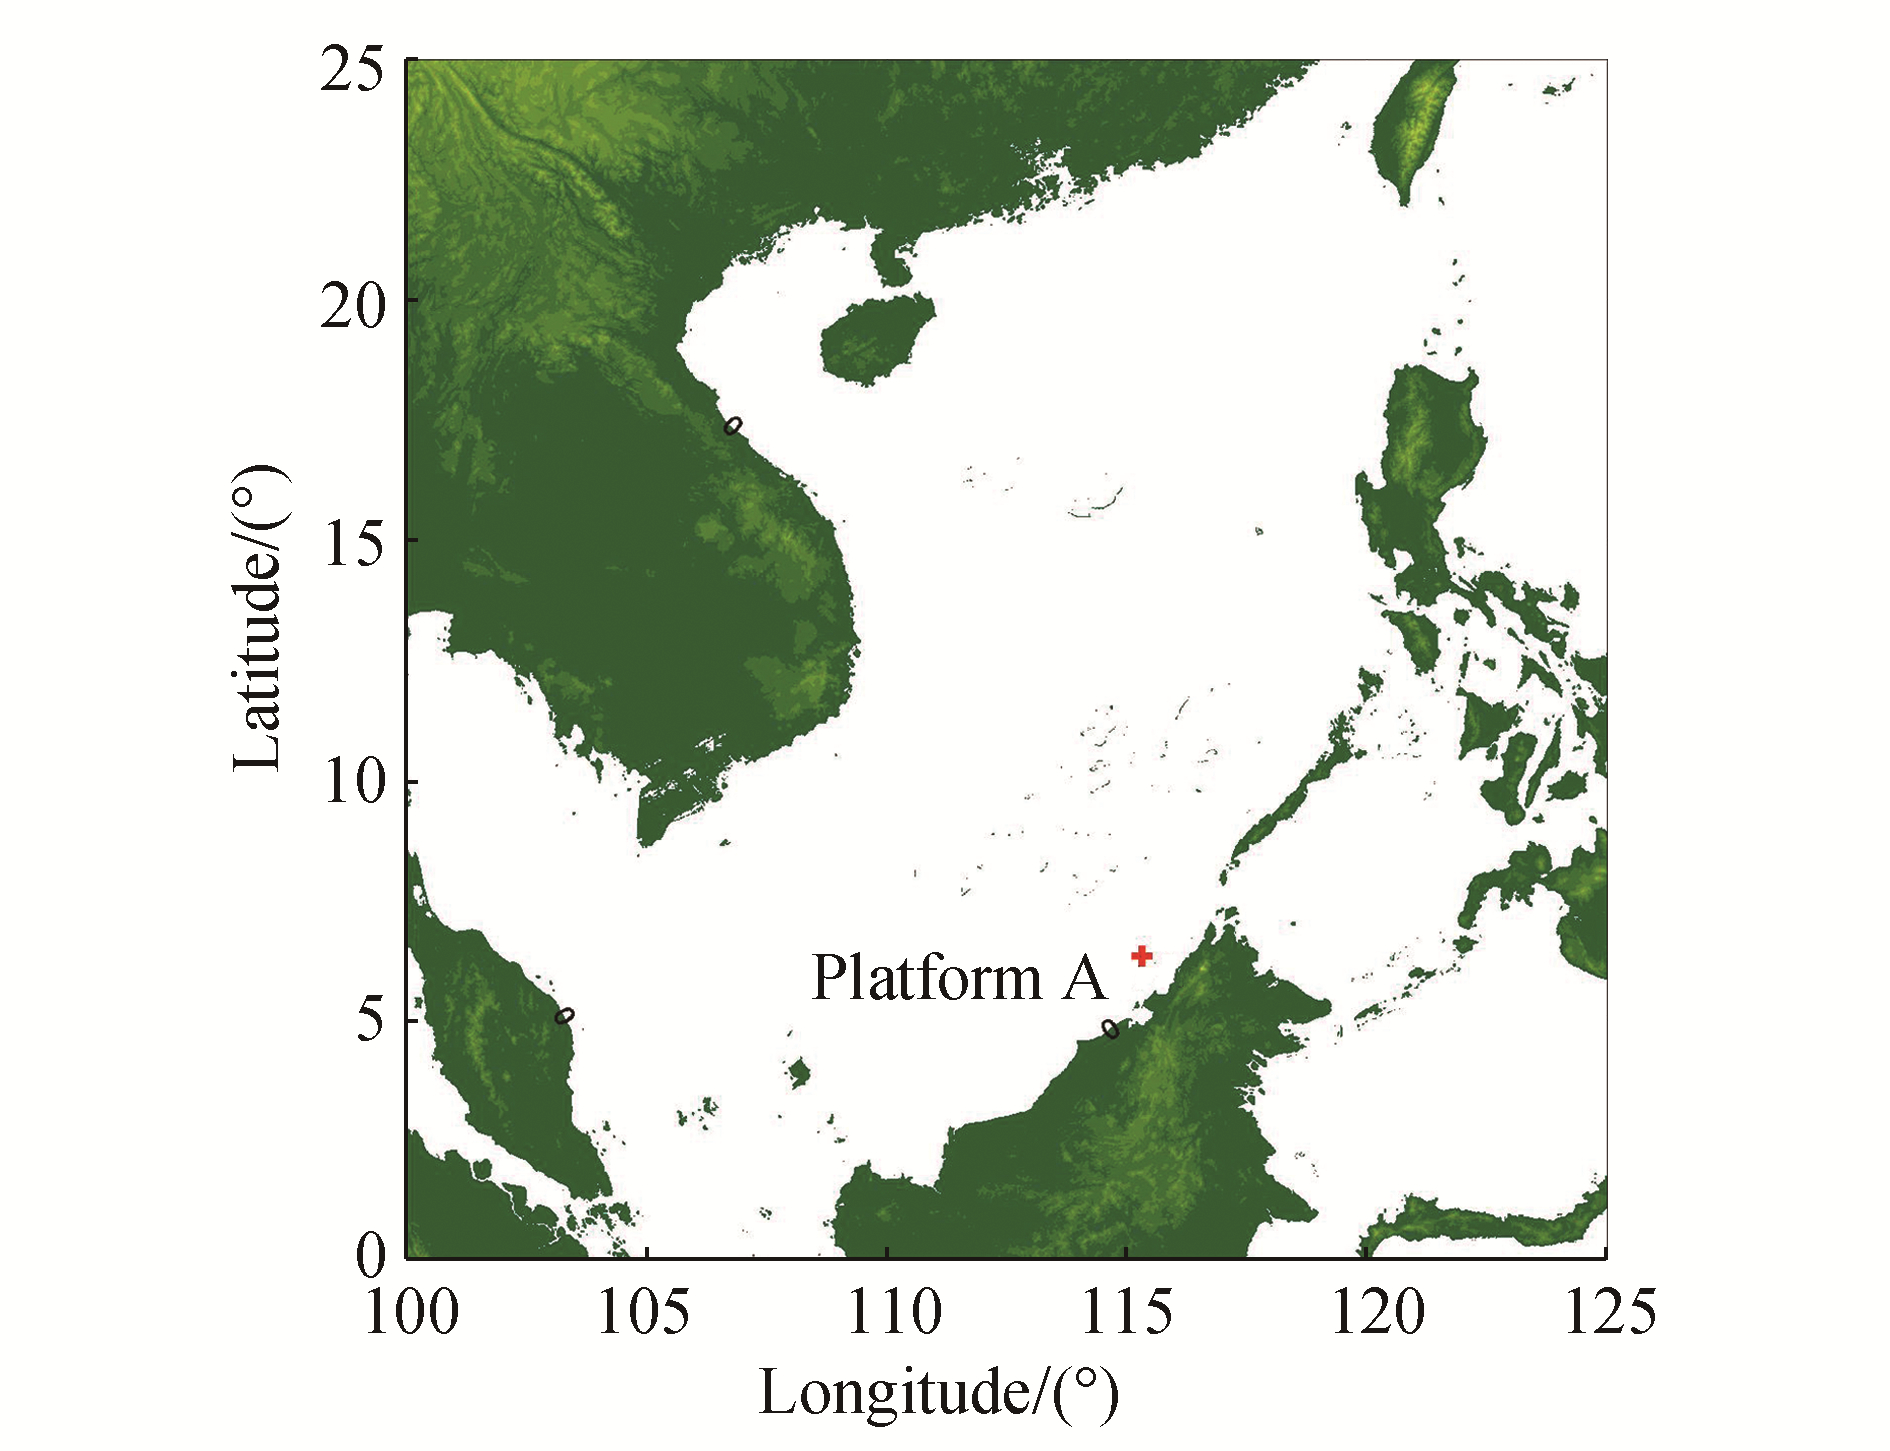
The diagram in Fig. 7 shows the point of observation in North Borneo waters and Fig. 8 illustrates the four epicenters of the earthquake faults used in this research. We obtained the coordinates of these four faults from Wu's (2012) paper. The structural point of observation's description and details are summarized in Table 3.
|
| Figure 7 Point of observation-Platform A |
|
| Figure 8 Seaquake epicenters (F1 to F4) employed in this study |
| Structure name | Platform A |
| Structure function | Quarters platform |
| Installation date | March 1984 |
| Water depth (MSL) | 63.148 m (207.18 ft) |
| No. of piles | 4 |
| Pile Penetration below mudline/m | 86.5 |
| Number of conductor | 0 |
| Number of Anode | 60 |
| Number of boat landing | 1 |
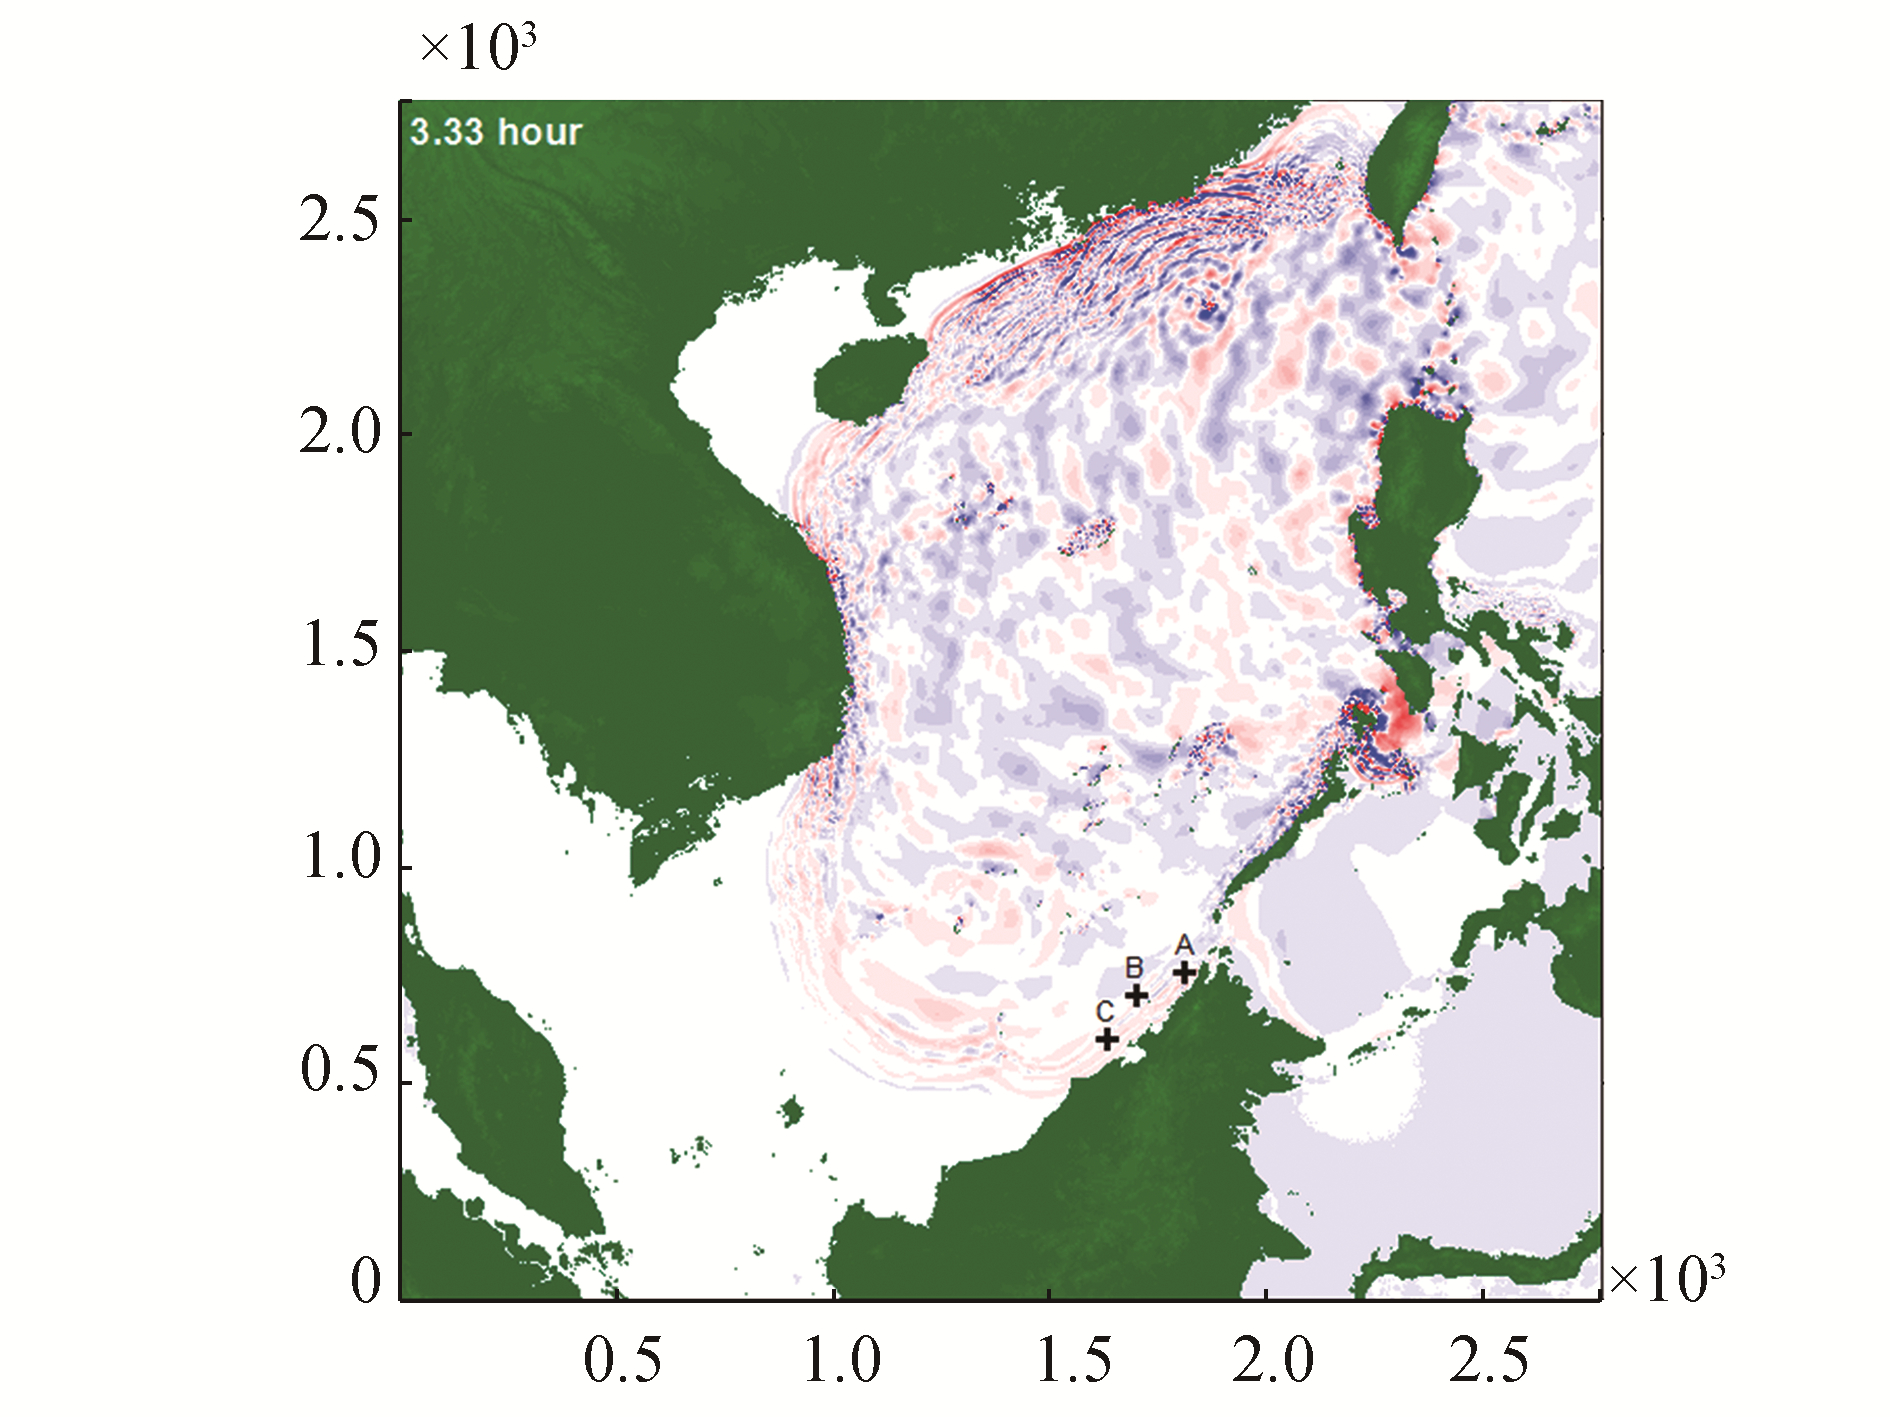
Utilizing the earthquake parameters as input, we performed a series of tsunami simulations using TUNA-M2. We used this model on the TUNA-M2 software only to simulate the generation and propagation of the tsunami and the wave's time of arrival at the designated grid point. With the point of observation being Platform A, we can study the time of arrival, the corresponding wave height, and the period after the first wave. Lastly, with outputs from the wave simulation, we can simulate the tsunami–structure and utilize its results to rank the platform with respect to the proposed risk matrix. Fig. 9 shows the simulation of the tsunami propagation in the numerical model at t=3.33 h.
|
| Figure 9 Simulation of tsunami from Manila Trench at time t=3.33 h |
|
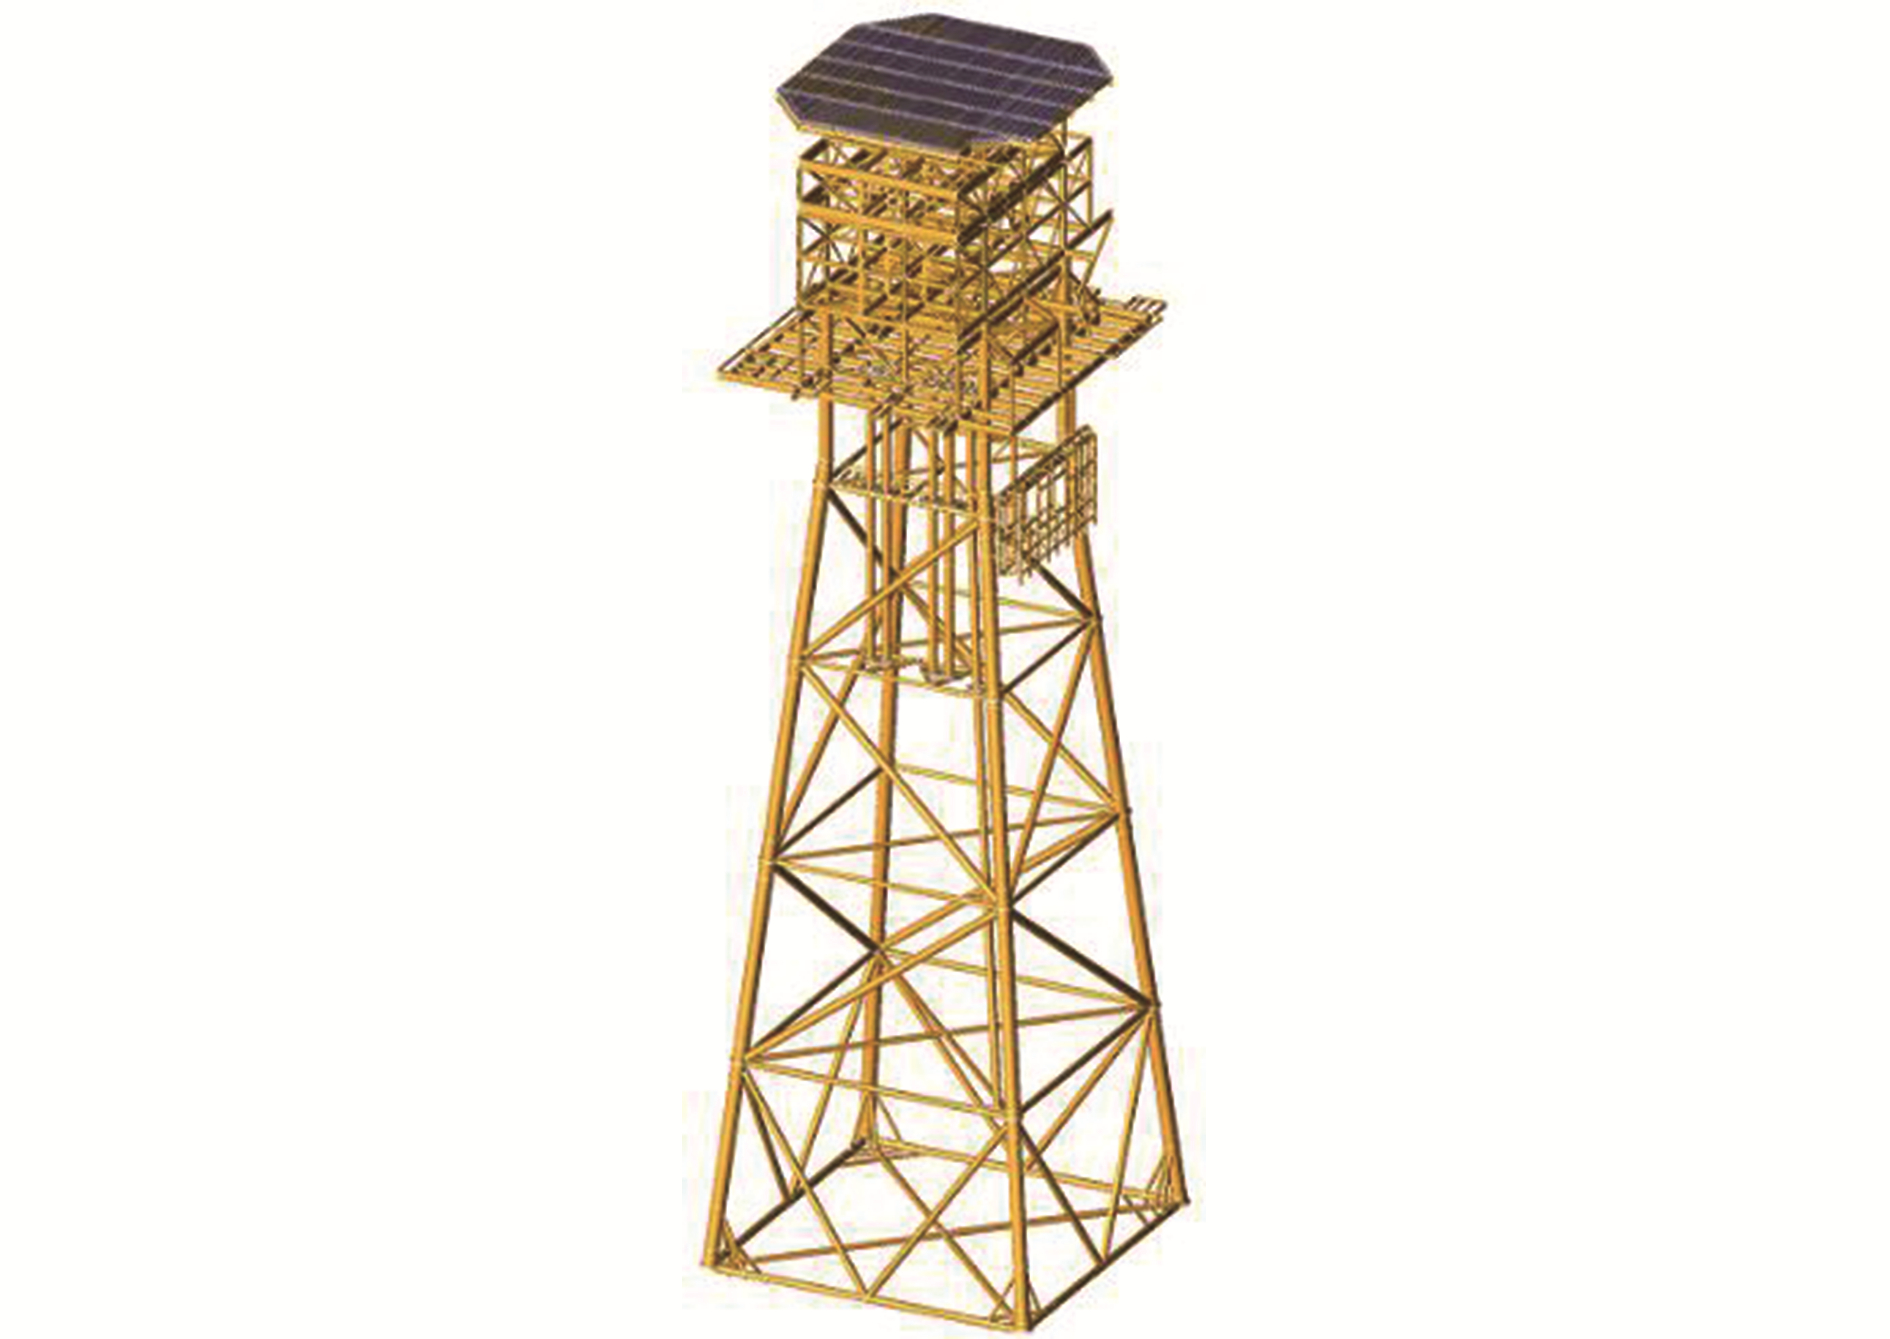
| Figure 10 Finite element model of platform A |
We performed all structural analyses of the offshore platform using Bentley's SACS v5.3 executive software suite. SACS is a software that combines practical design tools, including the modeling, analysis, design, and installation load simulation of offshore structures. Offshore structures, in this case, include stand-alone topsides, wind farm structures, and oil and gas platforms. This software can execute complex analyses while also complying with international offshore design codes and checks.
SACS v5.3 can carry out many static analyses that can be used to simulate loadings on offshore structures. In this study, we employed the linear static and non-linear pushover analysis approach, considering the linear elastic and plastic behaviors of both the structural materials and the geometry, as well as the nonlinear environmental load generation by the SACS Seastate module. The computer model of Platform A is as showcased in Fig. 10.
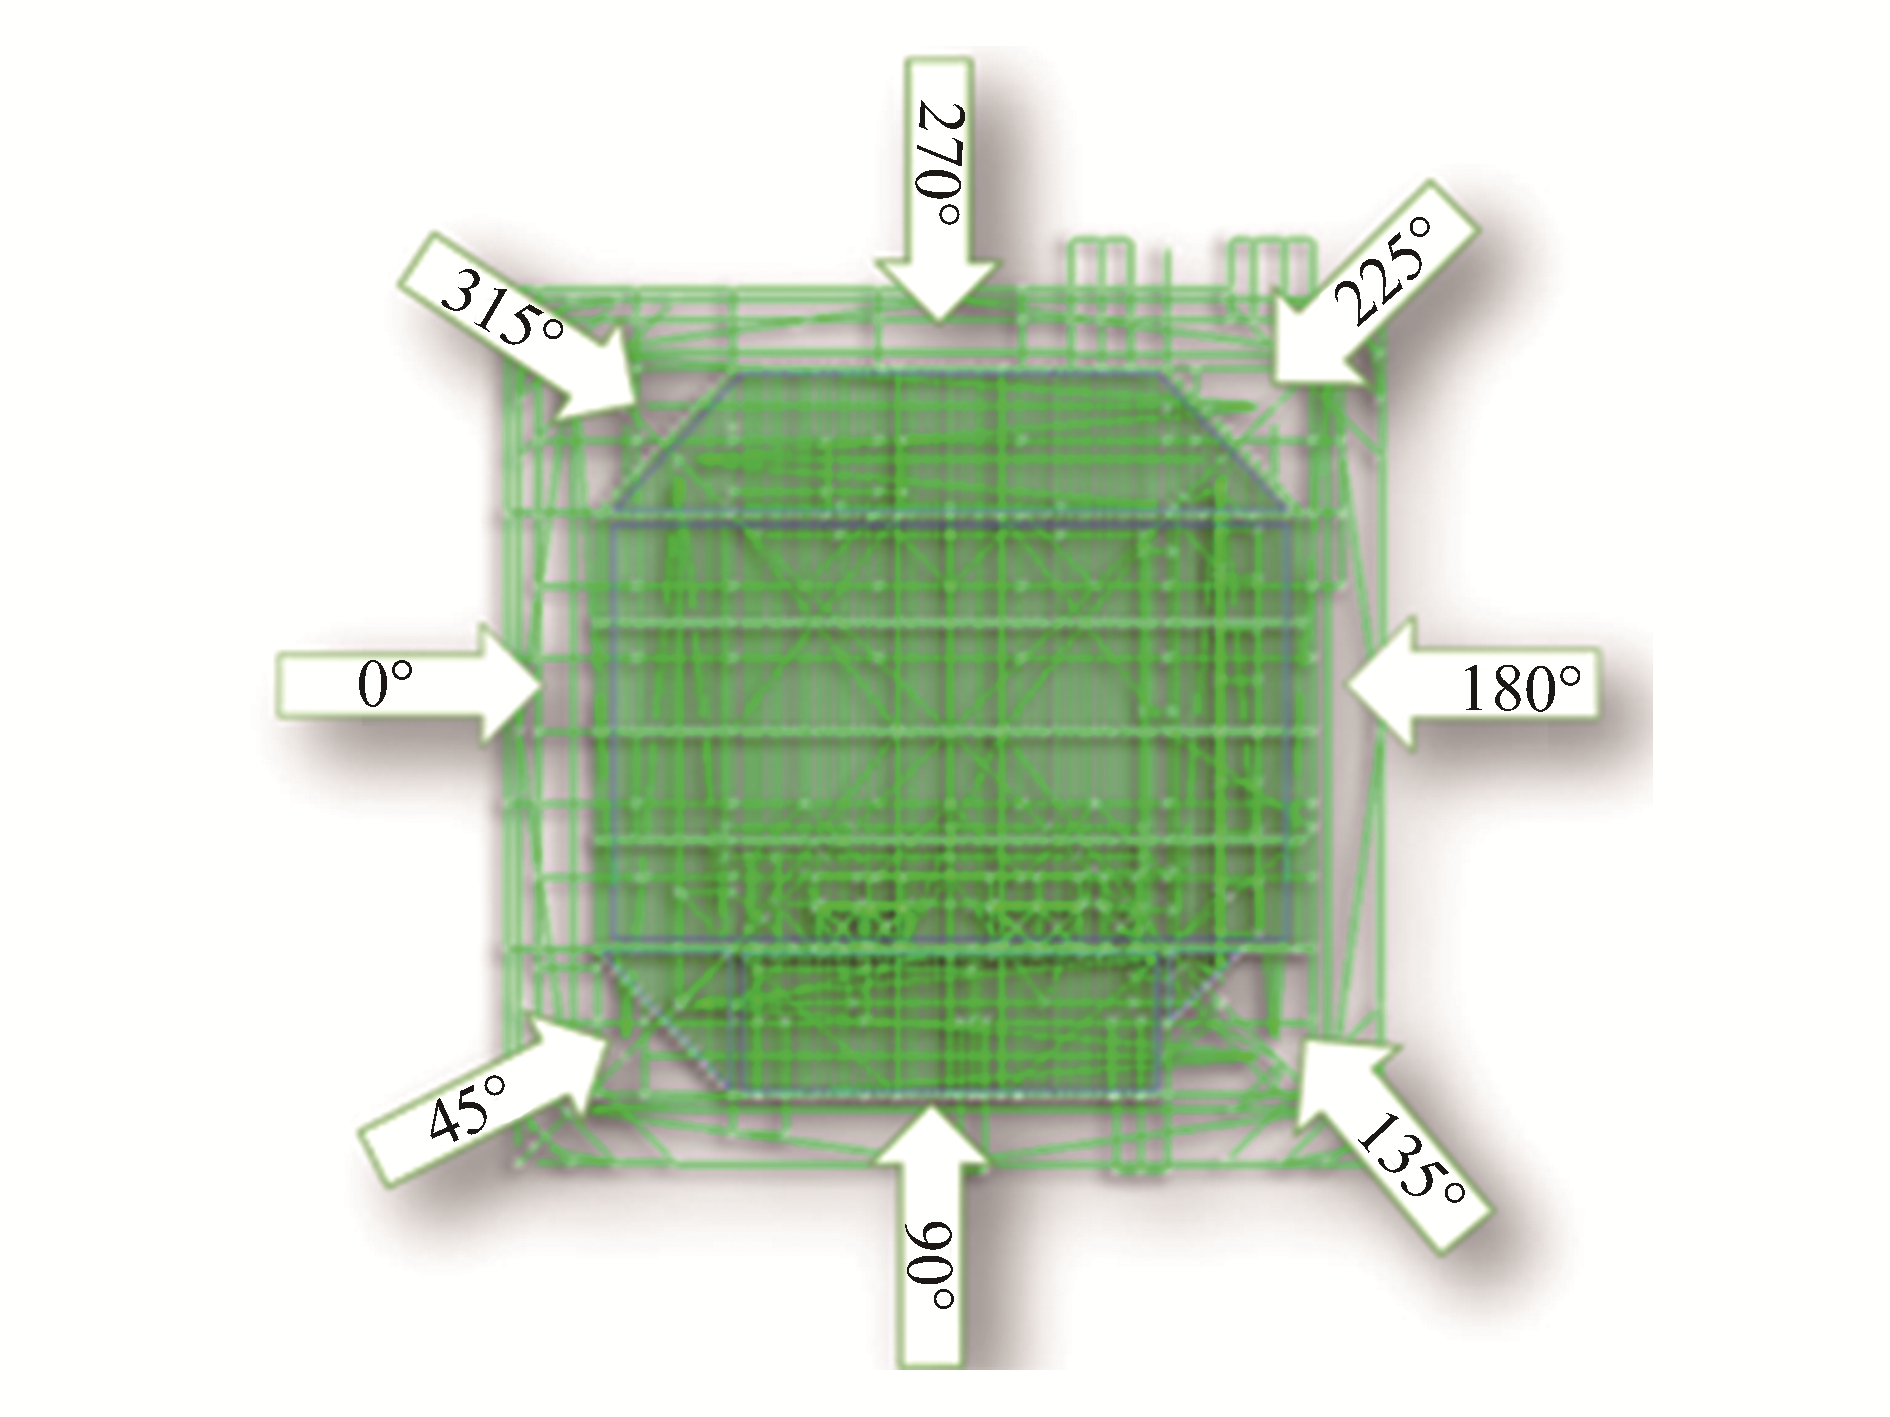
We performed linear static analysis based on the results of the tsunami wave simulation at the specified grid point, and applied the analysis in eight load combinations from eight directions, 45°apart. From the Postvue Database Directory—a SACS interactive graphical post-processor—we retrieved all the respective displacements and forces. With this output, we determined the maximum joint displacement and maximum lateral forces, and made a maximum unity check of the whole structure.
In SACS 5.3, non-linear pushover analysis is performed via the collapse module. The non-linear analysis is performed by specifying the total amount of iterations of a specified loading onto the structure, prior to the failure of any member. The SACS 5.3 collapse analysis includes the investigation of large deflection, plasticity, and joint failure, and takes into consideration the non-linear material and geometric behaviors of the ultimate limit conditions of the structure. In addition to shear deformation, we also considered the plasticity associated with the axial and bending stresses.
Next, we evaluated the offshore platform's integrity by assimilating the tsunami simulation results with the operating weight of the offshore platform. In the study of tsunami waves, we assumed that these waves will hit the offshore platform unexpectedly during its normal operating conditions, for which a fair gauge of the platform's structural integrity can be made based on a multi-directional sensitivity analysis.
These static analyses are appropriate due to the length of tsunami waves. Unlike wind waves, the natural period of a seismic sea wave is generally a few orders of magnitude greater than that of the natural period of a fixed-jacket platform. Hence, it can be treated as a static load with respect to the dynamic amplification factor, since the matching natural modes would approach unity.
We performed the static analysis using the output from the preceding tsunami wave simulation, and applied eight load combinations from eight directions, 45° apart, as shown in Fig. 11. The SACS Postvue Database Directory allows all the respective displacements and forces to be retrieved. With this output, we can determine the maximum joint displacement and maximum lateral forces, and make a maximum unity check of the global structure.
|
| Figure 11 Eight loading directions |
We then extracted the results obtained from the SACS v5.3 structural analysis, and utilized them to design a simplistic risk matrix for the platform to aid in making quick preliminary re-evaluations and risk categorizations of the platform's integrity following the tsunami event. The jacket substructure is assumed to control the integrity of the platform, so we designed the risk matrix with respect to it. We note that this was a platform-specific exercise that can be extended to similarly built structures, since the framework is applicable to any fixed-jacket platform at arbitrary water depths where data for such analyses are available. To ensure a consistent basis for evaluation, we made platform unity checks in this study. To aid failure definition, we identified the critical members as the four main jacket legs. The proposed risk quantification formulation is outlined in Table 4.
| Risk Tier | Description | Unity check |
| Level 1 (L1) | ● The global structure is sound. ● Operations as usual. ● Recommend inspection on anodes and submerged scantlings due to high horizontal water particle velocity. | < 0.5 on all critical members |
| Level 2 (L2) | ● Schedule a visual inspection on structural members. ● Proceed with operations but monitor platform for the next 72 h for abnormal behavior. | > 0.5 & < 0.8 on one (1) one critical member |
| Level 3 (L3) | ● Schedule a visual inspection and nondestructive testing for strain cracks. ● Careful monitoring required, at best with sensors and data acquisition units. ● Proceed with operations but monitor platform for the next 96 h for abnormal behavior. ● Sensitivity reliability analysis to be performed with calibrated finite element model. | > 0.8 & < 1.0 on one (1) critical member only |
| Level 4 (L4) | ● Proceed with operations with caution and reduced load/capacity. Evacuate in heavy environmental conditions. ● Require immediate attention for remedial work/full visual and nondestructive inspection. | > 0.8 & < 1.0 on more than one (1) critical member |
| Level 5 (L5) | ● Stop operation, evacuate all non-essential personnel (maintain key personnel only). ● Relieve the platform deck of removable dead and live loads. ● Inspection/remedial work to restore structural integrity. | > 1.0 on one (1) critical member |
| Level 6 (L6) | ● Very high risk of loss of platform integrity-emergency evacuation and stop operation immediately. | > 1.0 on more than one (1) critical member |
Unity check, as defined by SACS, is as in Eq. (23):
| ${\text{Unity Check = }}\frac{{{\text{Actual Stresses}}\left( {{\text{in }}{f_a},{f_{by}},{f_{bz}},{f_v},{f_{vt}}} \right)}}{{{\text{Allowable Stresses}}\left( {{\text{in }}{f_a},{f_{by}},{f_{bz}},{f_v},{f_{vt}}} \right)}}$ | (23) |
where fa=axial stress, fby=major bending, fbz=minor bending, fv=resultant shear, and fvt=torsional shear.
4 Results summaryResults for this study are divided and discussed as follows:
1) Simulation of tsunamis;
2) Structural sensitivity analysis on Platform A;
3) Practical application of findings.
4.1 Simulation of tsunamisWe utilized the TUNA–M2 numerical model to simulate tsunami waves generated by an arbitrary seaquake in the Manila Trench. The obtained simulation results were then graphically illustrated and analyzed on the TUNA-M2 platform. The obtained results reflect the wave height and celerity at the specific grid point of interest, ‘Point A', along with the time of arrival of the first tsunami wave that reached the platform. These results were simulated based on different moment magnitudes of an earthquake, ranging from 7.0 Mw to 9.5 Mw, and are displayed in Table 5.
| Mw | Time of arrival/h | Wave height/m |
| 7.00 | 1.975 | 0.001 |
| 7.50 | 1.982 | 0.007 |
| 8.00 | 1.983 | 0.037 |
| 8.50 | 1.985 | 0.200 |
| 9.00 | 1.980 | 1.170 |
| 9.50 | 1.980 | 6.600 |
Fig. 12 shows a typical graphical 2-dimensional elevation-time plot of the sea surface elevation at Platform A, whose geographic position is shown in Fig. 7. The water depth at this point is 63 m. We note that the first wave reaches Platform A from the trench approximately 1.8 to 2 h after the occurrence of the seaquake. The sea-surface profile does not exhibit a clear wave trough that dips below the mean calm surface, which is taken to indicate an undisturbed sea prior to the arrival of the first wave. In the exaggerated graph of Fig. 12, the waves can be interpreted to be steep, but we note that the estimated wave period of the first wave is 0.25 h. This implies a very long wave and a more subtle change of water surface elevation at Platform A than is depicted in the scale of Fig. 12. The apparent absence of a wave trough by the numerical simulation suggests the appropriateness of the solitary wave theory, whose corresponding nonlinear model does not generally include the formation of a wave trough.

|
| Figure 12 Sea surface elevation at Platform A |
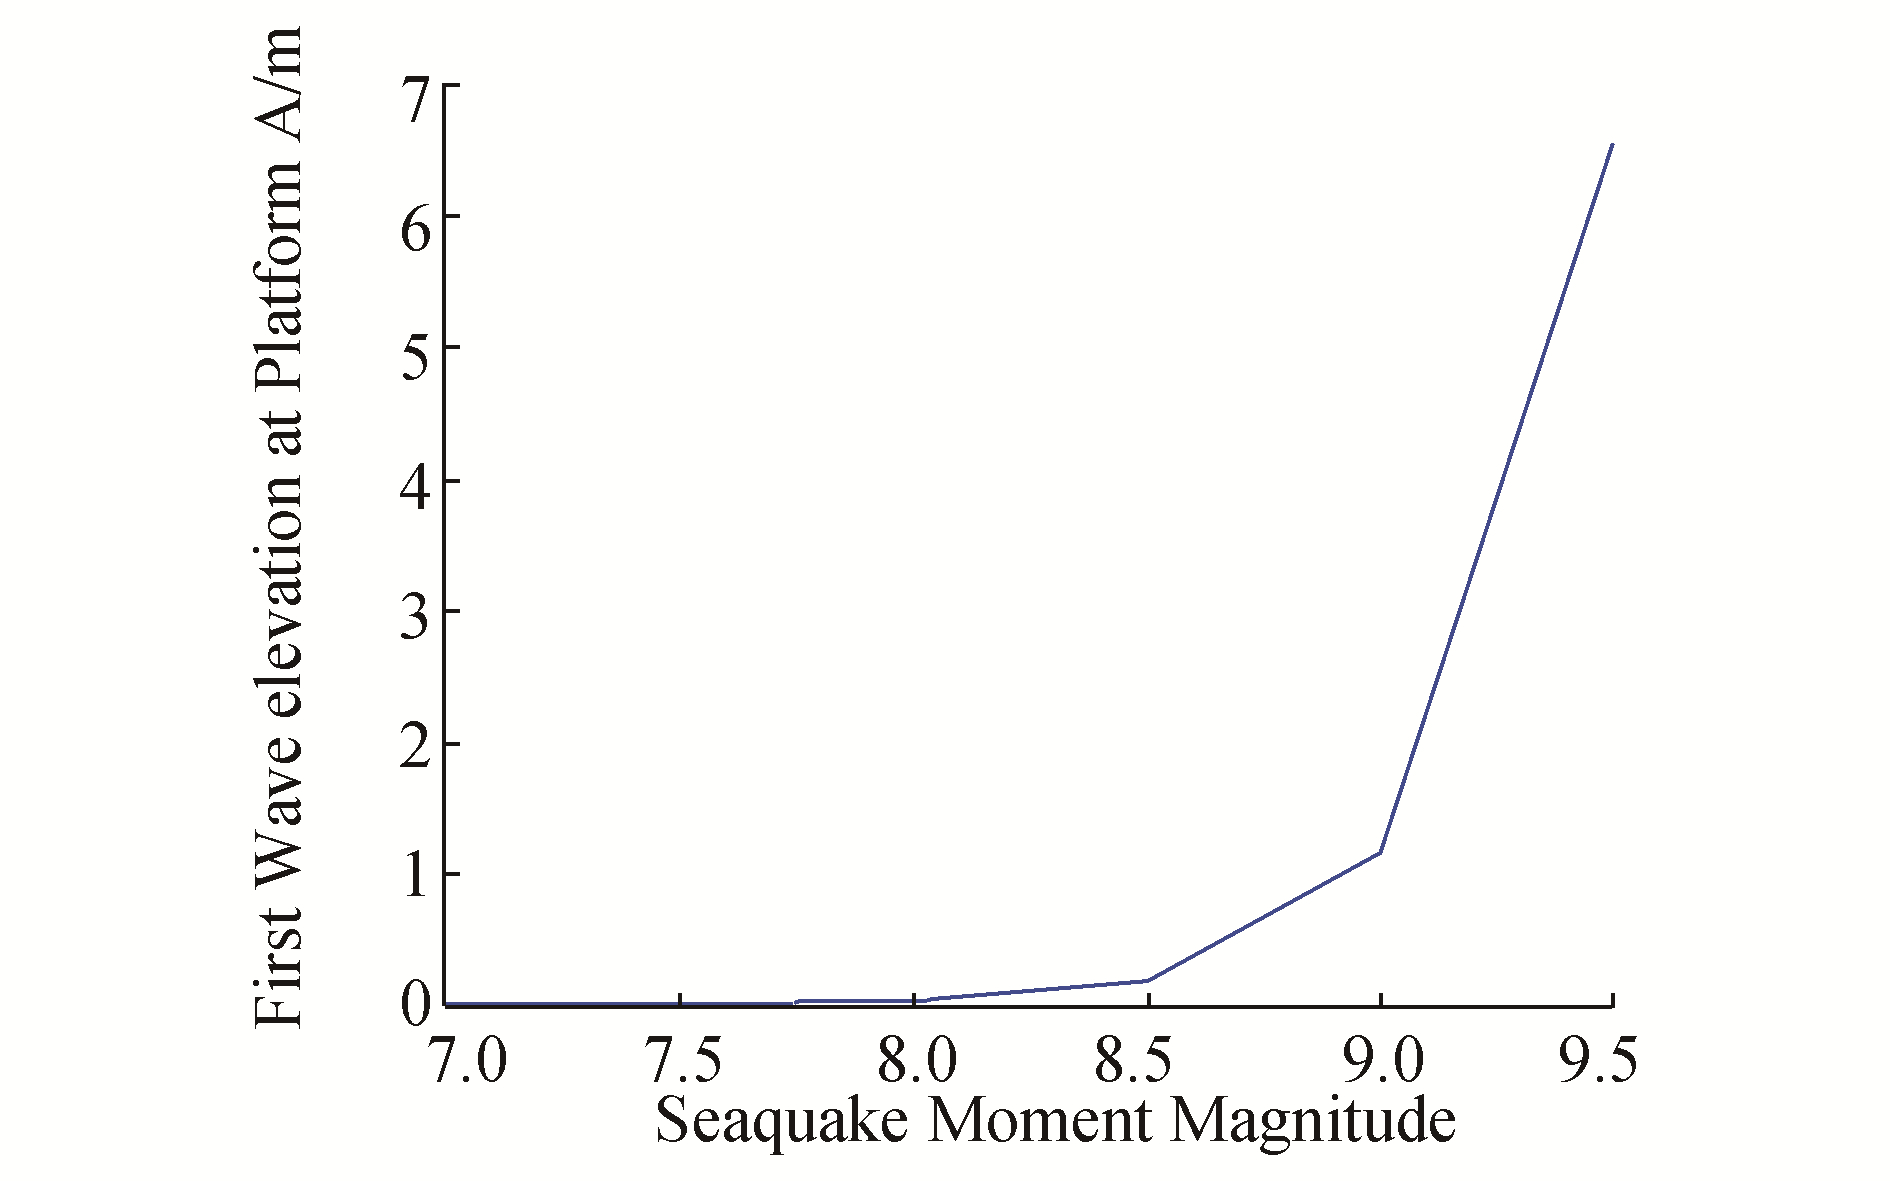
Table 5 relates the various seaquake moment magnitudes to their time of arrival (in hours) to the third decimal point of the first tsunami waves to the offshore platforms, as well as the associated wave heights of the tsunami. Based on the time of arrival of the tsunami waves, we observe that the tsunami waves generated from different earthquake magnitudes travel with very similar celerity towards Platform A. From the table above, we can see that as the moment magnitude increases from 7.0 Mw to 9.5 Mw, the tsunami heights simulated at the offshore Platform A also increase in a highly nonlinear manner. Fig. 13 shows a plot of the wave height to the generating moment magnitude, wherein we clearly see an exponential-like pattern.
|
| Figure 13 Nonlinear relationship between the seaquake magnitude and generated wave |
A simple exponential fitting of the data would suffice to describe the relationship between the Manila Trench seaquake moment magnitude and the associated tsunami wave height generated at Platform A. To this end, we invoked the MATLAB fit (‘exp1') function command to derive the single exponential relationship in the form of Eq. (24):
| $H\left( M \right) = a{e^{\left( {b \times x} \right)}}$ | (24) |
With 95 percent confidence bounds, the coefficients a and b are defined as a=3.368 × 10⁻¹⁴and b=3.464.
Table 6 lists the return period of different earthquake magnitudes. We obtained these return periods by analyzing previous earthquakes around the Manila Trench, obtained from the ANSS from the years 1963 to 2006 by Anat and Nopporn (2009). We note that we employed all these return periods and their associated seaquake moment magnitudes in this study.
| Magnitude/Mw | Return period/a |
| 7.0 | 6 |
| 7.5 | 19 |
| 8.0 | 63 |
| 8.5 | 205 |
| 9.0 | 667 |
| 9.5 | - |
Since the Manila Trench has remained dormant for 440 years (Megawati et al., 2009), it is only prudent to investigate the full range of the return periods from 6 years to the extreme 2185 years. Later, we infer from the results of this study that only a 9.5Mw earthquake would be capable of generating a tsunami that is considered to be in the elevated risk tier for the platform being studied. This inference is based on the assumption that the platform had not suffered severe damage due to any prior accident during its operating life that would have compromised its integrity.
Fig. 14 illustrates the propagation of the tsunami wave from the Manila Trench at 1.11 h and 2.22 h, respectively, from the time of the seaquake. We obtained this graphical output by feeding the TUNA-M2 grid point simulation output into Surfer plotting software, which can generate a 2-D or a 3-D visualization of the output data.

|
| Figure 14 Snapshots of tsunami propagation |
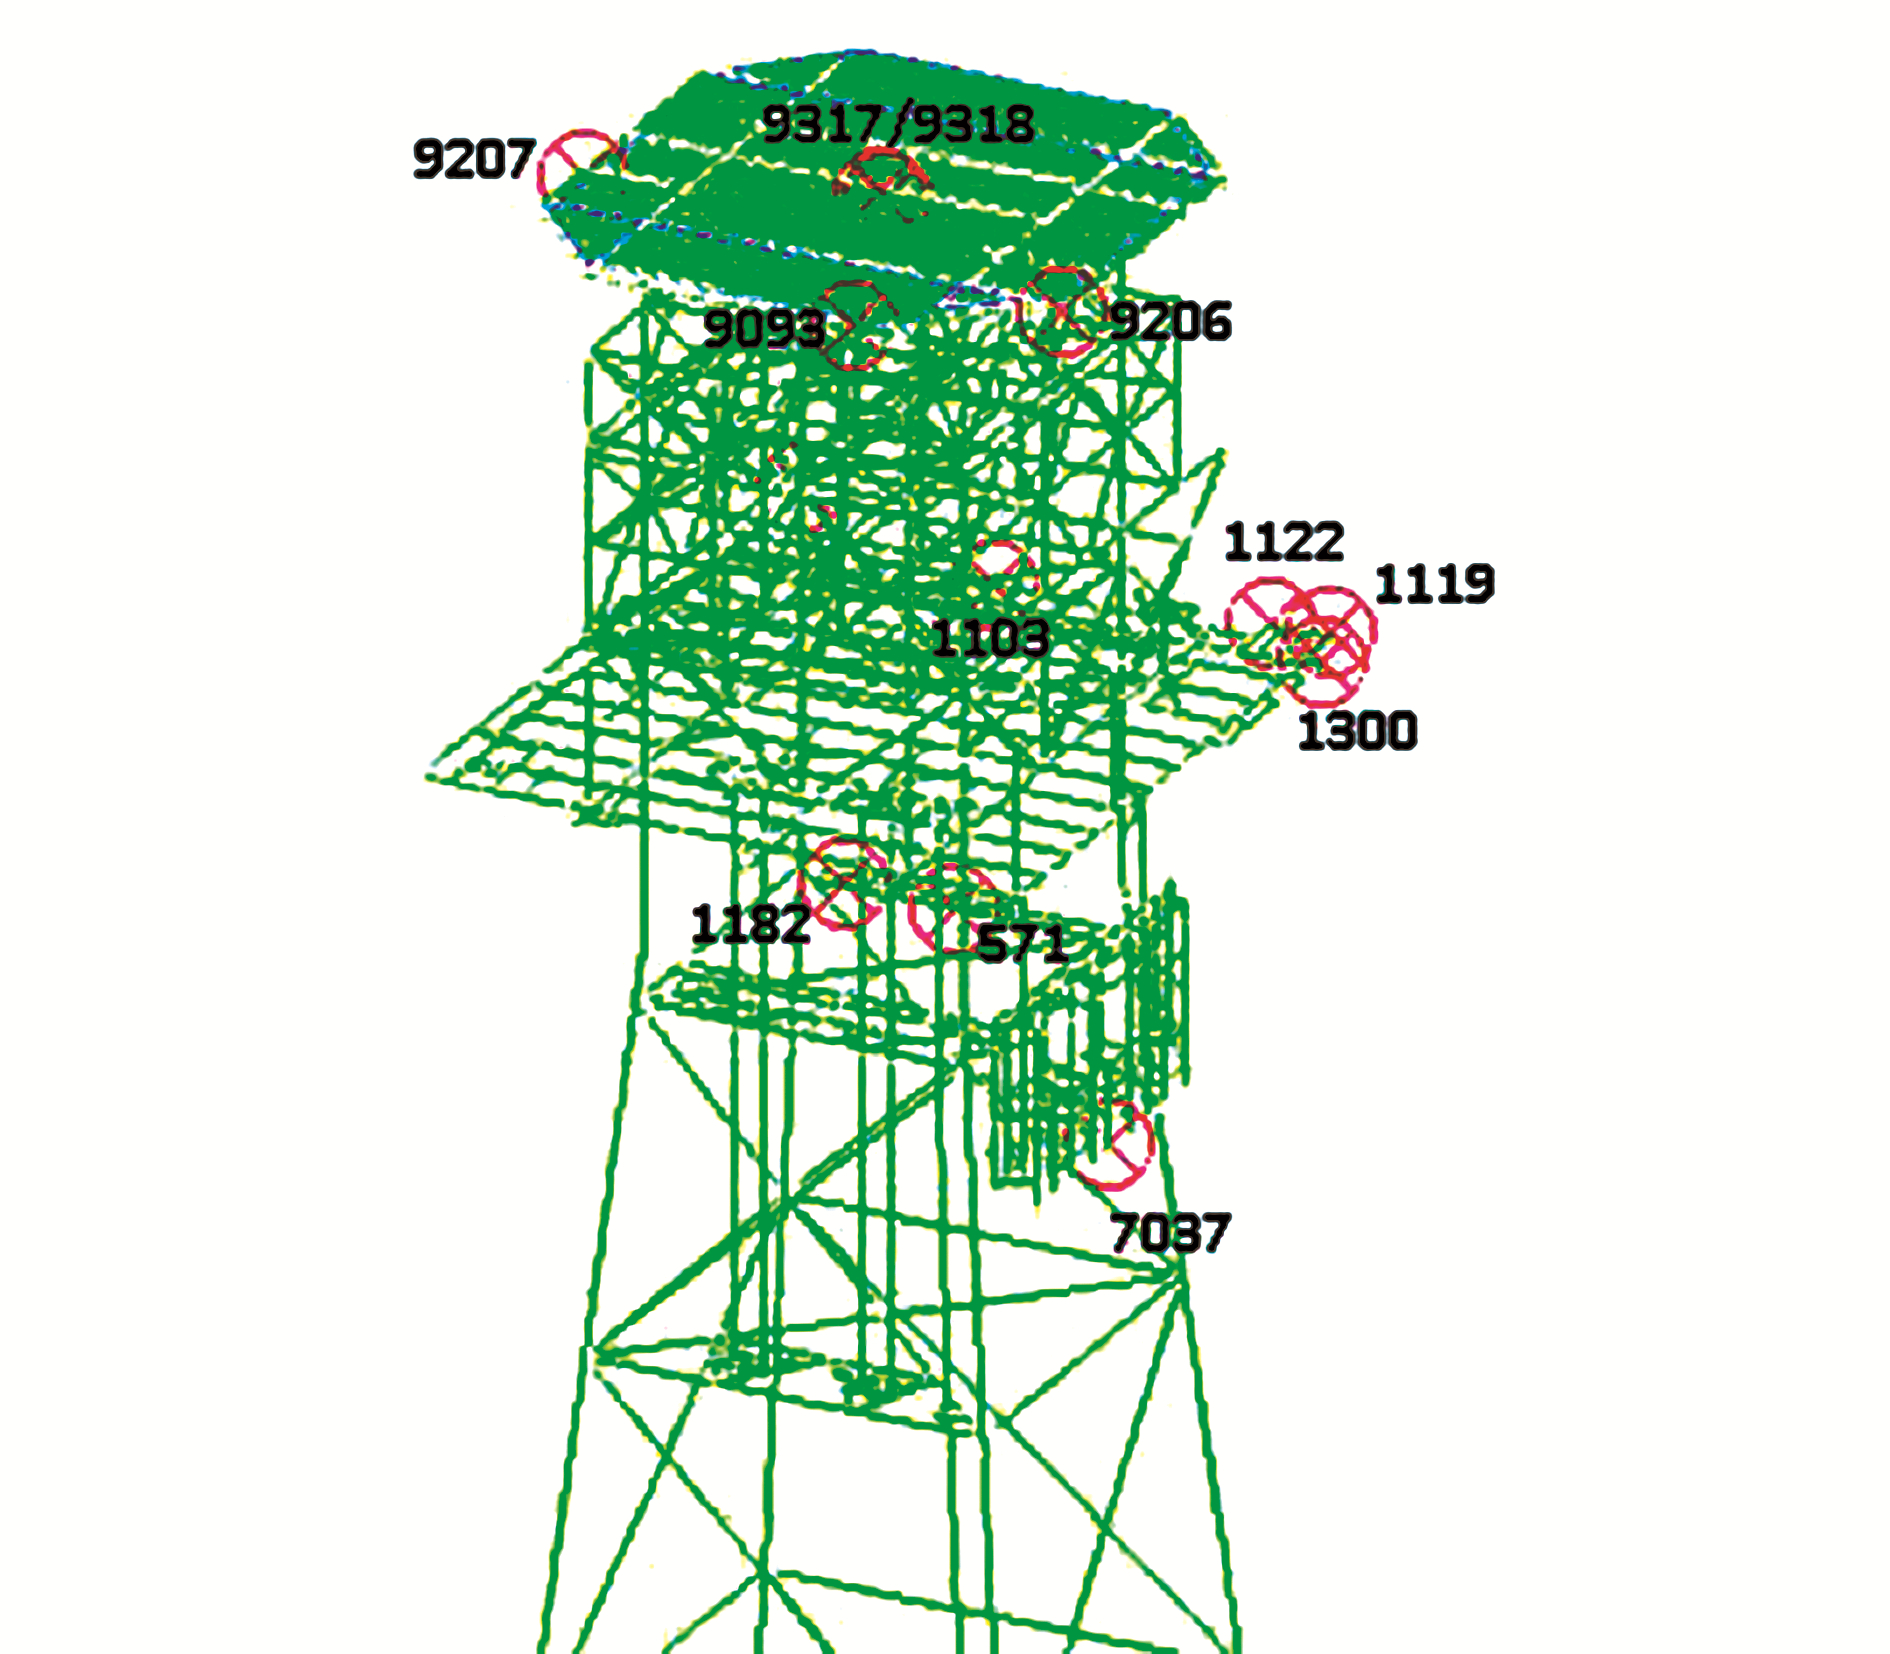
Fig. 15 identifies and highlights a set of critical joints used in the displacement measurement. Table 7 lists the maximum joint displacement recorded on the structure for tsunami wave attacks from every 45°direction. We point out that not all the pre-ascertained critical joints exhibited the largest deflection. The platform response in Table 7 is from the 9.5-Mw seaquake originating at the Manila Trench. We also note that the maximum total resultant joint displacement value for each direction exhibits a small deviation from the others. This is attributed to the generic symmetry of the platform under investigation, which has a square planar section.
|
| Figure 15 Location of critical joint displacement results at Topside |
| Maximum joint displacements | ||||||
| Load condition/(°) | Joint | DEFL(x)/cm | Joint | DEFL(y)/cm | Joint | DEFL(T)/cm |
| 0 | 7037 | 11.338 | 1122 | 0.887 | 7037 | 11.443 |
| 45 | 7037 | 7.811 | 9206 | 7.875 | 9317 | 11.598 |
| 90 | 1119 | −0.766 | 9206 | 10.458 | 1122 | 11.759 |
| 135 | 7037 | −8.254 | 9207 | 7.846 | 9318 | 11.936 |
| 180 | 7037 | −11.623 | 9207 | 1.386 | 7037 | 11.755 |
| 225 | 9093 | −8.122 | 1300 | −7.224 | 1182 | 11.155 |
| 270 | 9093 | −0.901 | 1300 | −9.728 | 1103 | 10.828 |
| 315 | 7037 | 7.969 | 571 | −6.865 | 1103 | 11.398 |
Table 8 details the unity check on the critical main legs of the platform. We can see that even with up to approximately 12 cm of topside displacement from its original position, the platform unity check is still within the elastic stress limit (less than unity). We defer our discussion of unity checks and the corresponding quantification of risk to the next sections.
| 9.5Mw | 9.0Mw | 8.5Mw | 8.0Mw | 7.5Mw | 7.0Mw | |||||||||||||||||
| Member | Max unity check | Member | Max unity check | Member | Max unity check | Member | Max unity check | Member | Max unity check | Member | Max unity check | |||||||||||
| 131-124 | 0.073 | 131-124 | 0.029 | 131-124 | 0.027 | 131-124 | 0.027 | 131-124 | 0.027 | 131-124 | 0.027 | |||||||||||
| 120-211 | 0.085 | 120-211 | 0.049 | 120-211 | 0.046 | 120-211 | 0.045 | 120-211 | 0.045 | 120-211 | 0.045 | |||||||||||
| 125-241 | 0.087 | 125-241 | 0.05 | 125-241 | 0.046 | 125-241 | 0.046 | 125-241 | 0.046 | 125-241 | 0.046 | |||||||||||
| 124-231 | 0.118 | 124-231 | 0.057 | 124-231 | 0.051 | 124-231 | 0.05 | 124-231 | 0.05 | 124-231 | 0.05 | |||||||||||
| 221-321 | 0.401 | 221-321 | 0.087 | 221-321 | 0.055 | 221-321 | 0.051 | 221-321 | 0.05 | 221-321 | 0.05 | |||||||||||
| 211-311 | 0.548 | 211-311 | 0.124 | 211-311 | 0.082 | 211-311 | 0.076 | 211-311 | 0.075 | 211-311 | 0.075 | |||||||||||
| 241-341 | 0.552 | 241-341 | 0.129 | 241-341 | 0.087 | 241-341 | 0.081 | 241-341 | 0.08 | 241-341 | 0.08 | |||||||||||
| 421-443 | 0.599 | 441-444 | 0.148 | 341-441 | 0.093 | 341-441 | 0.085 | 341-441 | 0.084 | 341-441 | 0.083 | |||||||||||
| 441-444 | 0.62 | 311-411 | 0.154 | 441-444 | 0.099 | 441-444 | 0.092 | 441-444 | 0.091 | 441-444 | 0.091 | |||||||||||
| 331-431 | 0.624 | 341-441 | 0.154 | 311-411 | 0.106 | 311-411 | 0.1 | 311-411 | 0.099 | 311-411 | 0.098 | |||||||||||
| 231-331 | 0.638 | 331-431 | 0.157 | 331-431 | 0.109 | 331-431 | 0.103 | 331-431 | 0.102 | 331-431 | 0.101 | |||||||||||
| 411-511 | 0.643 | 231-331 | 0.163 | 231-331 | 0.115 | 231-331 | 0.109 | 231-331 | 0.108 | 231-331 | 0.108 | |||||||||||
| 431-531 | 0.667 | 321-421 | 0.172 | 321-421 | 0.117 | 321-421 | 0.11 | 321-421 | 0.109 | 321-421 | 0.108 | |||||||||||
| 311-411 | 0.749 | 421-443 | 0.176 | 411-511 | 0.131 | 411-511 | 0.125 | 411-511 | 0.124 | 411-511 | 0.124 | |||||||||||
| 341-441 | 0.754 | 411-511 | 0.179 | 421-443 | 0.132 | 421-443 | 0.126 | 421-443 | 0.125 | 421-443 | 0.125 | |||||||||||
| 321-421 | 0.822 | 431-531 | 0.189 | 431-531 | 0.153 | 431-531 | 0.147 | 431-531 | 0.146 | 431-531 | 0.146 | |||||||||||
Next, we analyzed the joint displacements for the whole structure at the pre-determined critical topside joints. We did so utilizing the SACS v5.3 built-in solver (SACS IV) and post processor (Postvue) to obtain the maximum displacements in the X, Y, and Z dimensions, as well as the total maximum resulting displacement vector. Here, we discuss only the deflection results from the worst-case scenario studied (9.5-Mw seaquake), as presented in Table 7.
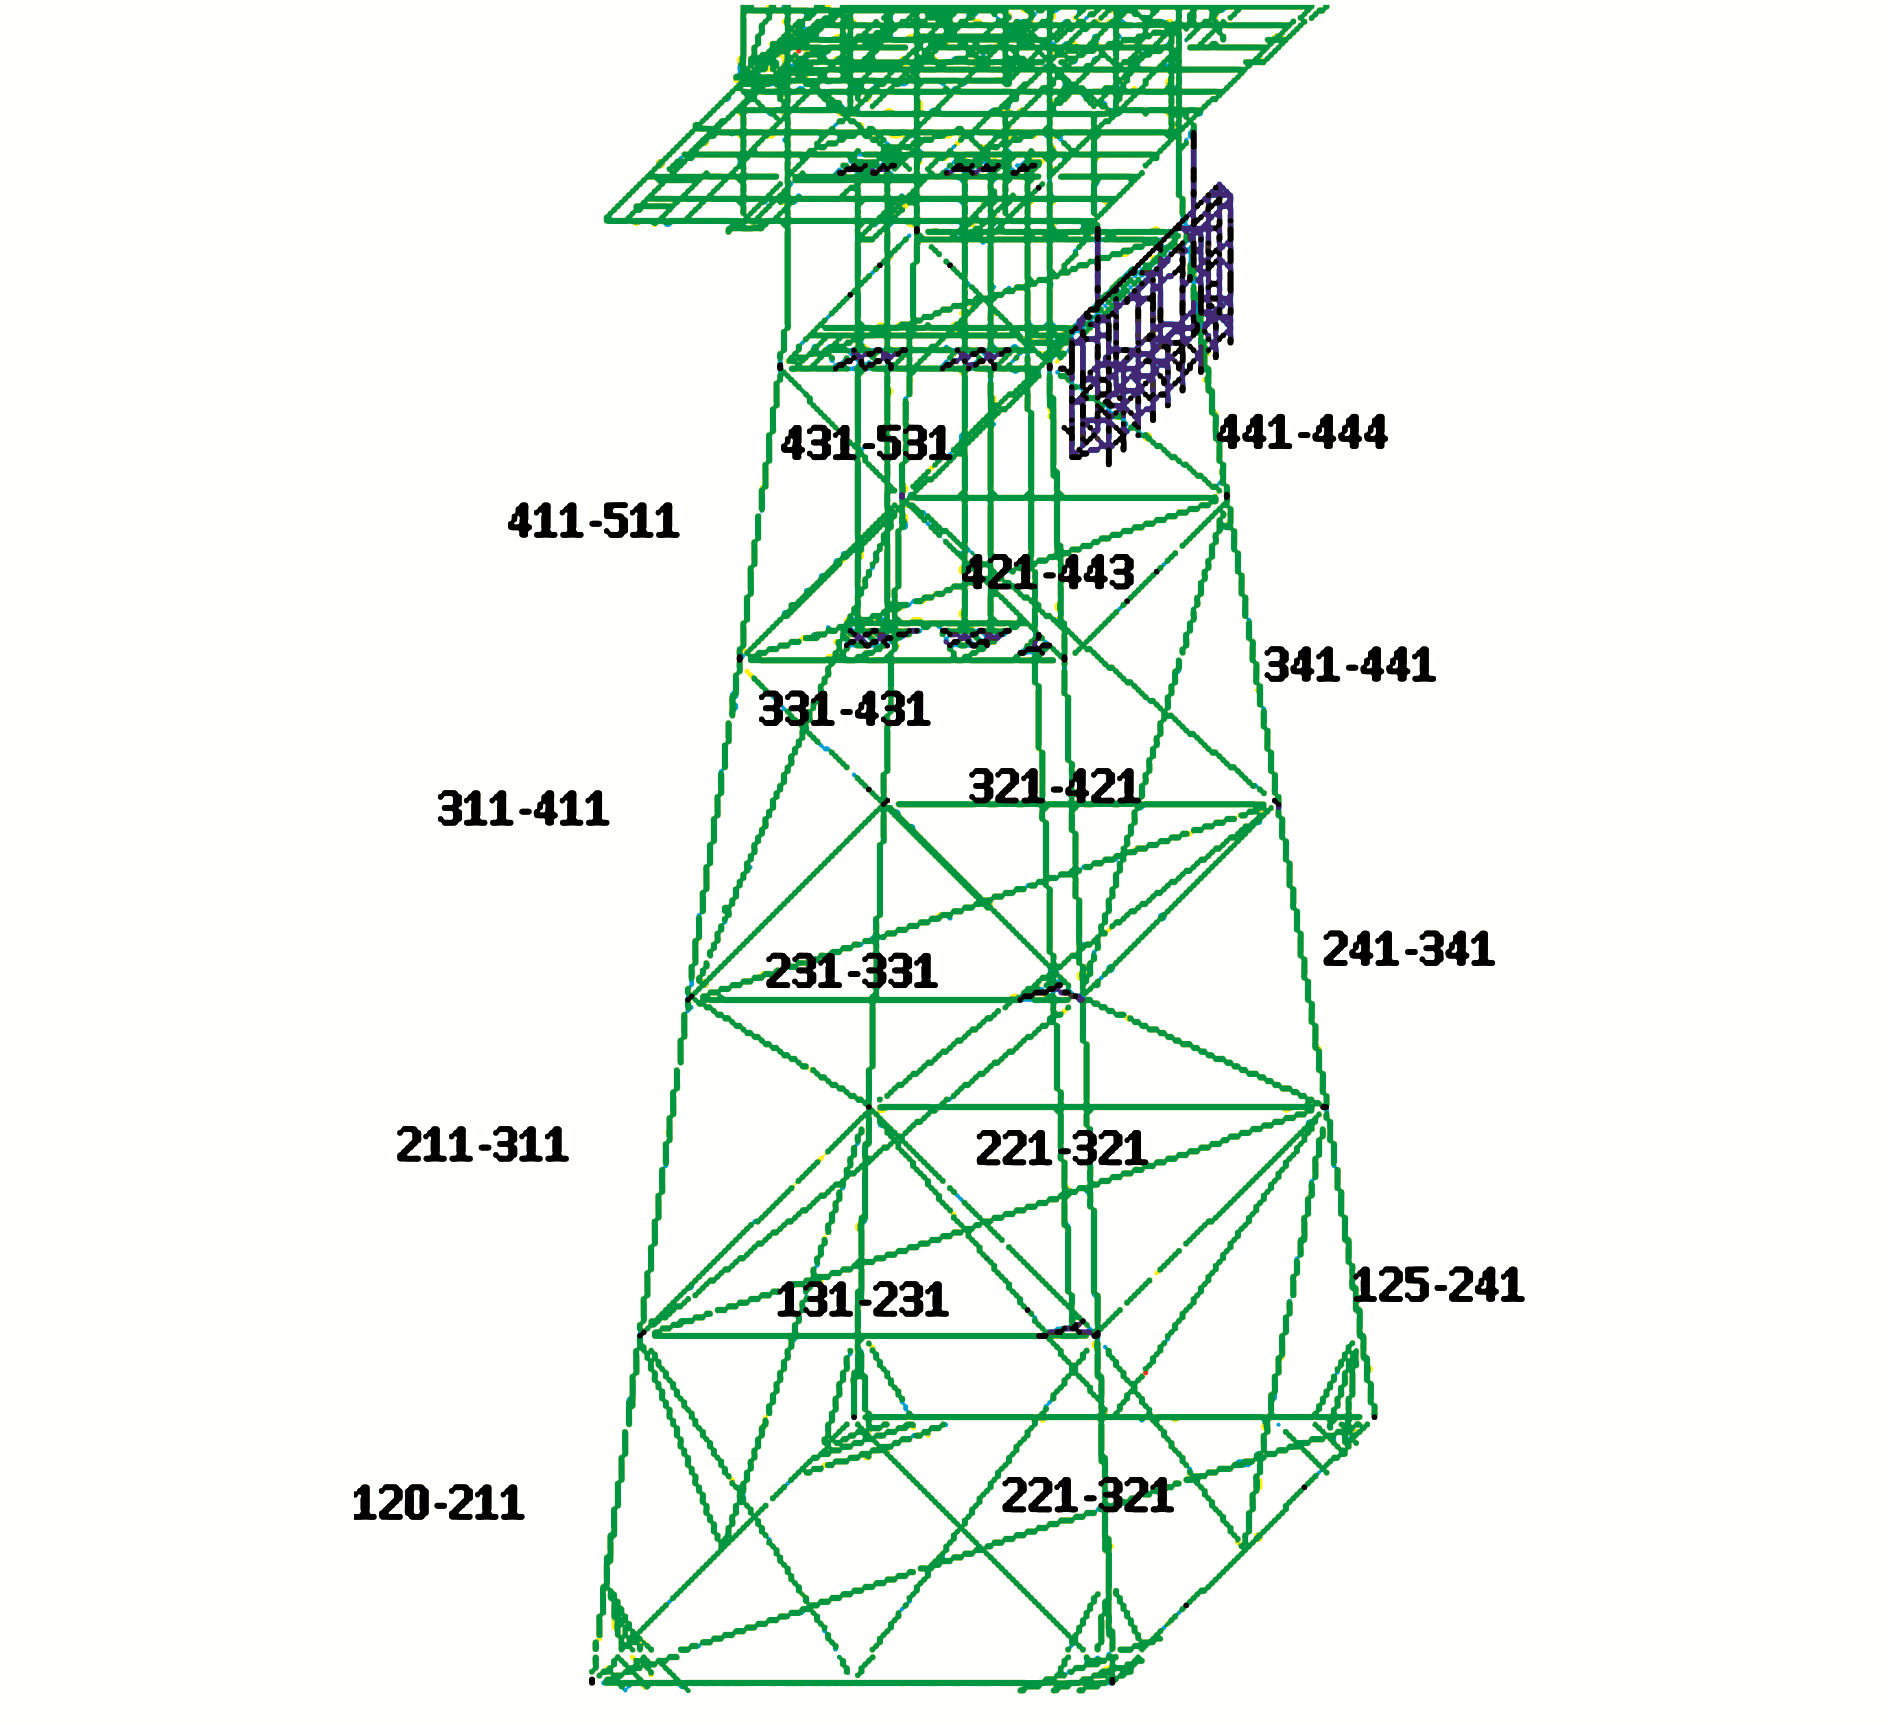
4.3 Unity checks of platform AA unity check is the ratio of the actual load to the allowable strength of a member. This ratio implies that the maximum unity check allowable for members operating within the elastic limit range is 1.0. However, as the platform in question carries a great number of lives onboard its decks, the maximum allowable UC for tsunami wave loadings is limited to 0.8, at which time a stop work order is issued and platform evacuation protocols are activated. This procedure is outlined in Table 4. In this study, we determined the critical members for UC valuation to be the four main legs of the jacket structure. This is appropriate from a purist perspective, and the UC for these legs for each of the earthquake magnitudes are compiled in Table 8. The leg members may be viewed graphically in Fig. 16.
|
| Figure 16 Labels for four jacket leg members |
By identifying the members that would experience the highest UCs in the event of tsunami wave propagation, the risk can be evaluated based on the formulated risk rating system outlined in Table 4. This enables the listing of critical member segments of the structure in the event of a tsunami. In addition to risk quantification, this knowledge can also be crucial in maintenance planning for post-event remedial and inspection work. Although this study utilizes only the main legs of the platform as critical members, this concept can be extended to include braces and other structural support elements.
Table 8 details the unity check tabulations of the jacket members against the earthquake moment magnitudes. The rows are arranged such that the largest unity checks with the associated members are at the bottom. We can see that, at magnitude 9.5 Mw, only one member has a maximum unity check value of more than 0.8, which in this case we evaluated based on the formulated risk table.
4.4 Practical application of findingsThe sensitivity finite element study of Platform A can serve as a novel benchmark for aiding quick decision making related to risk quantification and post-exteme-event assessment. We propose a specifically formulated risk rating model framework for a living-quarters fixed-jacket platform, as shown in Table 4. The risk-matrix rating implied by the structure is mainly based on the static stress unity check results, but can be cross validated against the maximum joint displacement included in Table 7 for a separate independent correlation check using other software variations. Table 9 summarizes the triangulated results for Platform A's risk categorization based on the tsunami-generating seaquake moment magnitude. The entire global structural tsunami risk level is governed by the worst-rated member. The design philosophy we employ stipulates that a structure is only as strong as its weakest member, hence, failure of any load-bearing member is considered to have serious consequences.
| 9.5Mw | 9.0Mw | 8.5Mw | 8.0Mw | 7.5Mw | 7.0Mw | |||||||||||||||||
| Member | Risk level | Member | Risk level | Member | Risk level | Member | Risk level | Member | Risk level | Member | Risk level | |||||||||||
| 131-124 | L1 | 131-124 | L1 | 131-124 | L1 | 131-124 | L1 | 131-124 | L1 | 131-124 | L1 | |||||||||||
| 120-211 | L1 | 120-211 | L1 | 120-211 | L1 | 120-211 | L1 | 120-211 | L1 | 120-211 | L1 | |||||||||||
| 125-241 | L1 | 125-241 | L1 | 125-241 | L1 | 125-241 | L1 | 125-241 | L1 | 125-241 | L1 | |||||||||||
| 124-231 | L1 | 124-231 | L1 | 124-231 | L1 | 124-231 | L1 | 124-231 | L1 | 124-231 | L1 | |||||||||||
| 221-321 | L1 | 221-321 | L1 | 221-321 | L1 | 221-321 | L1 | 221-321 | L1 | 221-321 | L1 | |||||||||||
| 211-311 | L2 | 211-311 | L1 | 211-311 | L1 | 211-311 | L1 | 211-311 | L1 | 211-311 | L1 | |||||||||||
| 241-341 | L2 | 241-341 | L1 | 241-341 | L1 | 241-341 | L1 | 241-341 | L1 | 241-341 | L1 | |||||||||||
| 421-443 | L2 | 441-444 | L1 | 341-441 | L1 | 341-441 | L1 | 341-441 | L1 | 341-441 | L1 | |||||||||||
| 441-444 | L2 | 311-411 | L1 | 441-444 | L1 | 441-444 | L1 | 441-444 | L1 | 441-444 | L1 | |||||||||||
| 331-431 | L2 | 341-441 | L1 | 311-411 | L1 | 311-411 | L1 | 311-411 | L1 | 311-411 | L1 | |||||||||||
| 231-331 | L2 | 331-431 | L1 | 331-431 | L1 | 331-431 | L1 | 331-431 | L1 | 331-431 | L1 | |||||||||||
| 411-511 | L2 | 231-331 | L1 | 231-331 | L1 | 231-331 | L1 | 231-331 | L1 | 231-331 | L1 | |||||||||||
| 431-531 | L2 | 321-421 | L1 | 321-421 | L1 | 321-421 | L1 | 321-421 | L1 | 321-421 | L1 | |||||||||||
| 311-411 | L2 | 421-443 | L1 | 411-511 | L1 | 411-511 | L1 | 411-511 | L1 | 411-511 | L1 | |||||||||||
| 341-441 | L2 | 411-511 | L1 | 421-443 | L1 | 421-443 | L1 | 421-443 | L1 | 421-443 | L1 | |||||||||||
| 321-421 | L3 | 431-531 | L1 | 431-531 | L1 | 431-531 | L1 | 431-531 | L1 | 431-531 | L1 | |||||||||||
In scrutinizing the contents of Table 9, we see that a tsunami wave generated by a seaquake of magnitude less than 9-Mw propagating through Platform A will not pose an immediate threat to the platform. Platform A will not fail instantaneously even after being impacted by a high-speed tsunami wave generated by a 9.5-Mw seaquake from the Manila Trench. This assessment is made assuming that the platform is well maintained and that no excessive damage has occurred in its major structural members to considerably compromise its overall stiffness. Such an event, however, would raise the platform's risk level to L3, with reference to the rating model in Table 4, immediately after the inundation of the first wave from a 9.5-Mw magnitude seaquake from the Manila Trench. L3 in Table 4 stipulates the need for careful monitoring of the platform condition and the scheduling of a visual inspection and non-destructive testing of the critical members and joints. These critical members and joints can be identified in Tables 8 and 9. For instance, jacket members 321-421 qualify for the L3 rating, hence require greater attention. By identifying priority members and joints, a quick work order can be issued with minimal time delayed in the decision making, from which we also anticipate a reduction in the cost of post-damage evaluation.
The application of such a model in the industry would typically require the measurement of certain physical quantities of the platform. At best, these would include the platform responses, which would necessitate it being rigged with displacement sensors and accelerometers. There are cases in Malaysian waters of platforms having been instrumented with offshore industry-grade sensors to measure its responses in tandem with the application of an FEM, as required for reporting unexpected motion from previous damage incidents.
By employing the method proposed in this paper for rating front-end risk, the only data required is information about the seaquake, supplemented where possible by data on the surrounding sea-surface elevations. In the absence of real-time platform-response data, this risk rating model is anticipated to provide decision makers with enough information to make better decisions and to develop foresight on the expected scope of work, if any, regarding platform inspection, repair, and maintenance. In the case of a measurable seaquake detected from the Manila Trench, the ratings in Table 9 can then be directly utilized to make an immediate risk evaluation prior to further action being taken. We note that this study is a platform-specific exercise, and that the tsunami risk hazard table will differ from one platform to another. Nonetheless, the concept presented here is holistic and can be applied in a similar manner to any four-legged fixed-jacket platform in comparable water depths. It sets a working framework that can be deployed on other platforms, regardless of the type or environment, to develop a front-end risk rating system. We caution that we do not recommend this system for minimal platform designs such as monopod systems, where the inherent structural redundancy is not as robust as in multi-legged substructures.
5 ConclusionsIn this paper, we simulated in detail tsunami waves resulting from Manila Trench seaquakes of different magnitudes with various associated return periods, ranging from 7-Mwto an upper bound of 9.5-Mw. We simulated tsunami wave propagation using TUNA-M2 software, which applies shallow-water equations discretized by a staggered finite difference scheme. We created a finite element model of an actual four-legged living-quarters jacket platform in Malaysian waters situated in water 63-m deep. As inputs to the SACS Seastate module, we used the tsunami wave heights at the platform's geo-grid location to calculate the wave kinematics and dynamics, based on the nonlinear solitary wave theory. We then performed a static joint displacement and unity check. The static assumption is appropriate due to the long period of a tsunami wave, which is several orders of magnitude greater than that of the typical natural period of a fixed offshore platform. We identified the critical members and extracted full results from them. We then employed a novel platform specific risk rating system to generate immediate front-end risk rating and management solutions to support decision making. We note that although this is a platform-specific exercise, the concept and methodologies can be applied to any fixed-jacket platform to rate tsunami risk. This work addresses the gap in both academia and industry in formulating emergency response plans and fast-track decision making in the event of a seaquake-tsunami incident. The top-line research results for Platform A can be summarized as follows:
•The time of arrival of the first tsunami wave at Platform A is approximately 1.9 h after the seaquake occurrence in the Manila Trench.
•The relationship between the tsunami wave height arriving at Platform A and the seaquake moment magnitude is exponential in nature, as shown by Eq. (24). This equation can be used as a first estimate for interpolating intermediate moment magnitude values.
•The tsunami generated from a 9.5Mw seaquake at the Manila Trench and propagating over Platform A will generate an L3-tier risk rating. Based on linear static analysis, the platform should remain standing despite a 2185 year return event. This assessment is based on the assumption that the structure has not suffered historical damage that has compromised its design integrity prior to inundation from the tsunami wave.
6 AcknowledgmentThe authors wish to acknowledge both Universiti Teknologi PETRONAS and Universiti Tenaga Nasional for providing support for this study.
| Anat R, Nopporn S, 2009. Effect of Tsunamis generated in the Manila Trench on the Gulf of Thailand. Journal of Asian Earth Sciences, 36(2009), 56–66. |
| ARUP International Development, 2011. Characteristics of a safe and resilient community: community based disaster risk reduction study. International Federation of Red Cross and Red Crescent Societies. |
| Cham KL, Teh SY, Koh HL, 2006. Numerical simulations of Indian Ocean tsunami. TUNA-M2. |
| Fenton JD, 1979. A high order cnoidal wave theory. Journal of Fluid Mechanics, 94(part 1), 129–161. DOI:10.1017/S0022112079000975 |
| Hayashi M, Schirling P, 2015. Visual tsunami warning system. Proceedings of the Twenty-fifth (2015) International Ocean and Polar Engineering Conference, Kona, Big Island, Hawaii, USA, 865-872. |
| Imamura F, Shuno N, Goto C, 1988. Numerical simulations of the transoceanic propagation of tsunamis. Proceedings of 6th Congress Asian and Pacific Regional Division, 265-272. |
| Jaimes MA, Reinoso E, Ordaz M, Heurta B, Silva R, Mendoza E, Rodriguez JC, 2016. A new approach to probabilistic earthquake induced tsunami risk assessment. Ocean and Coastal Management, 119, 68–75. DOI:10.1016/j.ocecoaman.2015.10.007 |
| Jayaratne R, Premaratne B, Mikami T, Matsuba S, Shibayama T, Esteban M, Marriott M, 2015. Chapter 17:Destruction of coastal structures after the 2011 great east japan earthquake and tsunami handbook of coastal disaster mitigation for engineers and planners. Elsevier, 349-362. DOI:10.1016/B978-0-12-801060-0.00017-4 |
| Kim JH, Ahn SH, Ha TM, Cho YS, 2011. Development of a nested tsunami propagation model. Proceedings of the 21st (2011) International Offshore and Polar Engineering Conference, Hawaii, USA, 259-263. |
| Kirby S, Geist E, Lee HKW, Scholl D. Blakely R, 2006. Tsunami source Characterization for Western Pacific Subduction Zones: A Preliminary Report. USGS Tsunami Subduction Source Working Group 2005, Houston TX. |
| Koh HL, Teh SY, Liu PLF, Ismail AIM, Lee HL, 2009. Simulation of Andaman 2004 tsunami for assessing impact on Malaysia. Journal of Asian Earth Sciences, 36(1), 74–83. DOI:10.1016/j.jseaes.2008.09.008 |
| Koshimura S, Hayashi S, Gokon H, 2014. The Impact of the 2011 Tohoku earthquake tsunami disaster and implications to reconstruction. The Japanese Geotechnical Society, Soils and Foundations, Elsevier. |
| Levin B, 2008. Physics of tsunamis. New York: Springer. |
| Liu PLF, Wang XM, Salisbury AJ, 2009. Tsunami hazard and early warning system in South China Sea. Journal of Asian Earth Sciences36, 36, 2. DOI:10.1016/j.jseaes.2008.12.010 |
| Madsen PA, Fuhman DR, Schaffer HA, 2008. On the solitary wave paradigm for tsunamis. Journal of Geophysical Research, 113. DOI:10.1029/2008JC004932 |
| Megawati K, Shaw F, Sieh K, Huang Z, Wu TR, Lin Y, Pan TC, 2009. Tsunami hazard from the subduction megathrust of the South China Sea:Part I. Source characterization and the resulting tsunami. Journal of Asian Earth Sciences, 36(1), 13–20. DOI:10.1016/j.jseaes.2008.11.012 |
| Papazachos BC, Scordilis EM, Panagiotopoulos DG, Papazachos CB, Karakaisis GF, 2004. Global relations between seismic fault parameters and moment magnitude of earthquakes. Proceedings of the 10th International Congress, Thessaloniki2004, Bulletin of the Geological Society of Greece, XXXVI, 1482. |
| Takagi K, 1996. Interaction between tsunami and artificially floating island. InternationalJournal of Offshore and Polar Engineering, 6(3), 171–176. |
| Teh SY, Koh HL, 2011. Tsunami simulation for capacity development.Proceedings of the International Multi Conference of Engineers and Computer Scientists 2011, 2, Hong Kong. |
| Vita-Finzi C, 2015. Misattributed tsunami 4:the 2014. 04.01 Iquique (Chile) Mw 8.2 Earthquake.Proceedings of the Geologists Association, 126, 551–553. |
| Wu TR, 2012. Deterministic study on the potential large tsunami hazard in Taiwan. Journal of Earthquake and Tsunami, 6(3), 1250034. DOI:10.1142/S1793431112500340 |
| Wu TR, Hui CH, 2009. Modelling tsunami hazards from Manila Trench to Taiwan. Journal of Asian Earth Sciences, 36, 21–28. DOI:10.1016/j.jseaes.2008.12.006 |
| Zhang LF, Liao WL, Li JG, Wang QL, 2015. Estimation of the 2010 Mentawai tsunami earthquake rupture process from joint inversion of teleseismic and strong ground motion data. Geodesy and Geodynamics, 6(3), 180–186. DOI:10.1016/j.geog.2015.03.005 |


