1 Introduction
The first offshore wells were drilled in the U.S. Gulf of Mexico (GOM) in 1947, and by 1978, the first pipeline was installed in over 1 000 ft water depth. Today, GOM pipelines transport hydrocarbon streams in water depths up to 9 500 ft. The U.S. GOM is the largest oil and gas pipeline network in the world, and at the end of 2014, about 44 000 miles of pipeline was installed in federal waters, with about one-third of new construction over the past decade in water depths greater than 1 000 ft.
The physical scope of offshore developments can vary tremendously and it is necessary to properly delineate the system boundaries, technology applications, contract strategies, and cost components before system comparisons can be made. Development requirements start with knowledge of the reservoir and end with the export systems that transports product to market:
● Reservoir
● Wells and completions
● Production host
● Subsea equipment and flowlines
● Export systems
The number and type of wells required and completion strategy depend on the complexity, size, and areal extent of the reservoir and fluid properties. Selection of the host facility and dry/wet tree requirements dictate the subsea architecture and are based on capital requirements, risk-reward tradeoffs, flow assurance issues, and additional factors. Pipeline projects normally consist of the following operations:
1) Gather and analyze data for flowline routes;
2) Design, engineer, and procure pipelines;
3) Mobilize/demobilize the pipelay vessel and auxiliary equipment to the job site;
4) Lay pipe between subsea well(s) and platform, and between platform or pipeline endpoint(s);
5) Install risers on platforms or subsea assembly tie-ins to pipelines;
6) Install umbilicals, jumpers, flying leads, and other subsea equipment;
7) Inspect, test, and commission.
In the GOM, the seafloor topography ranges from the flat and mostly featureless shallow waters to more complex conditions on the continental slope and deepwater, herein referred to as water depths greater than 1 000 ft. Pipeline routes are selected to avoid areas of possible land sliding and faulting, mud seeps, undulations, and rocky outcrops. Routes may be selected to avoid difficult terrain, but the added length needs to be compared with the cost to rectify the spans. Producers typically perform or oversee the route selection process and are involved to varying extent with the engineering, procurement, and construction process. Installation and commissioning are performed by third-party marine contractors.
Every installation project is evaluated individually since each installation is project, time and location specific. The J-lay and S-lay methods are the most common installation method and are named for the shape each pipe assumes during construction. In J-lay mode, the pipe departs the vessel with a large departure angle leading the pipe to a single curvature to the seabed, or J-shape. S-lay mode uses a smaller departure angle and the pipe has a double curvature, or S-shape. Lay rates are vessel and project specific and depend upon the weather and other factors (Gerwick, 2007). J-lay rates can be as low as 1 km per day, while rates for S-lay installation for high-spec vessels such as Allseas Solitaire can be as high as 9 km/day, and reel lay rates can exceed 12 km/day. S-lay dominates deepwater pipelay work in the GOM.
The purpose of this paper is to review deepwater pipeline construction cost and installation methods in the U.S. Gulf of Mexico. We begin with a brief synopsis of pipeline components and contract strategies, and describe the data sources and processing methods applied. Case studies are presented based upon public data sources, and are believed to represent the majority of publicly available cost data reported in the literature.
2 Offshore pipeline systemsTwo types of pipeline systems are utilized in offshore development, those associated with transporting processed oil and gas from a processing facility to shore and referred to as export systems, and those pipelines associated with delivering raw fluids from a subsea wellhead or platform to a host facility, or processed fluids such as natural gas or water from a host facility injected back into a wellhead or reservoir to improve production or maintain reservoir pressure, referred to as infield flowlines. Export lines are also called sales quality oil and gas pipelines, and infield flowlines are also called gathering and injection lines and are one component of Subsea Equipment, Umbilicals, Risers, Flowlines (SURF) systems.
Floating production systems with surface completions and surface trees (dry trees) are nearly identical to the design and operation of shallow water platforms. Systems are configured for either full or partial processing. Partial processing systems reduce capital cost but must use processing capacity elsewhere. A full process system will produce pipeline quality oil and gas, meter each flow, and pump/compress each phase separately into an oil or gas sales line. Floating production systems moored over a drilling template provide direct vertical access to the wells and avoid the use of flowlines and umbilicals.
Pipelines may be rigid steel, flexible line, or pipe-in-pipe systems using two pipes and separated by insulation (Bai and Bai, 2012). All types are used throughout the world but rigid steel and flexible lines are by far the most common. Rigid pipe is the simplest and least expensive and often considered the most reliable for long-term service. Flexible pipe is used for small diameter, short distance flowlines, as jumpers from wellheads and well manifolds to rigid flowlines, and as static and dynamic risers. Flexible pipelines are generally heavier than rigid steel pipelines for the same diameter and pressure (Palmer and King, 2008).
Pipe-in-pipe systems are used to maintain the temperature of the fluids to prevent formation of hydrates, reduce wax deposition, or to reduce the pressure drop by reducing the viscosity of heavy crudes, and are relatively expensive because of the need for a second pipe and complexity of fabrication. In a pipe-in-pipe scheme, the transported fluid is carried by an internal line, which lies within a larger pipe supported by spacers. The annulus may be partially evacuated and filled with another gas, and the construction process and need for two pipelines acts to increase the cost and time of construction.
Risers transmit production to and from the host facility, and are different than the pipelines and flowlines that reside on the seabed since they are subject to a range of changing forces over long periods of time. Ocean currents, water pressure, vessel motion, and wave actions are the primary forces that risers encounter over their lifetime, and therefore must be designed to minimize fatigue damage. Risers attached to fixed platforms are also considerably different than risers attached to floaters. Risers are often included in the pipeline contract and construction cost are not frequently broken out separately.
In a remote subsea production system, a mobile offshore drilling unit drills and completes wells using a template or clustered manifold, which commingles the fluid streams in a multiphase line and is transported to a host facility for processing. Wells may also be tied back individually as a satellite system. Dual lines provide for complete circuits and are used for pigging. Subsea separators have been used in some recent deepwater developments to separate the fluids at the manifold and transport liquid and gas in separate lines, but the technology is relatively new (and evolving) and untested.
3 Contract strategiesAfter the final investment decision for an offshore project is approved, the operator determines how best to combine, manage, and contract out the system components. Primary components typically include drilling, SURF, structure, topsides, and export systems.
For each component, Engineering, Procurement, Construction and Installation (EPCI) must be performed. Projects with multiple contractors and components require more operator involvement and interface management, but are considered to reduce cost overruns and price premiums. For the structure and topsides, for example, the operator typically lets contract for the following segments, which may be combined and awarded to one or more contractors:
● Design of the substructure
● Design of the deck
● Fabrication of structure
● Procurement of process equipment
● Fabrication of deck and topsides installation
● Installation of structure
● Offshore hookup
Sometimes, several functions are combined in design and construction contracts or alliances. Pipeline contracts are usually divided into segments such as:
● Design of the pipeline
● Procurement of pipe
● Coating of pipe
• Installation and trenching of pipe
In the GOM, pipelines are traditionally contracted using a fixed-price EPCI approach. The owner specifies the installation parameters and requirements, and then with limited involvement, reviews the contractor's plans and monitors their performance (Gallagher et al., 1994). The contractor develops the plans and procedures, and procures the necessary material, installation vessels and equipment, and also frequently commissions the system.
The traditional operator/contractor relationship for offshore construction is the EPCI lump-sum (“hard-dollar”) variety for each segment of field development except drilling, where the operator, either internally or using an outside engineering firm, generates a detailed bid specification document that includes scope of work, technical expertise, availability and commercial considerations. Qualifications and clarifications on each part of the job are specified and which entity is the responsible party. The contractor takes on risks it thinks it can manage and bids accordingly. The operator evaluates the bid on cost, past performance, safety, equipment status and related factors.
On some projects, depending on technical and managerial complexity, schedule constraints, environmental restrictions, or other factors, owners may prefer an execution strategy that allows greater involvement in work planning, equipment selection, work schedule and ability to make changes. In these cases, reimbursable contracts are often preferred. Reimbursable contracts allow the owner to assume most of the risk. In a fixed-price contract, risk is priced into the contract amount.
Operators have applied a variety of cost plus and other types of contracts that share risk with the contractor, but the details of contracts are rarely reported. In partnering arrangements, a non-bidding contractual approach, the operator and contractor determine a target number of days to complete its work scope using similar projects as benchmarks for time duration and dayrates. A contingency is added and the target number of days is used on an incentive basis. Partnering arrangements have been used in the GOM but not to the extent of EPCI contracts. Contracts that burden the contractor with greater risk will result in greater cost than contracts where the operator manages interfaces and accepts a higher portion of the risk and cost overruns.
4 Cost data 4.1 Data sourcesThe Offshore Technology Conference (OTC) and Society of Petroleum Engineers (SPE) publications represent primary sources of data on engineering, construction, hardware systems, installation techniques, project management, and contracting strategies utilized in field development. Operators often publish detailed project descriptions, especially for deepwater or capital intensive developments, to document learnings and outcomes and to discuss opportunities for improvement. In the 1980s and early 1990s, operators occasionally reported development cost for offshore projects, but after 2000, cost discussions have been much less frequent.
E & P companies also sometimes announce development cost for contracts via press release and in financial reports, and contractors and service providers sometimes describe awards won via press release and on their company website. Press release and annual report data is usually not as detailed or descriptive as OTC/SPE publications, but project scopes are frequently described, along with vessels and methods utilized or expected to be utilized, and centers where the engineering and fabrication occurred or are expected to occur. Since EPCI contracts are typically fixed-price lump-sum awards, useful data can frequently be inferred from press releases.
4.2 Unit costConstruction projects are identified as export systems, infield flowline systems, and combined export and infield systems. Unit cost for export and infield flowline systems is computed as follows:
| ${\text{Export systems: }}\frac{{{\text{Export pipeline cost}}}}{{{\text{Export pipeline mileage}}}}\\ {\text{Infield flowline systems}}:\frac{{{\text{Flowline cost}} + {\text{Umbilical cost}}}}{{{\text{Flowline mileage}} + {\text{Umbilical mileage}}}}$ |
Combined export and infield systems aggregate all the relevant cost and normalize by total mileage.
Pipeline mileage is considered additive regardless of line diameter, thickness or length, installation method, or water depth. For several projects, pipeline was installed using different methods, and the aggregate unit cost is the most representative cost statistic. Infield contracts typically include umbilicals, which may or may not be broken out separately from flowline cost, and if included with the system cost, are also included in mileage statistics.
Additional offshore work and system components are not considered and may be significant, but in most cases considered, represents a small contribution to total cost. For example, riser work may be included in the contract cost but do not appear in the denominator term unless explicitly described. PLETs, PLEMs, subsea sleds and jumpers, tie-in assemblies, flying leads, and other subsea components are also typically included in construction contracts but are not considered in evaluation.
4.3 Inflation adjustmentThe BLS Producer Price Index for steel pipes and tubes (WPU101706) and for oil and gas services (WPU60110401) were used to inflation-adjust cost to 2014 U.S. dollars. The steel pipe and tube index was used to inflate material cost, and the oil and gas services index was used for all other inflation adjustments. The year of contract award is used as the baseline year, and if not available, the year of installation or first production was used as a proxy.
From 1980 to 1995, the BLS indices increased at rates reflective of general inflationary trends in the U.S. economy, and both indices were relatively stable over the 1995–2003 period before increasing dramatically over the 2004–2008 period. Other indices could be used, but these indices were chosen because they are readily available over the period of analysis, and are expected to reasonably represent market changes.
4.4 LimitationsSystem descriptions in OTC/SPE publications are as-built at the time of installation/publication and do not represent current configurations. Most project descriptions do not include cost data, and therefore the assembled case studies represent industry publications where costs are reported and not a random selection of projects. For some projects, operators report cost across specific categories, while for other projects, operators only report total development cost or some other aggregate cost category. In other words, there is not a uniform reporting system. There is no reason to believe the projects are unusual in any significant way (i.e., best-of-class, worst case, etc.), and the cost reported are considered representative with the limitations previously noted. Sample sizes do not permit differences among operators or contract type to be distinguished.
Contract values may be reported in press release announcements, but there is frequent ambiguity on what is or is not reported in the project scope, and if a clear delineation is not possible, the data was not applied. The trade press and other organizations repeat or paraphrase press release announcements, frequently introducing errors in the account. Most press releases do not provide cost data, and contract terms and conditions are never discussed in detail. Besides pipeline, contracts typically include PLETs, PLEMs, in-line assemblies, and related appurtenances, and may or may not include risers and umbilicals. It is usually not possible to separate component cost, and thus by default, they are incorporated in the assessment and may bias the unit cost statistics.
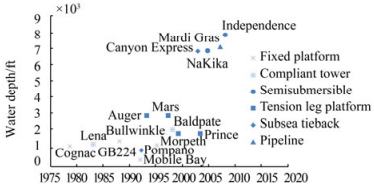
5 Construction cost summary 5.1 OTC/SPE dataOTC/SPE publications report cost data for 25 projects in the U.S. GOM from 1978–2014 (Table 1; Fig. 1). These projects include 10 oil and gas export pipelines, 13 infield flowlines, and two export/infield systems. All of the projects except Mobile Bay describe deepwater pipelines in water depths greater than 1 000 ft. For some projects, subsea system data was reported separately. The data collected is believed to represent the majority of publicly available cost data reported in OTC/SPE publications.
| Project | Year | Description | Type | $MM/mi | Source |
| Cognac | 1979 | 27.5 mi, 12 inch two phase | Export | 5.02 | Nations and Speice, 1982 |
| Lena | 1983 | 16 mi, 10 inch gas 16 mi, 12 inch oil | Export | 2.05 | Boening and Howell, 1984 |
| Bullwinkle | 1987 | Infield/Export | 2.19 | Sterling et al., 1989 | |
| Mobile Bay | 1991 | 200 mi, 6/24 inch flowline | Infield | 3.38 | Johnson et al., 1994 |
| Jolliet | 1992 | 12 mi, 8/10 inch flexible 12 mi, 4 inch oil, gas 29 mi, 12 inch oil | Export | 1.55 | Koon and Langewis, 1990; Tillinghast, 1990 |
| GB 224 | 1992 | 14.5 mi, 4 inch flexible | Infield | 0.52 | Cooke and Cain, 1992 |
| GB 224 | 1992 | 14.5 mi, 4 inch umbilicals | Infield | 0.66 | Cooke and Cain, 1992 |
| Auger | 1993 | 72 mi, 12.75 inch oil 36 mi, 12.75 inch gas | Export | 1.24 | Kopp and Barry, 1994 |
| Macaroni | 1999 | 12 mi flowline | Infield | 12.94 | Kopp and Barry, 1994 |
| Serrano | 2001 | 6 inch×10 inch pipe-in-pipe | Infield | 2.45 | Kopp and Barry, 1994 |
| Oregano | 2001 | 6 inch×10 inch pipe-in-pipe | Infield | 3.36 | Kopp and Barry, 1994 |
| Pompano | 1996 | Two 4.5 mi, 8 inch flowlines Two 4.5 mi, 3 inch test lines | Infield | 2.59 | Clarke and Cordner, 1996 |
| Mars | 1997 | 43 mi, 18 inch oil 79 mi, 24 inch oil 43 mi, 14 inch gas | Export | 1.19 | Godfrey et al., 1997 |
| Baldpate | 1998 | 17 mi, 16 inch oil 13.2 mi, 12 inch gas | Export | 0.72 | Simon et al., 1999 |
| Morpeth | 1997 | 19 mi, 12 inch oil 19 mi, 8 inch gas | Export | 1.98 | Kennefick et al., 1999 |
| Morpeth | 1997 | 2.3 mi, 4 inch flowlines 1.3 mi umbilical | Infield | 5.76 | Kennefick et al., 1999 |
| Prince | 2001 | 10 mi, 10 inch oil 16 mi, 12 inch gas | Export | 1.29 | Koon et al., 2002 |
| Canyon Express | 2002 | 2×56 mi, 12 inch flowlines | Infield | 3.65 | Rijkens et al., 2003 |
| NaKika | 2004 | 100 mi 8/12 inch flowlines 74 mi, 18 inch oil 74 mi, 20/24 inch gas | Infield/Export | 1.98 | Kopp et al., 2004 |
| Mardi Gras | 2003 | 489 mi, 20 to 30 inch | Export | 2.11 | Marshall and McDonald, 2004 |
| Independence | 2007 | 134 mi, 24 inch gas | Export | 2.24 | Holley and Abendschein, 2007 |
| Independence | 2007 | 210 mi flowline 135 mi umbilicals | Infield | 1.12 | Holley and Abendschein, 2007 |
| Spiderman | 2007 | 56 mi, 9 inch flowline | Infield | 2.34 | Vercher and Blakeley, 2007 |
| Spiderman | 2007 | 25 mi, 8 inch flowline | Infield | 3.97 | Vercher and Blakeley, 2007 |
| Spiderman | 2007 | 22 mi, 10 inch flowline | Infield | 2.75 | Vercher and Blakeley, 2007 |
|
| Figure 1 Gulf of Mexico pipeline projects with cost data reported |
Most installations reporting cost data were constructed from 1990 to 2005, with three projects reported before 1990 and five projects after 2005. Independence Hub represents the deepest pipeline project in the sample with a maximum water depth of about 8 000 ft, Mardi Gras was the longest installed line at 489 miles, and Morpeth the shortest flowline at about 2 miles.
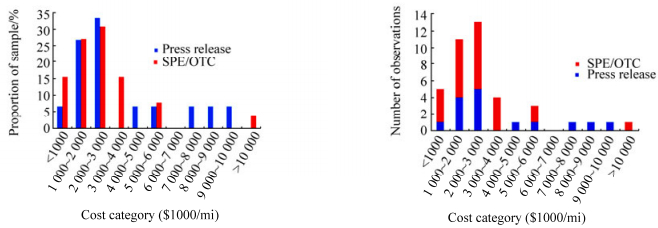
The average aggregate all-in cost for pipeline projects was $2.76 million/mi and ranged from $520 000/mi to $12.94 million/mi. High cost pipelines tend to be short segments or specialized pipeline. Excluding the two project endpoints, the majority of costs ranged from $1 to $6 million/mi. Export and export/infield projects cost about $2 million/mi and infield flowline projects cost about $3.5 million/mi (Table 2). Standard deviations are on-the-order of the mean indicating significant variation within each category representing the multiple factors that impact construction cost, only some of which are observable. Larger samples are unlikely to reduce the data spread because the factors that impact construction cost are so varied. Infield flowlines cost almost twice as much as export pipelines, and the cost distributions appear approximately log-normal (Fig. 2).
| System | OTC/SPE | Press release | All | |
| Project type | Export | 1.96 (1.17) | 3.79 (2.66) | 2.67 (2.02) |
| Infield | 3.50 (3.17) | 3.84 (3.53) | 3.61 (3.19) | |
| Export/Infield | 1.98 (NA) | 2.80 (1.82) | 2.53 (1.37) | |
| All | 2.76 (2.49) | 3.68 (2.80) | 3.11 (2.61) | |
| Period | 1979–1989 | 3 | 0 | 3 |
| 1990–2005 | 17 | 6 | 23 | |
| 2005–2015 | 5 | 10 | 15 | |
| Note: USD 2014. Standard deviation denoted in parenthesis. | ||||
|
| Figure 2 Inflation-adjusted OTC/SPE and press release cost distribution (2014$) |
Press release data reported for 16 projects in the U.S. GOM from 1998 to 2015 were assembled (Table 3). Cameron Highway was the longest pipeline in the sample at 390 miles, and several projects exceeded 100 miles (Ursa, Keathley Canyon, Delta House, Gunflint, Walker Ridge). The shortest pipeline was less than 10 miles, and along with systems in greater water depth, tended to characterize high unit cost construction. Both export and infield networks were equally represented and there were two export/infield contracts. All projects are deepwater and utilized a breadth of contractors, including Allseas, EMAS, Enbridge, McDermott, Subsea 7 and Technip. All contracts were EPCI.
| Project | Year | Contractor | Description | Type | $MM/mi |
| Ursa | 1998 | Allseas | 18 inch, 47 mi oil 20 inch, 47 mi gas | Export | 1.45 |
| Brutus | 2002 | McDermott | 20 inch, 26 mi oil 20 inch 24 mi gas | Export | 2.46 |
| Falcon | 2002 | Technip-Coflexip | 32 mi, 10 inch flowline and umbilical | Infield | 0.80 |
| TH/Atlantis | 2002 | Subsea 7 | 63 miles of umbilicals, flying leads and jumpers | Infield | 0.70a |
| Cameron Highway | 2003 | Valero | 390 mi oil | Export | 1.73 |
| Glider | 2003 | Subsea 7 | 6 inch, 6 mi flowlines | Infield | 10.0 |
| Cascade/Chinook | 2008 | Technip | 5 risers, 74 mi, 6/9 inch reeled pipeline | Export/Infield | 4.09 |
| Droshky | 2008 | Subsea 7 | 8 inch, 36 mi flowline | Infield | 1.26 |
| Big Foot | 2009 | Enbridge | 20 inch, 40 mi oil | Export | 7.05 |
| Keathley Canyon | 2013 | Allseas | 20 inch, 215 mi | Export | 2.81 |
| Delta House | 2013 | Technip | 124 miles of infield and export lines | Export/Infield | 1.51 |
| Gunflint | 2014 | EMAS | 80 mi pipe-in-pipe, 56 mi umbilicals | Infield | 2.20 |
| Julia | 2014 | Technip | 30 mi insulated flowlines, risers, PLETs | Infield | 6.0 |
| Shell | 2014 | Subsea 7 | 27 miles of 8 inch flowlines, SCR and PLETs | Infield | 2.77 |
| Walker Ridge | 2015 | Enbridge | 8 and 10 inch, 170 miles gas | Export | 2.94 |
| Stampede | 2015 | Enbridge | 18 inch, 16 mi oil | Export | 8.10 |
| Note: (a) Installation only | |||||
Press release data yield an average aggregate cost of $3.68 million/mi with a range of $800 000 to $10.0 million/mi (Table 2). Export pipeline and infield flowline system cost were reported at about $3.8 million/mi with a standard deviation of the same order-of-magnitude, which and approximately matched the OTC/SPE infield cost data. Export unit costs were greater in part due to a greater number of more recent projects reviewed. Similar to OTC/SPE projects, the distribution of the press release cost data was approximately lognormal (Fig. 2).
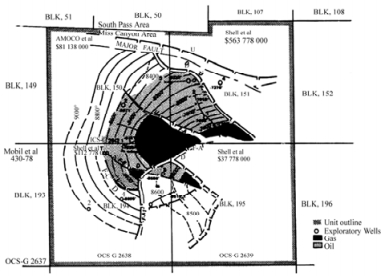
6 OTC/SPE case study descriptions 6.1 CognacCognac was the Gulf's first platform installed in water depth greater than 1 000 ft, and its final investment decision was based upon resource estimates of 100 MMbbl of oil and condensate and 500 Bcf of gas (Nations and Speice, 1982). Drilling utilized a simultaneous two rig program with a number of high-angle wells and water injection wells. After 3 years of rig operations, 61 wells were drilled and 36 wells were completed in 11 reservoirs (Fig. 3).
|
| Figure 3 Reservoir structure map of the Cognac field (Nations and Speice, 1982) |
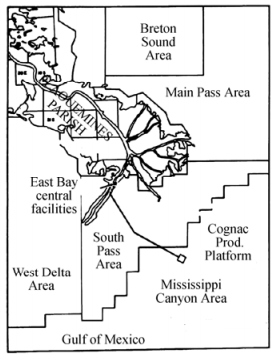
A 27.5 mile 12 inch two-phase export line was installed in 1979 by McDermott's lay barge LB29 and achieved an average lay rate of 1.3 miles per day (Fig. 4). Four miles of onshore pipeline was installed using the pull-method after a ditch along the route was prepared (Langner and Wilkinson, 1980). A spud barge laid pipe from the shoreline to the 20 ft depth corridor and the pipeline was trenched from shore to 200 ft water depth and included sandbagging operations. In 1981, a 16 inch diameter gas line was installed, and the 12 inch line reverted to a single phase crude oil line. Total development cost was reported at $800 million with the platform cost at $265 million. Total lease cost was $295 million. Pipeline material and installation cost was estimated at $56 million, or $2.0 million/mi.
|
| Figure 4 Cognac's export pipeline at initial development utilized a single two-phase 12 inch pipeline (Nations and Speice, 1982) |
In 1983, Exxon installed the first guyed tower at the Lena prospect in 1 000 ft water depth after extensive experimental testing of the concept (Boening and Howell, 1984). A guyed tower is different from a fixed platform because they have nearly constant cross-section throughout the water column and require guy lines to secure to the seabed (Fig. 5). Guyed towers are designed to flex with the forces of waves, wind and current, and is held in place by a symmetric array of catenary guylines. The guylines have several segments, the upper part is a lead cable, which acts as a stiff spring in moderate seas, and the lower portion is a heavy chain with clump weights, which are lifted off of the bottom during heavy seas and behaves as a soft spring.

|
| Figure 5 Principal features of the Lena guyed tower (Maus et al., 1985) |
Lena's guyed tower supports 58 conductors and five J-tubes for risers. Procurement was done by competitive lump-sum bidding, except for the tower installation, which was bid on labor and equipment dayrates. A three-level deck is supported by a 1 079 ft jacket, 120 ft square cross-section from the mudline, and 20 symmetrically spaced, 5 inch diameter guylines that extend to the seafloor in a circular pattern that is over 6 000 ft in diameter.
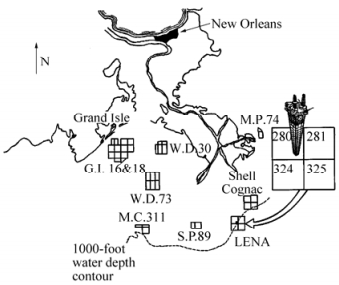
Two pipelines, a 10 inch gas line and a 12 inch crude oil line, were laid along parallel routes approximately 16 miles west to Exxon's South Pass 89A platform (Fig. 6). The Exxon Pipeline Company installed the crude oil line and Exxon Company USA, the operator of the field, laid the gas line (Smetak et al., 1984). A DP reel ship, the Apache, installed the two lines, allowing 10 miles of pipe to be made up and spooled onto an 82-foot diameter reel. Total development cost for Lena was $340 million. Pipeline material and installation cost was estimated at $34 million, or $944 000/mi.
|
| Figure 6 ExxonMobil's guyed tower Lena at Mississippi Canyon block 280 (Boening and Howell, 1984) |
In May 1983, Shell acquired Green Canyon blocks 65 and 109 for $30.1 million during the lease auction, and later acquired GC 64 for $4.4 million (Sterling et al., 1989). The discovery well was drilled in October 1983 in GC 65, and a total of four wells and four sidetracks were drilled to evaluate and delineate the reservoir.
A fixed drilling and production platform with 60 well slots in approximately 1 350 ft water depth was selected for the development of the project named Bullwinkle, and after five years to design and build, was installed in 1988, the largest free-standing structure in the world at the time (Fig. 7). Development cost was reported at $500 million, about half of which was spent to build and install the platform, and the other half spent for development drilling, production facilities, and a pipeline system. The export system was estimated to cost $25 million, or about $1 million/mi.

|
| Figure 7 The Bullwinkle platform (Digre et al., 1989) |
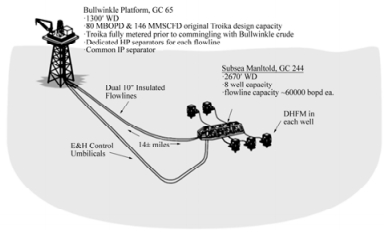
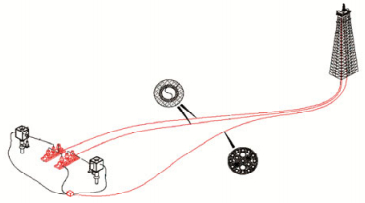
Rocky was the first tieback in 1996 using two three inch pipe-in-pipe flowlines about 4 miles away and was the first reeled pipe-in-pipe in the Gulf (Hoose et al., 1996). Angus was developed in 1999 in 2 000 ft water depth using three subsea wells (Schneider, 2001). Troika is located in GC 200 in 2 700 ft water depth about 14 miles away (Fig. 8), where comingled flow from five wells were produced through two 10 inch pipe-in-pipe insulated flowlines towed from a shore base in Texas (Beckmann et al., 1998). During the second phase of development from 2000 to 2001, two additional wells were drilled at Troika to develop shallower reservoirs (Gillespie et al., 2005). Aspen began production in 2002 in 3050 ft water depth in GC 243 (Fig. 9), through dual 16 mile flowlines with hydrates managed by methanol injection (Meng et al., 2011).
|
| Figure 8 The Troika manifold production system and layout (Berger et al., 2001) |
|
| Figure 9 Aspen field tieback and layout (Meng et al. 2011) |
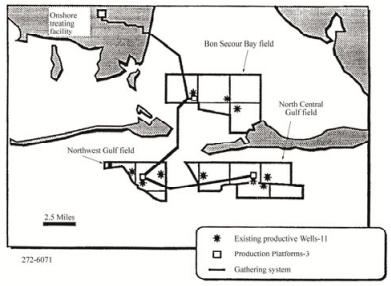
The Mobile Bay project is located in Alabama state waters and adjacent federal waters in 12 to 50 ft water depth (Fig. 10). The development area is transected by a shipping fairway serving the Port of Mobil. Twelve state and five federal leases covering 61 000 acre were acquired in 1981–1984 for bonuses totaling $400 million, and discoveries include the Bon Secour Bay (BSB) field lying inside Mobile Bay, the North Central Gulf (NCG) field located on state and federal waters, and the Northwest Gulf (NWG) area.
|
| Figure 10 Location of the Mobile Bay project fields in state and federal waters (Gallagher et al., 1994) |
An 11 well, three field development utilized three offshore platforms pipelined to a 300 million cubic feet per day (MMcfd) onshore treating facility. Each field has a central production platform, sized at 100 MMcfd for BSB and NCG, and 200 MMcfd for NWG. The platforms provide manifolding, separation, metering and dehydration functions, and collect production from wells located on templates adjacent to the platform. The $1 billion project was designed to produce at least 1 Tcf of gas for over 30 years.
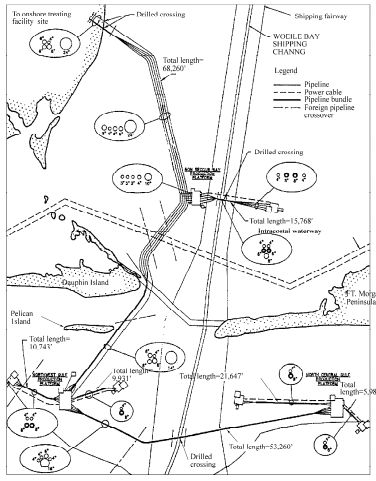
High pressure, high temperature reservoirs and the presence of up to ten percent hydrogen sulfide, four percent carbon dioxide, and highly saline formation water makes the produced fluids extremely corrosive to carbon steel necessitating the use of a corrosion resistant alloy from the perforations to the production platform. The pipeline system consisted of 200 miles of alloy and steel lines, interconnecting three offshore platforms and five subsea templates. The 35 mile gathering system consists of five separate carbon steel pipelines ranging in diameter from 6 inch to 24 inch (Fig. 11). Corrosive HPHT gas is transported from the templates via insulated pipe-in-pipe nickel alloy flowlines. A five line carbon steel gathering system connects the onshore treatment plant to the production platforms, and is used to transport diesel, fuel gas, produced gas, produced liquids, and dilution water. Fresh water and diesel injection is provided by the platform to dilute the formation water to prevent scale deposition and diamondoid deposition downstream of the well (Fig. 12). Produced liquids, including diamondoid-lade diesel, are pipelined to shore. Sweet fuel gas, fresh diesel, and fresh dilution water are pipelined from shore to the platforms.
|
| Figure 11 Detailed view of the pipeline network of the Mobile Bay project (Arthur et al., 1994) |

|
| Figure 12 Offshore production facilities flow schematic at the Mobile Bay project (Johnson et al., 1994) |
The pipeline system required four feet of cover depth, crossing two channels, five pipelines, and a dynamic sandbar with significant variation of soil types along the route. Inside the bay, conventional jetting methods were not employed because of minimum turbidity requirements and dredging volume limitations. Installation was phased over three construction seasons starting in 1991 and several variations of reimbursable type contracts were used. The jackets were installed using dayrate contracts for the derrick barge, most pipeline work was done under a reimbursable contract with a fixed fee, and hookup used a time and material rate basis (Gallagher et al., 1994). Pipeline material was procured for $80 million (Arthur et al., 1994), and installation costs were estimated at $100 million, for a total cost approximately $1.80 million/mi.
6.5 JollietThe Jolliet field in Green Canyon block 84 was discovered in 1987 in 1 760 ft water depth and became the Gulf's first Tension Leg Platform (TLP) installation (Koon and Langewis, 1990). A TLP is a floating structure that is vertically moored by taut mooring lines called tendons. The structure is vertically restrained precluding vertical (heave) and rotational (pitch and roll) motions. TLPs are compliant in the horizontal direction permitting lateral motions (surge and sway).
Field development consisted of 20 production wells, a Central Production Platform (CPP) in Green Canyon block 52 in 616 ft water depth, an adjacent drilling platform in GC 52 (52A) which is bridge connected to the CPP as part of the Marquette project, and field and export pipelines for oil and gas. Jolliet pipelines consist of 1) sales oil and gas lines from the CPP to tie-in points outside the Green Canyon area; 2) two flexible pipelines that run from the TLP to a connection skid approximately midway to the CPP, and 3) rigid pipelines that tie-into the skid and continue to the CPP.
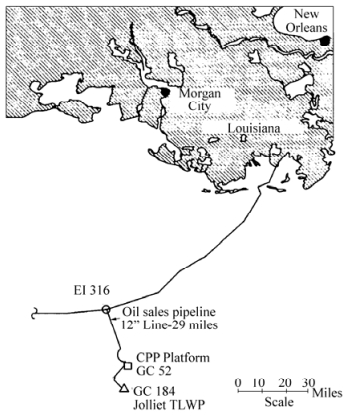
Flexible pipelines 8 and 10 inch in diameter run about 6 miles from the TLP to the skid in 1 080 ft water depth, and then the next 6 miles to the CPP using 4 inch rigid pipeline. Both the oil and gas lines are designed to be pigged. Sales oil leaving the CPP flows through about 29 miles of 12 inch pipeline to a subsea tie-in with the Eugene Island pipeline system at EI 316 (Fig. 13). The oil sales pipeline incorporated three in-line lateral (tap) valve assemblies and a lateral tie-in assembly spool piece. Sales quality gas flows through a 16 inch, 20 mile long pipeline from the CPP to a facility at SM 174, and another 24 miles through a 20 inch pipeline to SM 106 (Fig. 14).
|
| Figure 13 Jolliet oil sales pipeline system (Tillinghast, 1990) |

|
| Figure 14 Jolliet gas sales pipeline system (Tillinghast, 1990) |
The pipeline project included 12 miles of flexible pipeline and risers, a subsea connection skid, and 42 miles of rigid pipeline (Tillinghast, 1990). Design and installation of the gas sales pipeline was performed by a gas transmission company and was not part of the field development cost. The flexible pipe was reeled and the conventional pipe was S-laid. Total pipeline installation and procurement cost was reported as $43 million, or about $796 000/mile.
6.6 GB 224SantéFe Minerals Inc. purchased Garden Banks block 224 in August 1983 and an exploration well drilled to 16 000 ft measured depth found two productive sands with recoverable reserves estimated at 36 Bcf (Cooke and Cain, 1992). A single subsea completion tied back to Oryx Energy's High Island 384A platform 14.5 miles away was determined the best development strategy for the marginal reservoir (Fig. 15). Multiplexed electro-hydraulic control umbilicals and a 4 inch flexible pipe system was installed using a DP lay vessel. Two major coral outcrops and fault scarps were avoided in routing. The total development cost of the pipeline system was $18.6 million, with the flowline, risers and tie-in work costing $3.9 million, or about $271 000/mi. The umbilical line and installation cost $4.9 million, or about $338 000/mi.

|
| Figure 15 GB 224 flowline route to host platform in High Island (Cooke and Cain, 1992) |
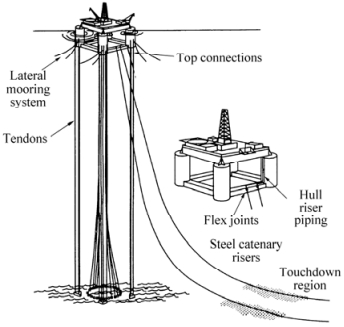
Auger was the second TLP installed in the GOM and the first of several TLPs installed by Shell (Fig. 16). Auger is located in Garden Banks block 426 in 2 864 ft water depth and cost $1.2 billion in development. Approximately 65% of capital expenditures was spent for the fabrication and installation of the hull, deck, facilities, drilling rig, and pipelines (Bourgeois, 1994). The remaining 35% was spent for drilling and completion operations for 21 wells. Auger later served as host for several subsea tiebacks (Habanero, Llano, Macaroni, Oregano, Serrano, Ozona, Cardamon).
|
| Figure 16 Auger tension leg platform components and steel catenary risers (Kopp and Barry, 1994) |
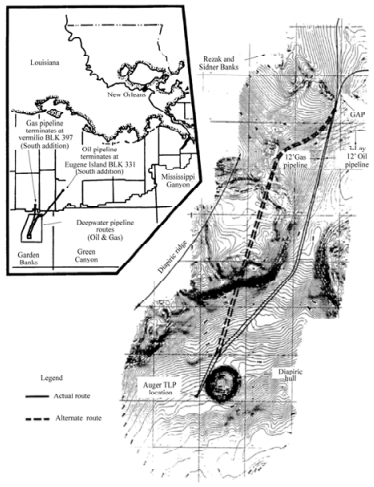
Auger's oil pipeline is a 12.75 inch 72 mile line that runs to a fixed platform in Eugene Island South Addition block 331 in 250 ft water depth (Fig. 17). The gas pipeline is a 12.75 inch line that runs 36 miles to a fixed platform in Vermillion block 397. Construction was broken into two phases and bid separately. The shallow water sections of the two lines were installed using the S-lay technique in 1992, and in 1993 the deeper water sections were installed using the J-lay technique (Kopp and Barry, 1994). This was the first pipeline J-lay in the GOM, and on the best day, 1.9 miles of line was installed. During S-lay, a distance of 2.3 miles was achieved on the best day.
|
| Figure 17 The Auger pipeline routes (Kopp and Barry, 1994) |
Pipeline construction cost $69 million, or about $639000/mi. In 1999, Macaroni was developed in 3 700 ft water about 12 miles away as a subsea tieback, and flowline cost was estimated at $7.2 million/mi. Serrano and Oregano's estimated material and installation cost for 6 inch by 10 inch pipe-in-pipe electrically heated flowlines installed in 2001 was $1.7 million/mi and $2.4 million/mi, respectively.
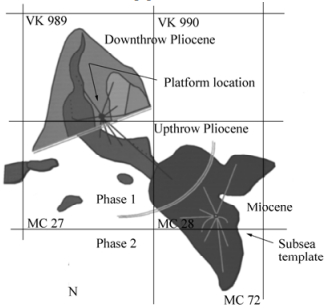
6.8 PompanoThe Pompano field was discovered in 1985 and extends over five lease blocks in water depths from 1 110 to 2 220 ft in the Viosca Knoll and Mississippi Canyon area (Fig. 18). BP and Kerr McGee developed the field with a 40 slot fixed platform and a 10 slot subsea production template/manifold (Clarke and Cordner, 1996). The reservoirs consist of turbidite sands in a variety of traps and settings, and the key structural features of the field are a salt dome with overhang and a large growth fault (Wilson et al., 2003).
|
| Figure 18 Map view of Pompano field (Clarke and Cordner, 1996) |
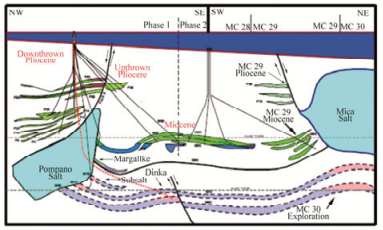
Development employed a phased approach. In Phase Ⅰ, 10 wells were pre-drilled in 1992–1993, and a 40-slot fixed platform in 1 290 ft was installed in August 1994. After completing the 10 pre-drilled wells, first oil was achieved in October 1994. In total, 25 wells were drilled both sub-salt and extra-salt. In Phase Ⅱ, a 10-slot subsea template was installed in August 1995 near the MC 28/72 block boundary (Fig. 19). The template is in 1 865 ft water depth 4.5 miles southeast of the VK 989 platform. Ten Miocene wells were drilled from the template and first oil was in May 1996.
|
| Figure 19 Pompano phase two development and stylized cross section (Kleinhans and Cordner, 1997) |
Surface facilities provide for well control through the flowline, well servicing, and chemical injection connected to the template by two 8 inch production flowlines, two 3 inch service/test flowlines, hydraulic/chemical and electrical umbilicals. The four flowlines allow the system to operate at different pressures, flow rates, and flow regimes. Phase Ⅱ development cost was reported at $95 million excluding drilling cost. Flowlines and umbilicals cost $25 million, or about $1.38 million per mile (Kleinhans and Cordner, 1997).
In 2005, the Mica field was tied back to Pompano via two 29 mile flowlines, and there was a significant elevation change back to the host (Fig. 20). Mica reservoirs are located in 4350 ft of water and consist of three separate zones, the shallowest of which is an oil zone with saturated gas and GOR of 1 330 cf/bbl and 32° API gravity (Ballard, 2006). The middle zone is a near-critical fluid with a GOR > 3 000 cf/bbl, 37° API gravity, and a wax cloud point of 90–94 °F. The deepest zone is dry gas with a condensate ratio of 5 bbl/MMcf and 44° API gravity. A four slot manifold was built with two initial wells that included two flowlines with a pigging loop. The oil flowline is an 8 inch by 12 inch pipe-in-pipe insulated pipe and the gas flowline is an 8 inch uninsulated pipe.

|
| Figure 20 Topography of the seafloor between Mica and Pompano (Ballard, 2006) |
The Mars field was discovered by Shell in 1989 and production began from a 24 slot TLP in 1996. Mars was Shell's second TLP installed in the GOM and incorporated lessons learned from Auger. An overlapping design/build risk-sharing approach reduced schedule time but led to increased cost uncertainty compared to the conventional lump sum, fixed price contracting (Godfrey et al., 1997). Pipeline installation was divided into a conventional lump sum approach for S-lay of the shallow water portion and a negotiated approach for the deepwater J-lay portion of the route (Haney et al., 1997).
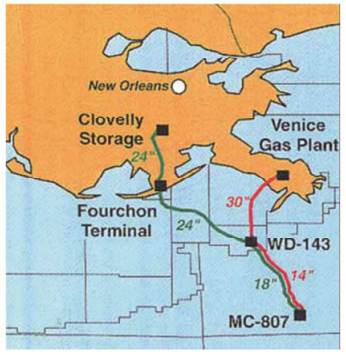
Oil is exported via an 18 inch, 43 mi pipeline to a platform hub in West Delta 143 in 393 ft of water, and a 24 inch, 79 mi line from WD 143 to a dedicated 3 million barrel capacity storage cavern located at the LOOP complex at Clovelly, Louisiana (Fig. 21). Gas transportation is via a 14 inch line adjacent to the 18 inch line to WD 143 and then onward to the Venice gas plant. Total cost for procurement and installation of the pipeline system and steel catenary risers was $160 million and completed by McDermott in 1996. Unit cost was $660 000/mi.
|
| Figure 21 Mars oil and gas export pipeline routes |
In 1995, the Europa field was discovered in MC 934 in 3980 ft water depth, about 20 miles away from the Mars TLP (Lamey et al., 1999). A subsea tieback was selected using four initial wells, and topside facilities at Mars were expanded to 200 Mbopd, 191 MMcfpd, and 25 Mbwpd. Wells produce to a common subsea manifold and are commingled into an 8 inch by 12 inch diameter dual pipe-in-pipe insulated flowline.
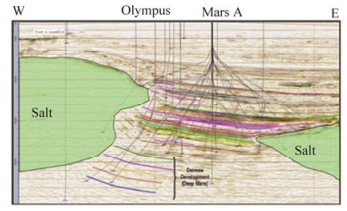
In September 2010, the Mars development was expanded with a new 24-slot TLP structure, Olympus, and additional subsea infrastructure for the West Boreas/South Deimos fields which were discovered below the original Mars production intervals (Fig. 22). Olympus was installed in 2014 about a mile away from the Mars TLP and commenced production later in the year (Grant et al., 2014).
|
| Figure 22 Seismic cross section of the Mars and Deimos reservoirs (Grant et al., 2014) |
Baldpate was the first free-standing, non-guyed compliant tower installed in the Gulf (Simon et al., 1999). A compliant tower is similar to a traditional platform but is designed to flex with the forces of waves, wind and current like a guyed tower. Compliant towers are free standing, constant cross-section structures and use less steel than a conventional platform. The discovery well was drilled in 1991 by Diamond Offshore's Ocean Rover, and after delineation the project was sanctioned in November 1995 with a budget of $320 million. Installation was completed in 1998 in Garden Banks block 260 in 1 648 ft water depth by Amerada Hess and Oryx Energy Company.
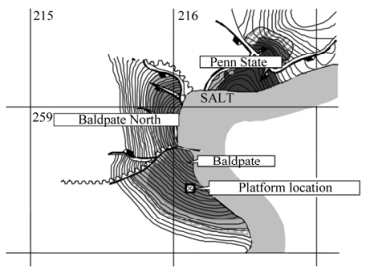
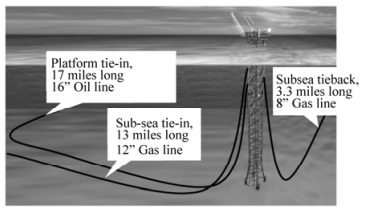
The reservoirs consist of sheet-type sands, and were expected to result in a uniform drainage pattern through three initial wells in each of the two main sands (Baldpate, Baldpate North), and a seventh well in the Penn State reservoir (Fig. 23). Production facilities were built for 60 Mbopd and 200 MMcfpd using a 19 slot drilling/production platform. Gas is exported via a 12 inch pipeline connecting subsea to Shell's Garden Banks pipeline 13.2 miles away; oil is exported via a 16 inch, 17 mile pipeline connecting to the Poseidon system on the SMI 205A platform; and a bundled-flowline catenary riser imports production from the Penn State reservoir 3.3 miles away (Fig. 24).
|
| Figure 23 Baldpate, Baldpate North and Penn State reservoirs abut a salt diapir (Simon et al., 1999) |
|
| Figure 24 Export pipelines and a subsea tieback in the Baldpate development (Simon et al., 1999) |
Development cost of Baldpate was $332 million, with $215 million for the tower, facilities and pipelines, and $117 million for development drilling and completions. Total pipeline cost was reported at $13.4 million, or approximately $402 000/mi.
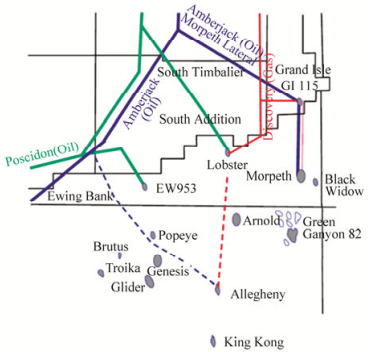
6.11 MorpethThe Morpeth field is located in the Ewing Bank area in 1670 ft of water (Fig. 25). Development was based on tying back three subsea production wells and one water injection well to a mono-column (mini) TLP designed to process 35 Mbopd and 42 MMcfpd (Roach et al., 1999). The wells are located approximately 1 500 ft from the TLP and are tied back via 4-inch insulated flexible flowlines which allow pigging (Fig. 26). Seawater is utilized for water injection to maintain reservoir pressure.
|
| Figure 25 Morpeth field location (Roach et al., 1999) |

|
| Figure 26 Morpeth field layout (Roach et al., 1999) |
The oil and gas pipelines are 12 and 8 inch diameter which exit the TLP via steel catenary risers and connect to Discovery's GI 115 platform located about 19 miles to the north. The gas pipeline is owned and operated by a third party and the oil pipeline is owned by the operator and tied into the Amberjack system. McDermott's DB28 laid the first sections of each export line in summer 1997 using S-lay, and in the summer of 1998 completed the installation using its DB50 in J-lay configuration (Kennefick et al., 1999).
British-Borneo defined the functionality and operability goals of the system and contracted out the design, fabrication, procurement, and inspection of the TLP hull, mooring systems, topside facilities and project management to Atlantia Offshore Limited on a cost reimbursable plus fixed fee basis. A subsidiary of McDermott designed the subsea systems, flowlines and pipelines, and McDermott was responsible for all installations, including the subsea systems, flowlines, piling, tendons, hull, topsides and export pipelines. The installation contract was a fixed lump sum with the exception of the pipeline materials and umbilicals which were procured on a cost-plus basis. Flowlines, umbilicals and their installation cost $11.2 million, or about $3.2 million/mile. Export pipeline materials and installation cost $20.6 million, or about $1.1 million/mi.
6.12 PrinceThe Prince field is located in Ewing Bank blocks 958, 959, and 1003, and represented the first business arrangement in the Gulf whereby pipeline companies began to own deepwater platforms as portals for their pipeline infrastructure (Koon et al., 2002). A Moses TLP with 50 Mbopd and 80 MMcfpd processing capacity was employed using 4 pre-drilled wells tied back via top tension risers to dry trees. A 10 inch oil export line interconnects subsea with the Poseidon pipeline 10 miles away in EB 873, and a 16 mile, 12 inch gas export line connects with the Manta Ray system on the ST 292 platform.
The working interest owner in the Prince field, El Paso Production GOM, entered into an agreement with its parent El Paso Energy Partners in 2000 to own, operate, construct and install the TLP and export pipelines and receive compensation through demand charges and processing fees. Total cost of the Prince TLP, including hull, mooring and topsides, was approximately $120 million. The export pipelines cost approximately $24 million, or about $923 000/mi.
6.13 Canyon ExpressThe Canyon Express field is a development consisting of multiple subsea gas-condensate wells in water depths ranging from 6 400 to 7 250 ft owned by different companies. Each deepwater well flows into one of two 57 mile, 12 inch flowlines which tie the wells to a shallow water host platform (Fig. 27).

|
| Figure 27 Canyon Express field schematic and methanol distribution system (Cooley et al., 2003) |
Three neighboring and moderate size gas discoveries were made in the Mississippi and Desoto Canyon areas but were owned by different companies, and the individual field reserves were too small (about 50 MMboe each) and too far away to existing facilities for individual development (Rijkens et al., 2003). A business structure was negotiated to share the subsea system infrastructure (common flowlines and control system) development cost, while the field operators retained the risk and responsibility for the wells.
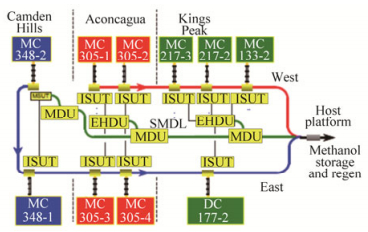
The Canyon Express transportation system consists of two 12 inch uninsulated flowlines running parallel from Camden Hills (Marathon Oil operated) through Aconcagua (Total E & P USA operated) and Kings Peak (BP operated) to a host platform (Williams operated Canyon Station) located in block MP 261 approximately 40 miles north of the northernmost Kings Peak well. Production from each well is predominately methane gas but also consists of produced water and condensate. Due to the combination of high pressures and low temperatures expected, the potential for hydrate formation was a concern, and a hydrate inhibitor (methanol) was employed to maintain system operability (Fig. 28).
|
| Figure 28 Canyon Express methanol distribution system (Rijkens et al., 2003) |
The subsea system is divided into the Canyon Express common system and the infield systems for each of the three fields. The common system includes the 12 inch flowlines with appendices and risers, the main umbilical and methanol line, and master control station on the platform. The infield system involves everything required to hook-up the fields to the common system. The common system is owned jointly while the infield system is owned by the field owners.
Saipem designed, fabricated, and installed the 10 in-line sleds and two end-of-line sleds. SaiBOS was used for the deepwater work (DeReals et al., 2003). Shallow water work was performed with EMC's Castoro 10. Total project costs including wells was about $650 million, and the subsea infrastructure for the common system cost $280 million, or about $2.5 million/mi. First gas for Canyon Express occurred in October 2002. Various problems with the methanol system were encountered and subsequently addressed (Cooley et al., 2003).
6.14 NaKikaThe NaKika development consists of six oil and gas fields in the Mississippi Canyon area spread out about 25 miles east-to-west and 27 miles north-to-south (Kopp et al., 2004). The fields are named Ariel, Kepler, Fourier, Herschel, East Anstey and Coulomb and range in water depths from 6 000 to 7 600 ft.
A semisubmersible located roughly in the center of the development area serves as the receiving host (Hudson et al., 2002). Semisubmersibles are neutrally buoyant multilegged structures with a large deck and have appreciable motions, and wells are typically completed subsea and connected to the unit with flexible risers. Early semis resemble the ship form with twin pontoons having a bow and stern, and the second generation are typically square with four columns and box-or cylinder-shaped pontoons connecting the columns.
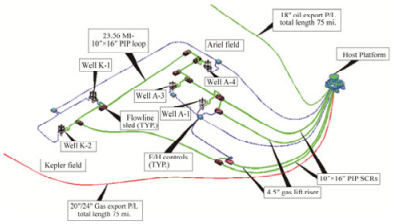
The subsea layout consists of a single 10 inch by 16 inch pipe-in-pipe flowline loop for fields north of the host, Ariel and Kepler (Fig. 29), and on the south side, there are two flowline loops, an 8 inch by 12 inch pipe-in-pipe insulated oil loop for Hershel and Fourier, and an 8 inch uninsulated gas loop for East Anstey and Fourier (Fig. 30). The Coulomb gas field was developed using a single flowline. A total of 12 subsea wells were used in initial development. Flow assurance provided key drivers to subsea system selection and was considered an important aspect of project profitability.
|
| Figure 29 NaKika north side layout and the Ariel and Kepler field tiebacks (Hudson et al., 2002) |

|
| Figure 30 NaKikia south side layout and the East Anstey, Fourier, and Herschel tie-backs (Hudson et al., 2002) |
The flowline system involved a total of 100 miles of pipe-in-pipe installation, an electric-heating-ready hydrate remediation system, and a gas lift riser system. The flowlines and risers were installed using the reel and J-lay method. No manifolds were required, but 23 sleds were used along with steel catenary risers. The export systems included a 74 mile, 18 inch oil export pipeline to Shell's Main Pass 69 pump station, and a 74 mile, dual diameter 20/24 inch gas export line to Main Pass 260 installed by the S-lay method (Fig. 31).

|
| Figure 31 NaKika export pipelines (Kopp et al., 2004) |
Allseas installed the oil export pipeline in the flooded condition using the Lorelay in shallow water and the Solitaire in deepwater. Technip installed the risers. The gas export pipeline was installed using S-lay, and near the subsea tie-in with the Thunderhorse lateral, J-lay using Heerema's Balder. Flowlines were installed using the reel method, except for the pipe-in-pipe oil flowlines, where J-lay was employed. Total cost of the export pipelines, flowline and riser system, including subsea sleds and jumpers, procurement and installation, was $50 million, or about $1.4 million/mi. First oil was in 2004.
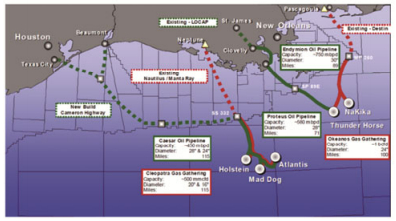
6.15 Mardi GrasThe Mardi Gras transportation system refers to a pipeline network that delivers oil and gas from five developments in two deepwater areas of the Gulf of Mexico: Holstein, Mad Dog, and Atlantis in the Southeastern Green Canyon area, and Thunderhorse and NaKika in the Southeastern Mississippi Canyon area (Fig. 32). NaKika began production in 2004 and the first leg of the system was the Okeanos Gas Gathering and Proteus Oil Pipeline; the remaining fields came on stream between 2004 and 2006 (Marshall and McDonald, 2004).
|
| Figure 32 Mardi Gras transportation system (Marshall and McDonald, 2004) |
The five pipeline systems total 489 miles and range from 20 to 30 inch diameter. Each system has separate ownership and total construction cost was reported to be $1 billion, or about $2 million/mile. A key feature of the Mardi Gras system was the installation of spare wye assemblies along the route to facilitate the future connection of third party production without lengthy system shut down. One technical hurdle was selection of a suitable pipeline route to reach the Atlantis production facility moored at the bottom of the Sigsbee Escarpment.
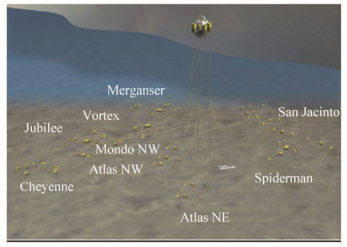
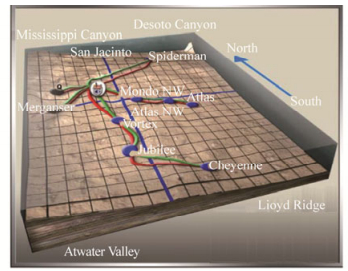
6.16 IndependenceThe Independence Project was designed to develop natural gas reserves from 10 fields in water depths from 7800 to 9 000 ft in the Eastern GOM discovered by several different companies from 2001 to 2005 (Holley and Abendschein, 2007; Burman et al., 2007). Individually, the field reserves were too small and isolated for stand-alone developments or tie-backs to existing hosts (Fig. 33), but collectively they were commercialized using a hub-and-spole development with 17 wells tied back to a semisubmersible host in 8 000 ft water depth (Fig. 34). Pipeline systems include 16 risers and one 20 inch export riser, subsea systems consisting of 12 umbilicals and 200 miles of flowlines, and a 24 inch 134 mile export gas and condensate pipeline connected to a shallow water platform (Al Sharif, 2007). First production occurred in 2007 and by the end of the year the platform reached its design capacity of 1 Bcf/d.
|
| Figure 33 Independence subsea field layout (Al Sharif, 2007) |
|
| Figure 34 Independence project location and seafloor topology (Burman et al., 2007) |
The Independence Hub platform was built and owned by Enterprise Products Partners LP and Helix Energy Solutions, and is operated by Anadarko Petroleum Corporation. In 2015, Enterprise sold their offshore GOM pipelines and service business to Genesis Energy LP for $1.5 billion, and the Independence Trail export gas/condensate pipeline is currently 100 percent owned by Genesis Energy. The wells and subsea system are owned and operated by different production companies.
Producers contract for capacity on the Independence Hub platform and pipeline and do not own the facilities. The platform cost about $385 million. The initial development wells were reported to cost $930 million, or about $55 million/well. The Independence Trail pipeline was installed at a cost of approximately $300 million, or about $2.2 million/mi.
The 210 miles of flowlines, 125 miles of umbilicals, and 155 jumpers/flying leads were reported to cost $370 million, or about $1.1 million/mi. Flowline and riser cost for the Spiderman-San Jacinto field were reported separately (Vercher and Blakeley, 2007): two 9 inch flowlines running 56 miles were reported to cost $136 million, or $2.3 million/mi; an 8 inch, 25 mile flowline with riser cost $103 million, or $4.0 million/mi; and a 10 inch, 22 mile flowline with riser cost $64 million, or $2.8 million/mi. Individual export and infield line show greater variation from aggregate system totals, as expected.
7 Press release data 7.1 Allseas-UrsaThe Ursa field was developed with a TLP in 1999 in 3 950 ft depth and is located 6 miles east of the Mars field and is comprised of the Crosby and Princess subsea developments. An 18 inch 47 mile oil pipeline and a 20 inch 47 mile gas pipeline to WD 143 was installed in 1998 by Allseas and reported to cost $76 million, or about $810 000/mi.
7.2 McDermott-BrutusMcDermott installed 26 miles of 20 inch pipeline for oil production and 24 miles of 20 inch line for gas production for Shell's Brutus development in 2002. Brutus utilized a TLP in development in 2 998 ft water depth, and was Shell's fifth TLP employed in the Gulf. Pipeline fabrication and installation is estimated at $85 million, or $1.69 million/mi.
7.3 Technip Coflexip-FalconIn 2002, Technip-Coflexip was awarded an EPCI contract from Pioneer Natural Resources and Mariner Energy for 32 miles of 10 in rigid pipe and hydraulic control umbilical between two subsea wells and the Falcon Nest Platform. The umbilicals were fabricated by Technip-Coflexip at its DUCO manufacturing plant in Houston. Installation was completed by the CSO Deep Blue. The contract was valued at $35 million, or $0.55 million/mi.
7.4 Subsea 7-Thunder Horse and AtlantisSubsea 7 was awarded a $30 million installation contract in 2002 by BP for its Thunder Horse and Atlantis developments. The work scope included the installation of 37 miles of umbilicals, flying leads, and rigid jumpers for Thunder Horse, and 26 miles of umbilicals at Atlantis. Installation cost is estimated at $476 000/mi.
7.5 Valero-Cameron HighwayIn 2003, Valero and GulfTerra Energy built the $458 million Cameron Highway system, a 390 mile oil pipeline that extends from the Southern Green Canyon area to refining centers in Port Arthur and Texas City, Texas. Unit cost is $1.17 million/mi.
7.6 Subsea 7-GliderIn 2003, Shell's Glider subsea tieback was brought on stream using two wells and a 6 inch 6 mile buried and insulated flowline for about $150 million. Well cost was reported at $49 million. Flowlines and umbilical procurement and installation is estimated to cost approximately $6.75 million/mi.
7.7 Technip, Subsea 7-Cascade/ChinookIn 2008, Technip was awarded two contracts worth $300 million by Petrobras for the Cascade/Chinook field development in water depths from 8 200 to 8 800 ft. The contracts covered five hybrid riser systems, construction and installation of 74 miles of 6 inch flowlines and gas export pipeline, 10 PLETs and two in-line tees. The pipelines were welded at the Group's spoolbase in Mobile, Alabama. Unit cost was approximately $4.05 million/mi.
Subsea 7 was awarded a $50 million contract by Petrobras to install 43 mi of power cables and control umbilicals and to fabricate and install 16 jumpers in the Cascade/Chinook fields in water depths from 7 544 ft to 9 840 ft. Installation cost is estimated at $1.16 million/mi.
7.8 Enbridge-Big FootEnbridge entered into an agreement with Chevron USA, Inc., Statoil GOM LLC and Marumbeni Oil and Gas USA in 2009 to construct and operate a 20 inch 40 mile oil pipeline from the Big Foot TLP in 5 500 ft water depth to a subsea connection for $250 million, or about $6.25 million/mi.
7.9 Subsea 7-DroshkySubsea 7 was awarded a $45 million contract for the fabrication and installation of two 8 inch reeled flowlines totaling 36 mi from Marathon's Droshky field in water depths ranging from 1 350 ft to 3 000 ft tied back to the Bullwinkle platform. The contract also included two 1 900 ft 8 inch risers, four PLETs, two PLEMs and three rigid jumpers. Pipeline was fabricated at the company's spoolbase facility at Port Isabel, TX, and laid in 2009 using the reeled vessel Seven Oceans. Unit cost is $1.25 million/mi.
7.10 Keathley Canyon ConnectorIn 2013, Williams Partners and DCP Midstream Partners reported spending $600 million to expand the Discovery pipeline system to connect production from the Keathley Canyon, Walker Ridge, and Green Canyon areas. Discovery signed long-term contracts with the Lucius and Hadrian South owners for gathering and processing services. The Keathley Canyon Connector is a 20 inch, 215 mile natural gas pipeline that terminates into Discovery's 30 inch mainline near ST 283. Unit construction cost was $2.8 million/mi.
7.11 Technip-Delta HouseTechnip was awarded a lump-sum EPCI contract by LLOG Exploration Offshore LLC in 2013 valued between $107 to $268 million for 124 miles of infield and export flowlines and risers in the Delta House development. Technip's Deep Blue laid the reeled lines and the G1200 construction vessel installed the export lines in 2014. Unit construction cost for procurement, construction and installation is estimated at $1.51 million/mi.
7.12 EMAS-GunflintEMAS AMC announced three EPCI contracts worth $300 million in October 2014 from Noble Energy for subsea tieback projects in the Big Bend, Dantzler, and Gunflint developments in the deepwater Mississippi Canyon area. The project scope included 80 miles of pipe-in-pipe flowlines and 56 miles of umbilicals in water depths up to 7 200 ft, or about $2.21 million/mi. Lewek Constellation performed the installation.
7.13 Technip-JuliaTechnip was awarded a lump-sum EPCI contract valued between $133 and $333 million by ExxonMobil for the Julia field in the Walker Ridge area at a water depth of 7 200 ft. Genesis, Technip's wholly owned subsidiary, performed the flowline design, and welding operations were performed at its spoolbase in Mobile, Alabama. The project scope included 30 miles of 10.75 inch insulated flowlines, steel catenary risers and PLETS, at a cost of $7.76 million/mi.
7.14 Subsea 7-ShellIn late 2014, Subsea 7 was awarded a contract by Royal Dutch Shell valued between $50 to $100 million for the installation of 27 miles of 8 inch flowlines and steel catenary risers including PLETs and inline structures. The main construction phase is expected to take place in 2016. Unit cost is estimated at $2.77 million/mile.
7.15 Enbridge-Walker Ridge Gathering systemEnbridge built the Walker Ridge Gathering System pipeline to provide natural gas transportation for the Jack, St. Malo and Big Foot fields. Construction cost of the system is estimated at $500 million, and includes 170 miles of 8-inch and 10-inch pipeline at depths of up to 7 000 ft. Unit cost is approximately $2.94 million/mi.
7.16 Enbridge-StampedeEnbridge announced in January 2015 construction of a $130 million crude oil pipeline to link Hess's Stampede development to existing infrastructure. The 16 mile long 18 inch pipeline will be constructed in water depths up to 3 500 ft and have a cost of $8.1 million/mi.
8 ConclusionsIndustry publications report actual cost for completed projects, but do not necessarily apply similar cost categories and frequently combine different system components in the reported cost. Press release data are lower quality data but provide useful information on contract type and order-of-magnitude estimates. At an aggregate level, there is general agreement between the two data sources when normalized, inflation-adjusted and appropriately categorized.
AcknowledgementsThis paper was prepared on behalf of the U.S. Department of the Interior, Bureau of Ocean Energy Management and has not been technically reviewed by the BOEM. The opinions, findings, conclusions, or recommendations expressed in this paper are those of the authors, and do not necessarily reflect the views of the BOEM. Funding for this research was provided through the U.S. Department of the Interior, Bureau of Ocean Energy Management.
| Al Sharif M, 2007. Independence trail-pipeline design. Offshore Technology Conference, Houston, OTC 19056. |
| Arthur TT, Cook EL, Chow JK, 1994. Installation of the Mobile Bay offshore pipeline systems. Offshore Technology Conference, Houston, OTC 7572. |
| Bai Y, Bai Q, 2012. Subsea engineering handbook. Gulf Professional Publishing, Houston, Texas. |
| Ballard AL, 2006. Flow-assurance lessons: The Mica tieback. Offshore Technology Conference, Houston, OTC 18384. |
| Beckmann MM, Riley JW, Volkert BC, Chappell JF, 1998. Troika-towed bundle flowlines.Offshore Technology Conference, Houston, OTC 8848. |
| Berger RK, McMullen ND, 2001. Lessons learned from Troika andflow assurance challenges. Offshore Technology Conference, Houston, OTC 13074. |
| Boening DE, Howell ER, 1984. Lena guyed tower project overview. Offshore Technology Conference, Houston, OTC 4649. |
| Bourgeois TM, 1994. Auger tension leg platform: Conquering the deepwater Gulf of Mexico. International Petroleum Conference of Mexico, Veracruz, SPE 28680. |
| Burman J, Kelly GF, Renfro K, Shipper DW, 2007. Anadarko Independence project completion campaign: Executing the plan. SPE Annual Technical Conference and Exhibition, Anaheim, SPE 110110. |
| Clarke DG, Cordner JP, 1996. BP exploration's Pompano subsea development: Operational strategy for a subsea project. Offshore Technology Conference, Houston, OTC 8209. |
| Cooke JC, Cain RE, 1992. Development of conventionally uneconomic reserves using subsea completion technology: Garden Banks block 224, Gulf of Mexico. Offshore Technology Conference, Houston, OTC 7004. |
| Cooley C, Wallace BK, Guimetla R, 2003. Hydrate prevention and methanol distribution on Canyon Express. SPE Annual Technical Conference and Exhibition, Denver, SPE 84350. |
| DeReals TB, Nogueira AC, Ferroni LB, 2003. Canyon Express flowline system: Design and installation. Offshore Technology Conference, Houston, OTC 15096. |
| Digre KA, Brasted LK, Marshall PW, 1989. The design of the Bullwinkle platform. Offshore Technology Conference, Houston, OTC 6050. |
| Gallagher MJ, Arthur TT, Boening DE, Sortland KA, 1994. An overview of the Mobile Bay project offshore facilities and installation approach. Offshore Technology Conference, Houston, OTC 7448. |
| Gerwick B, 2007.Construction of marine offshore structures. 3rd Ed. CRC Press, Boca Raton. |
| Gillespie G, Angel KF, Cameron JA, Mullen ME, 2005. Troika field: A well failure, and then a successful workover.SPE Annual Technical Conference and Exhibition, Dallas, SPE 97291. |
| Godfrey DG, Haney JP, Pippin AE, Stuart CR, Johnston DD, Oriean RH, 1997. The Mars project overview. Offshore Technology Conference, Houston, OTC 8368. |
| Grant L, Japar NJ, Van Den Haak A, 2014.The use of a "type well" concept approach for design, feasibility, and creation of a technology plan for well construction in a new Gulf of Mexico deepwater development.SPE Annual Technical Conference, Amsterdam, SPE 170791. |
| Haney JP, Johnston DD, Stuart CR, Rodrigue MJ, FerrariS, Meek J, Smith FA, 1997. Mars project alternative contracting approach. Offshore Technology Conference, Houston, OTC 8370. |
| Holley SM, Abendschein RD, 2007.Independence project overview-A producer's perspective.Offshore Technology Conference, Houston, OTC 18721. |
| Hoose JW, Schneider DR, Cook EL, 1996. Rocky flowline project-The Gulf of Mexico & first reeled pipe-in-pipe. Offshore Technology Conference, Houston, OTC 8131. |
| Hudson JD, Dutsch DB, Lang PP, Lorimer SL, Stevens KA, 2002. An overview of the Na Kika flow assurance design. Offshore Technology Conference, Houston, OTC 14186. |
| Johnson HE, Kartzke RJ, Kruger RM, 1994. The Mobile Bay project. Offshore Technology Conference, Houston, OTC 7447. |
| Kennefick J, Lang P, Hervey D, 1999. Morpeth export system. Offshore Technology Conference, Houston, OTC 10859. |
| Kleinhans JW, Cordner JP, 1997. Pompano through-flowline system. SPE Annual Technical Conference, San Antonio, SPE 38771. |
| Koon JR, Langewis C, 1990. Jolliet: The project. Offshore Technology Conference, Houston, OTC 6359. |
| Koon JR, Heijermans B, Wybro PG, 2002. Development of the Prince field. Offshore Technology Conference, Houston, OTC 14173. |
| Kopp F, Barry DW, 1994. Design and installation of Auger pipelines. Offshore Technology Conference, Houston, OTC 7619. |
| Kopp F, Light BD, Preli TA, Rao VS, Stingl KH, 2004.Design and installation of the Na Kika export pipelines, flowlines and risers. Offshore Technology Conference, Houston, OTC 16703. |
| Lamey MF, Schoppa W, Stingl KH, Turley AJ, 1999. Dynamic simulation of the Europa and Mars expansion projects: A new approach to coupled subsea and topsides modeling. SPE Annual Technical Conference, Houston, SPE 56704. |
| Langner CG, Wilkinson HM, 1980. Installation of the Cognac 12-inch pipeline.Offshore Technology Conference, Houston, OTC 3740. |
| Marshall R, McDonald W, 2004. Mardi Gras transportation system overview. Offshore Technology Conference, Houston, OTC 16637. |
| Maus LD, Finn LD, Turner JW, 1985. Development of the guyed tower: A case history. Journal of Petroleum Technology, 37(4), 651–659. |
| Meng W, Ogea P, King M, 2011. Changes of operating procedures and chemical application of a mature deepwater tie-back-Aspen field case study. Offshore Technology Conference, Houston, OTC 21402. |
| Nations JF, Speice CB, 1982. The field development of Cognac (Mississippi Canyon 194) field: A case history. SPE Fall Technical Conference, New Orleans, SPE 10955. |
| Palmer AC, King RA, 2008. Subsea pipeline engineering. Penn Well, Tulsa. |
| Rijkens F, Allen M, Hassold T, 2003. Overview of the Canyon Express project, business challenges and "industry firsts." Offshore Technology Conference, Houston, OTC 15093. |
| Roach WJF, Knight VC, Lochte GE, Kibbee SE, Mackintosh N, 1999.Morpeth field development overview. Offshore Technology Conference, Houston, OTC 10854. |
| Schneider DR, 2001. A history of a Gulf of Mexico deepwater subsea production system development strategy. Offshore Technology Conference, Houston, OTC 13116. |
| Simon JV, Edel JC, Melancon C, 1999. An overview of the Baldpate project. Offshore Technology Conference, Houston, OTC 10914 |
| Smetak EC, Lombardi J, Roussel HJ, Wozniak TC, 1984. Jacket, deck, and pipeline installation-Lena guyed tower. Offshore Technology Conference, Houston, OTC 4683. |
| Sterling GH, Krebs JE, Dunn FP, 1989. The Bullwinkle project: An overview. Offshore Technology Conference, Houston, OTC 6049. |
| Tillinghast WS, 1990. The deepwater pipeline system on the Jolliet project.Offshore Technology Conference, Houston, OTC 6403. |
| Vercher CM, Blakeley D, 2007. Codevelopment of Spiderman and San Jacinto fields. Offshore Technology Conference, Houston, OTC 18590. |
| Willson SM, Edwards S, Heppard PD, LiX, Coltrin G, Chester DK, Harrison HL, Cocales BW, 2003. Wellbore stability challenges in the deep water, Gulf of Mexico: Case history examples from the Pompano field. SPE Annual Technical Conference and Exhibition, Denver, SPE 84266. |


