1 Introduction
Currently,maritime technologies predominantly rely on the propagation of sound for detection,navigation,and communication within the marine environment. Although different aspects of sound propagation in ocean waters have been the subject of vast and profound studies,several intricacies still need to be carefully investigated due to the complexity of sound behavior in the abstruse ocean environment. One of these complexities is the ocean surface as a large number of factors affect sound scattering and reflection from it; of these,wind,waves,and wind-generated bubbles are of high importance.
Sound propagation can be considered either as the propagation of a wave and/or pressure disturbance within a medium,and previous studies can be categorized depending on their perspective in this respect. To scrutinize sound in the ocean,three different factors need to be considered—sound propagation,noise generation,and sound reverberation(Etter,2003)—and mathematical models can be constructed for each of these. Propagation and reverberation of sound are affected by different boundaries,such as the sea surface,sea floor,and ice cover boundaries; thus,physical and mathematical models require different assumptions in consideration of these boundary features. However,models face difficulties in predicting changes in sound characteristics due to the wide variety of different factors involved in sound propagation and reverberation. As a boundary,the ocean surface also affects sound propagation and reverberation; from an acoustic perspective,it mainly comprises sea surface roughness and sub-surface bubbles(Ogden and Erskine,1994a).
The sub-surface bubble population has different effects on incident sound,which has been the subject of study by several investigators over the past twenty years. For example,after World War II,a large number of researchers conducted studies on the influence of subsurface bubbles on sound quality(Ainslie,2005; Prosperetti,1977; Deane and Stokes,2002; Leifer et al.,2006,2007; Dahl et al.,1997; Dahl and Kapodistrias,2003; Garrett et al.,2000; Leighton,1994; McDaniel,1993; Dahl,2003; Dahl et al.,2008; Ghadimi et al.,2015a,2015b,2015c,2015d,2016; van Vossen and Ainslie,2011; Ainslie,1996; Ogilvy,1991). In addition,studies on the effects of a realistic sea surface(including the influence of sub-surface bubble plumes and surface waves)on incident sound have been conducted using experimental,analytical,and numerical approaches(Keiffer et al.,1995,2001; Marsh,1961; Bass,1960; Kuo,1988,1992,1994; Medwin and Clay,1998; Ogden and Erskine,1994b; Foldy,1945; Henyey,1991; Medwin,1974; Prosperetti et al.,1993; Hall,1989; Gauss and Fialkowski,1993; Verestchagina and Fedotovsky,2009; Nicholas et al.,1998; Johnson and Cook,1979; Novarini and Norton,1994; Chapman and Harris,1962; Wu,1992; Chapman and Scott,1964).
Dahl et al.(2008)provided measurements of excess attenuation from near-surface bubbles,which were obtained during the Shallow Water ’06 experiment. These are transmission measurements made over the frequency range of 1–20 kHz,and they demonstrate the dependence of the frequency,grazing angle,and wind speed on attenuation. The data modeling in the study pointed to bubble void fractions of an order of inch for a wind speed range of 10–13 m/s,and the study provided an empirical model for bubble attenuation as a strong function of wind speed. Ghadimi et al.(2015a; 2016)then investigated sea surface effects on incident sound based on the Hall-Novarini model(HN)(van Vossen and Ainslie,2011; Keiffer et al.,1995)in consideration of the dominant radius of subsurface bubbles ranging from 10 μm to 100 μm,depending on the ocean environment.
van Vossen and Ainslie,2011introduced scattering from individual resonant bubbles as a dominant mechanism. A scattering model was derived in their study that incorporates the contribution from bubbles together with that of rough surface scattering. They determine that Critical Sea Tests(CST)data can be explained by scattering from a small number of large resonant bubbles,which indicates that an alternative mechanism is provided to that of scattering from bubble clouds. The resulting scattering strengths in their modeling of subsurface bubble plumes are consistent with results of CST experiments for a wider range of bubble radii,and consequently for a broader range of environmental wind speeds.
Different theories exist in relation to simulating sound scattering and reflection from the ocean’s surface based on the pressure or wave concept of sound. The perturbation method is basically a wave based approach,and it has been used in a number of published papers since initial publication of the works of Marsh(1961)and Bass(1960). In Marsh’s work,an assumed reflected velocity potential field is substituted into a pressure release boundary condition at the rough ocean surface boundary; an approximation of the reflected velocity potential was then produced using this method(1988). In the perturbation method proposed by Bass(1960),a velocity potential field is divided into mean and scattered velocity potential fields. Two unknowns,which are the scattered velocity potential fields,are solved by utilizing two equations. However,to simplify ocean surface complexities these two approaches only consider ocean surface waves in relation to surface roughness. In other words,only wave characteristics are considered to be an effective factor on incident sound and the effects of other factors,such as sub-surface bubbles,are neglected. Based on Marsh’s perturbation method,Kuo,1988developed a new approach wherein wind-generated bubble effects are considered. In his approach,a joint surface roughness/volumetric perturbation scattering theory is utilized to characterize bubbly ocean surface reverberation. However,due to a lack of any available information for solving the derived equations in Kuo’s method,prediction of the backscattering strength is based on certain experimental theories,such as the Pierson and Moskowitz wave spectrum.
Other approaches used to study scattered sound from a rough sea surface are mostly based on the pressure disturbance of sound in the environment. These methods have their roots in the classical physics theories of Rayleigh,Helmholtz,Kirchhoff,and Born. The Helmholtz-Kirchhoff Integral,Kirchhoff Approximation,and Fresnel Approximation can be used in this area of study. The Helmholtz-Kirchhoff integral and the Kirchhoff approximations are analytical statements of Huygens's principle and Fresnel zones(Medwin and Clay,1998). These methods are used in mathematical physics to derive quantitative expressions for the sum of Huygens source-lets and wavelets(Medwin and Clay,1998). The Helmholtz-Kirchhoff-Fresnel(HKF)method is the result of these derivations,and in this the scattering of sound by surface roughness can be estimated,albeit neglecting the effects of sub-surface bubbles.
The present work is an attempt to implement the sub-surface bubble effects determined in the HKF method,based on the extended Hall-Novarini(HN)model(van Vossen and Ainslie,2011),to obtain a more precise estimation of sound scattering from the ocean’s surface in various environmental conditions. The sound behavior in bubbly water based on the extended HN model is therefore discussed. Therefore,the HKF method is briefly explained and the previously presented equations for a bubbly medium based on the extended HN model are applied to the equations in the HKF method to obtain a model for sound scattering from the ocean surface which affects the sub-surface bubbles and surface waves. The MSSAS is then formed based on this model. This model is capable of considering surface waves and sub-surface bubbles simultaneously when modeling sound scattering from the ocean surface in various environmental conditions.
2 Implementation of bubbly water regionThe sub-surface bubble population is an important factor in the sea’s surface and it has an effect on the incident sound quality(Ogden and Erskine,1994b). The effects of sub-surface bubbles on sound propagation have been examined by many acousticians; the theory of sound propagation in liquid containing bubbles has been described by Foldy(1945),Henyey(1991),Medwin(1974),Prosperetti(1992),Hall(1989),Gauss and Fialkowski(1993). Gauss and Fialkowski(1993)concluded that bubbles become an increasingly important driver of surface scattering strength when there is a decreasing grazing angle and an increasing frequency and wind speed. However,Verestchagina and Fedotovsky(2007)concluded that the dynamic density of a bubbly water medium should be considered in sound propagation at a low frequency due to the presence of a bubbles cloud.
In relation to hurricane-force conditions,bubbles can be found at depths of 1 to 2 m beneath the ocean surface. However,they are generally entrained much closer to the sea surface at depths of 0.1 to 0.5 m in relation to breaking waves. At larger depths,bubble clouds disappear because of hydrostatic pressure.
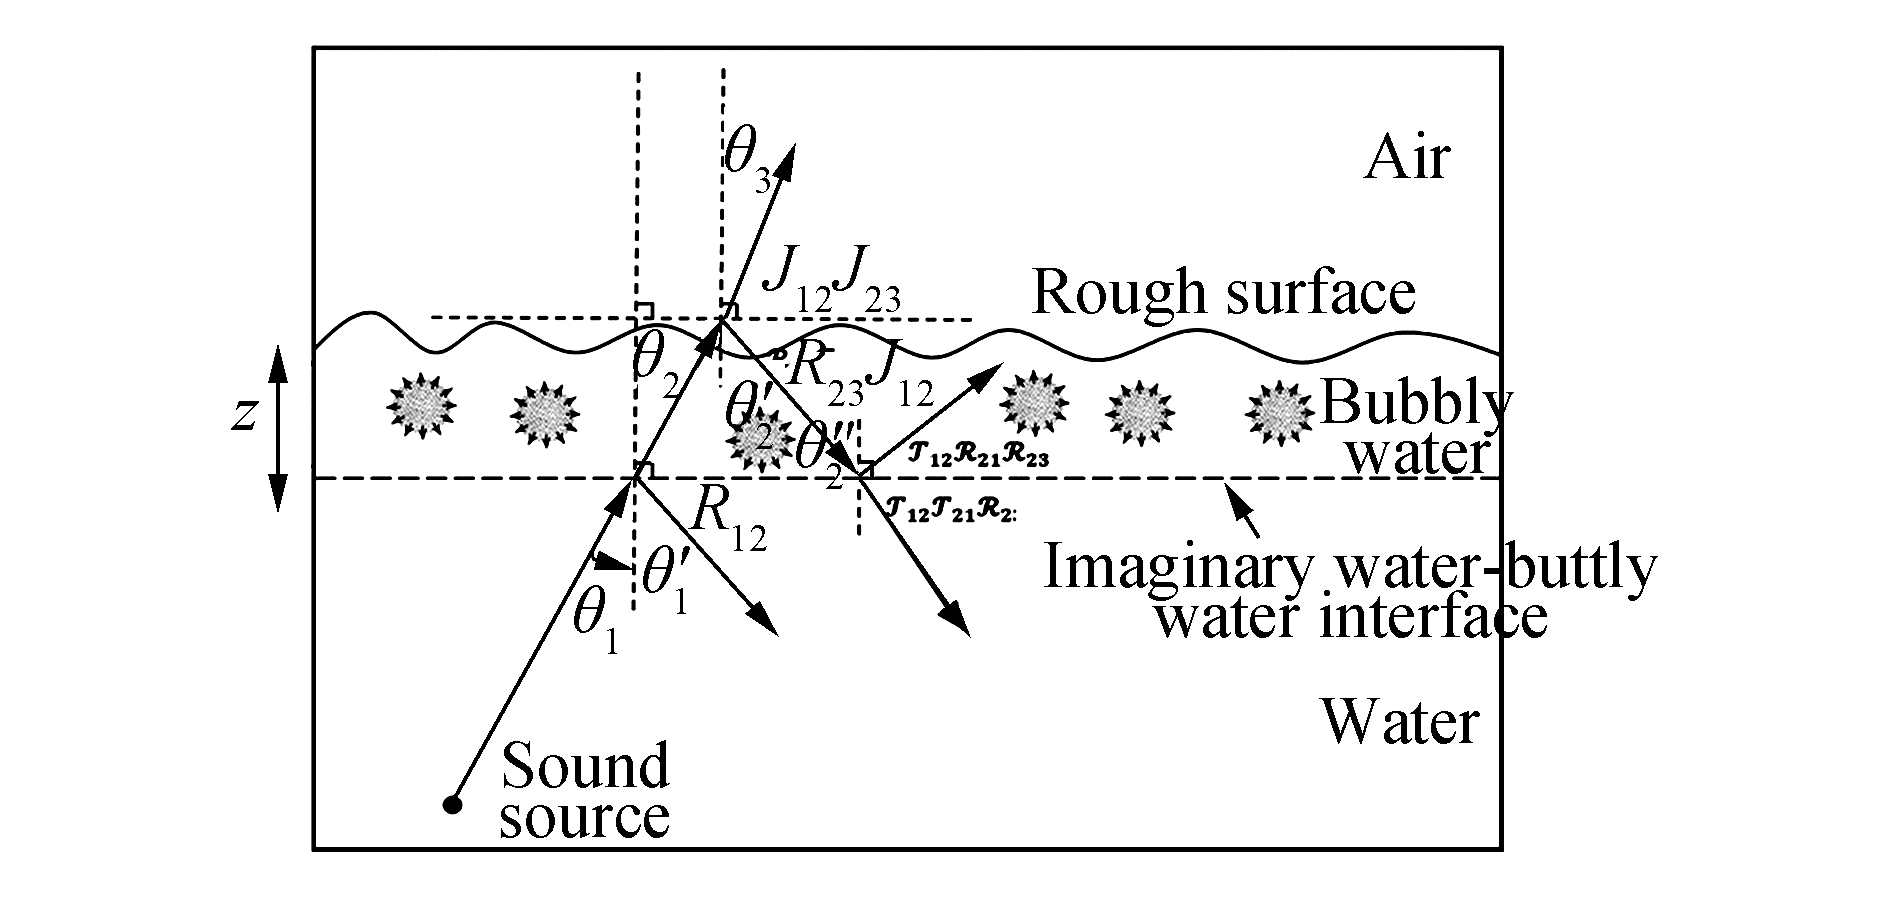
It is imperative to optimize the HKF method when including the effects of bubbles on sound propagation(Ghadimi et al.,2015a,2016). As discussed by previous investigators such as van Vossen and Ainslie,2011and Kuo(1994),to study the effect of bubbles it is necessary to consider the thin layer between the air and water as a bubbly water medium with a wavy surface and flat bottom. In the current study,a frequency range of below 1 kHz is adopted,so that sound waves with high wavelengths enter the subsurface bubbly medium,which has a constant smaller thickness(compared to the sound wavelength). However,at a low sea surface roughness,the sea surface can be considered to be relatively smooth compared to the sound wavelength. As discussed by van Vossen and Ainslie,2011and Kuo(1994),when sound enters the bubbly water medium beneath the sea surface the sound can be volumetrically(by bubble plumes)scattered downwards or surface scattered. Therefore,the bubbly medium not only alters the scattering pattern due to the irregular internal boundaries of the oscillated bubbles and surface roughness,but it also alters the scattering strength. However,in the current study,the effects of the irregular boundaries of bubble plumes on the scattering pattern are neglected due to the complexity involved,and the scattering pattern is assumed to be affected by sea surface roughness,which is considered through the HKF method. This assumption seems reasonable for long distance sound propagation at a low frequency,which is considered here. However,in addition to the role of surface roughness,the effects of bubble plumes on the strength of the scattered sound are also considered here. Therefore,the addition of a bubbly water region as a third medium between the water and air is useful for considering the effects of bubble plumes on the scattering strength at long distance propagation at a low frequency. The schematic of this phenomenon is illustrated in Fig. 1. The surface is considered to be wavy,the layer thickness is constant,and the bottom of the bubbly layer is assumed to be flat.

|
| Figure 1 Schematic of considered three phase media at the sea surface, where RS is the source position and θi is the incident angle |
The reflection and transmission coefficients for the considered three layered media can be obtained as follows,
| $ {\mathcal{R}_{13}} = \frac{{{\mathcal{R}_{12}} + {\mathcal{R}_{23}}\exp ( - i2{\phi _2})}}{{1 + {\mathcal{R}_{12}}{\mathcal{R}_{23}}\exp ( - i2{\phi _2})}} $ | (1a) |
| $ {\mathcal{T}_{13}} = \frac{{{\mathcal{T}_{12}}{\mathcal{T}_{23}}\exp ( - i{\phi _2})}}{{1 + {\mathcal{R}_{12}}{\mathcal{R}_{23}}\exp ( - i2{\phi _2})}} $ | (1b) |
where ø2 is expressed as
| ${\phi _2} = {k_2}z\cos {\theta _2} $ | (2) |
where k2 is the wave number in the middle medium,2πf; f is the frequency; C2 is the sound speed in a bubbly water medium; and z is its mean depth(Fig. 2). As seen in Eq.(2),ℜ13is related to C2(through parameter k2),which is the speed of sound in bubbly water.
|
| Figure 2 Reflection and transmission in thin layer |
In order to apply Eq.(1),it is necessary to determine the sound speed in a bubbly medium,as subsurface bubbles have significant effects on sound speed and attenuation. According to Prosperetti(1977)and Hall(1989),the sound speed in bubbly water can be determined through the following relation,
| $ C_2^{ - 2} = C_1^{ - 2} + \frac{1}{{{\rm{\pi }}{f^2}}}\int\limits_0^\infty {\frac{{an(a)}}{{(\frac{{{a^2}}}{{a_r^2}} - 1 + \frac{{i2\beta }}{\omega })}}{\rm{d}}a} $ | (3) |
where C2 is the complex sound speed,and the imaginary part describes the attenuation,C1 is the sound speed in absence of air bubbles,ω is the radial frequency,n(a)is the bubble Population Spectral Density(PSD),β is the damping factor,and ar,which is related to the resonant bubble radius at frequency,f,is previously defined in van Vossen and Ainslie,2011. As evident in Eq.(3),it is necessary to determine PSD when calculating the sound speed in bubbly water,and different acousticians have considered various approaches to accomplish this. In some studies,a dominant bubble radius with a peak density has been considered to estimate the bubble populations beneath the water surface(Medwin and Clay,1998). For instance,the HN model(van Vossen and Ainslie,2011; Keiffer,1995)considers the radius of subsurface bubbles in a range from 10μm to 1 000 μm according to the ocean environment. In addition,Johnson and Cook(1979),Hall(1989),and Novarini and Norton(1994)developed an algorithm to estimate bubble populations as
| $n(a)da = 1.6 \times {10^4}G(a,z)U(W)D(z,W)$ | (4) |
where G,U,and D are functions of dominant bubble radius,a(μm)is defined in(Medwin and Clay,1998),W(m/s)is the wind speed,and z(m)is the mean bubbly water depth. In a published work,Ghadimi et al.(2016)applied the HN approach(Keiffer et al.,1995)to model the effects subsurface bubbles. However,van Vossen and Ainslie,2011concluded that because bubbles that have a larger radius,and which significantly contribute to the sea surface scattering strength at low frequencies are not included in the Hall-Novarini model(Keiffer et al.,1995),the resulting scattering strengths based on HN model could be underestimated compared to CST results. Consequently,van Vossen and Ainslie(2011)proposed a model named the “extended HN model,” in which bubbles of a larger radius are considered through modifying the term G(a,z)in Eq.(4). Furthermore,van Vossen and Ainslie(2011)studied the features of the bubbly medium in the CST experiments conducted by Ogden and Erskine(1994a,1994b). In the current study,the same features for the bubbly medium are considered so that it is possible to compare the results of the current study against the experimental results of Ogden and Erskine(1994a,1994b). Results show that in comparison with the classical HN model,scattering strengths based on the extended HN model have good agreement with CST results. In the extended HN model,the term G(a,z)is defined as
| $ G(a,z) = \left\{ {\begin{array}{*{20}{c}} {{{\left( {\frac{{{a_{ref}}(z)}}{a}} \right)}^4}{a_{\min }} \le a < {a_{ref}}(z)}\\ {{{\left( {\frac{{{a_{ref}}(z)}}{a}} \right)}^{x(z)}}{a_{ref}}(Z) \le a < 1{\rm{mm}}}\\ {{{\left( {\frac{{{a_{ref}}(z)}}{{1mm}}} \right)}^{x(z)}}{{\left[ {\frac{{1mm}}{a}} \right]}^{y(z)}}1mm \le a < {a_{\max }}} \end{array}} \right. $ | (5) |
where
| $ \begin{array}{l} x(z) = 4.37 + {\left( {\frac{z}{{2.55m}}} \right)^2}\\ y(z) = p + {\left( {\frac{z}{{2.55m}}} \right)^2} \end{array} $ | (6) |
where,aref is the reference bubble radius and amin is the minimum possible bubble radius in the bubbly medium. The constant,p,is determined in van Vossen and Ainslie(2011). It is a tuning parameter that can be ascertained by fitting the data,which is also discussed in van Vossen and Ainslie(2011).
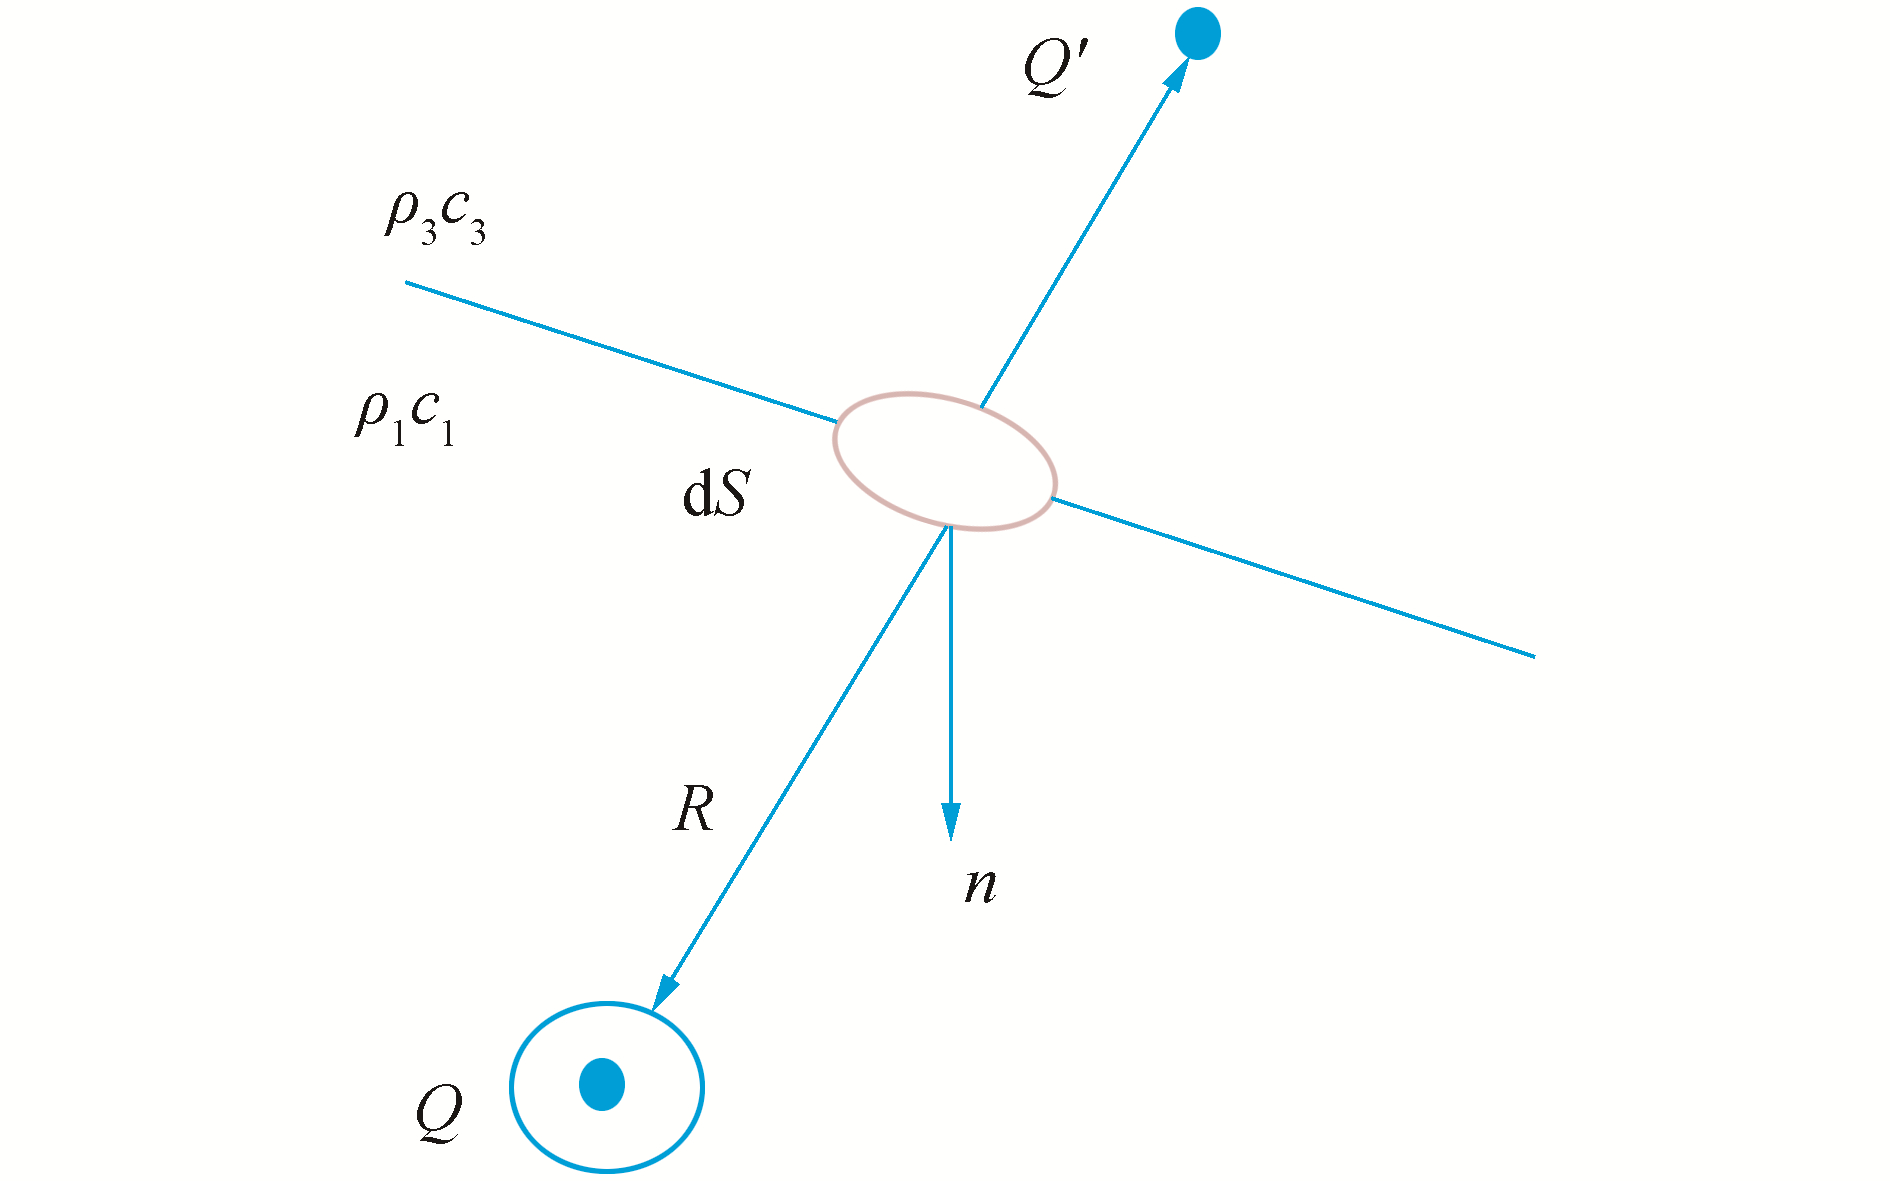
3 Algorithm of Modified SSAS(MSSAS)In this section,the HKF method(on which the MSSAS is developed),is briefly explained. Figure 3 shows the geometry of a continuous wave with a frequency ω=kc emitted from a sound source,Q,hitting the ocean’s surface. Assuming that U1(x,y,z,t)and U2(x,y,z,t)are solutions of the wave equation,these fields are functions of the position,frequency,and source of acoustic pressure. The fields have time dependence,exp(iωt),and their values can be found using Green’s theorem. The generated field by source can be found as follows(Medwin and Clay,1998),
|
| Figure 3 Geometry for sound transmission through a surface (Medwin and Clay, 1998) |
| $ U\left( Q \right) = \frac{1}{{4{\rm{\pi }}}}\int\limits_S {{{\left[ {U\frac{\partial }{{\partial n}}\left( {\frac{{{{\rm{e}}^{ - {\rm{i}}kR}}}}{R}} \right) - \frac{{{{\rm{e}}^{ - {\rm{i}}kR}}}}{R}\frac{{\partial U}}{{\partial n}}} \right]}_S}{\rm{d}}S} $ | (7) |
Eq.(7)is the integral theorem of Helmholtz and Kirchhoff for harmonic sources,where dS is an element of the ocean surface,R is the distance of S to the source,and n is the normal vector of S. The field quantity,U(Q)is obtained in m–1,and when it is multiplied by the source function,P0R0exp(iωt),the time-varying sound pressure is produced.
The Kirchhoff approximation is used to obtain U(Q)on the surface,S,and the scattered field can be written as follows(Clay and Medwin,1998),
| $ U(Q) = \frac{\mathcal{R}}{{4{\rm{\pi }}}}\int\limits_S {\frac{\partial }{{\partial x}}({U_S}\frac{{{{\rm{e}}^{ - {\rm{i}}kR}}}}{R}){\rm{d}}S} $ | (8) |
where the coefficient ℜ is the reflection coefficient of an infinite rough surface interface. The generic symbol U can be replaced by p,the acoustic pressure. Assuming that the source projects a Gaussian beam pattern that insonifies a small area of the rough surface,the incident sound pressure at surface element,dS,at distance,RS,from the source is
| ${p_{inc}} = \frac{{{D_t}{P_0}{R_0}\exp [{\rm{i}}(\omega t - k{R_S})]}}{{{R_s}}}$ | (9) |
where Dt is the source directionality,k is the wave number,2πf /c,and P0 is the source pressure at range,R0. The integral for the scattered field(Eq.(8))becomes
| $ {\mathop{\rm P}\nolimits} \left( {f,t} \right) \approx \frac{{{P_0}{R_0}{\mathcal{R}_{12}}}}{{4{\rm{\pi }}}} \times \int\limits_S {{D_t}} \frac{\partial }{{\partial n}}\left\{ {\frac{{{\rm{exp}}\left[ {{\rm{i}}\omega t - {\rm{i}}k\left( {R + {R_S}} \right)} \right]}}{{R{R_S}}}} \right\}{\rm{d}}S $ | (10) |
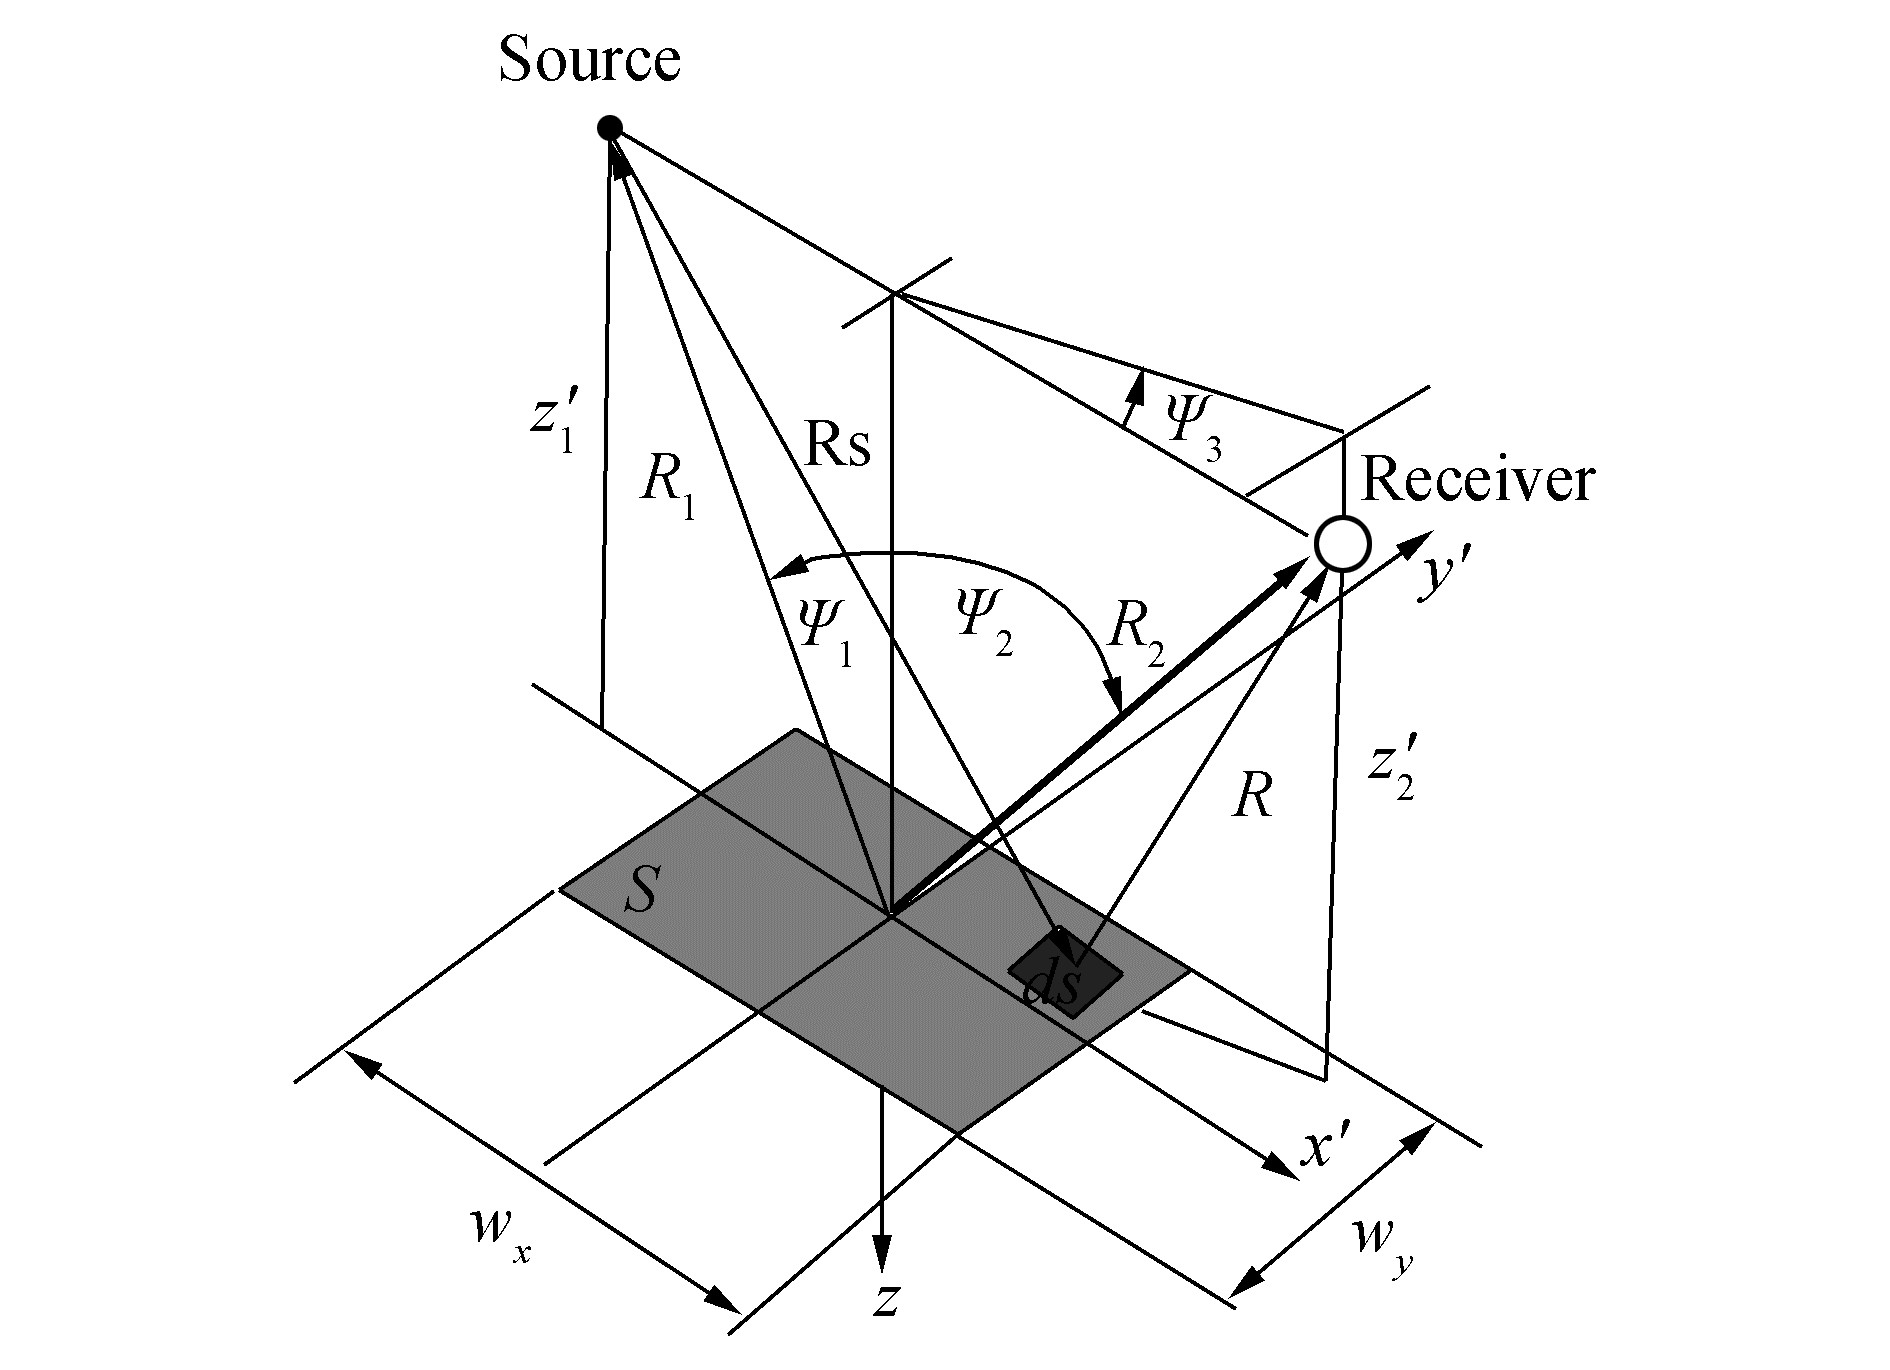
Ranges of R and RS are defined in Fig. 4. The source directionality Dt,can be considered as the Gaussian transmission function. Wg and Lg,which are the half-beam widths to Dt=e–1,are described respectively as
|
| Figure 4 Geometry for facet scattering calculation. The element area dS is elevated–ξ above the x′y′ plane (Medwin and Clay, 1998) |
| $\Delta \phi \cong \sin \phi = \frac{2}{{K{W_g}}}$ | (11) |
| $\Delta x \cong \sin x = \frac{2}{{K{L_g}}}$ | (12) |
Therefore,at distance R1,Dt can be mathematically described as
| $ {D_t} = \exp \left( { - \frac{{{x^2}}}{{{X^2}}} - \frac{{{y^{\rm{2}}}}}{{{Y^2}}}} \right) $ | (13) |
where
| $X = {R_1}\frac{{\Delta x}}{{\cos {\theta _1}}}$ | (14) |
| $Y \cong {R_1}\Delta \phi $ | (15) |
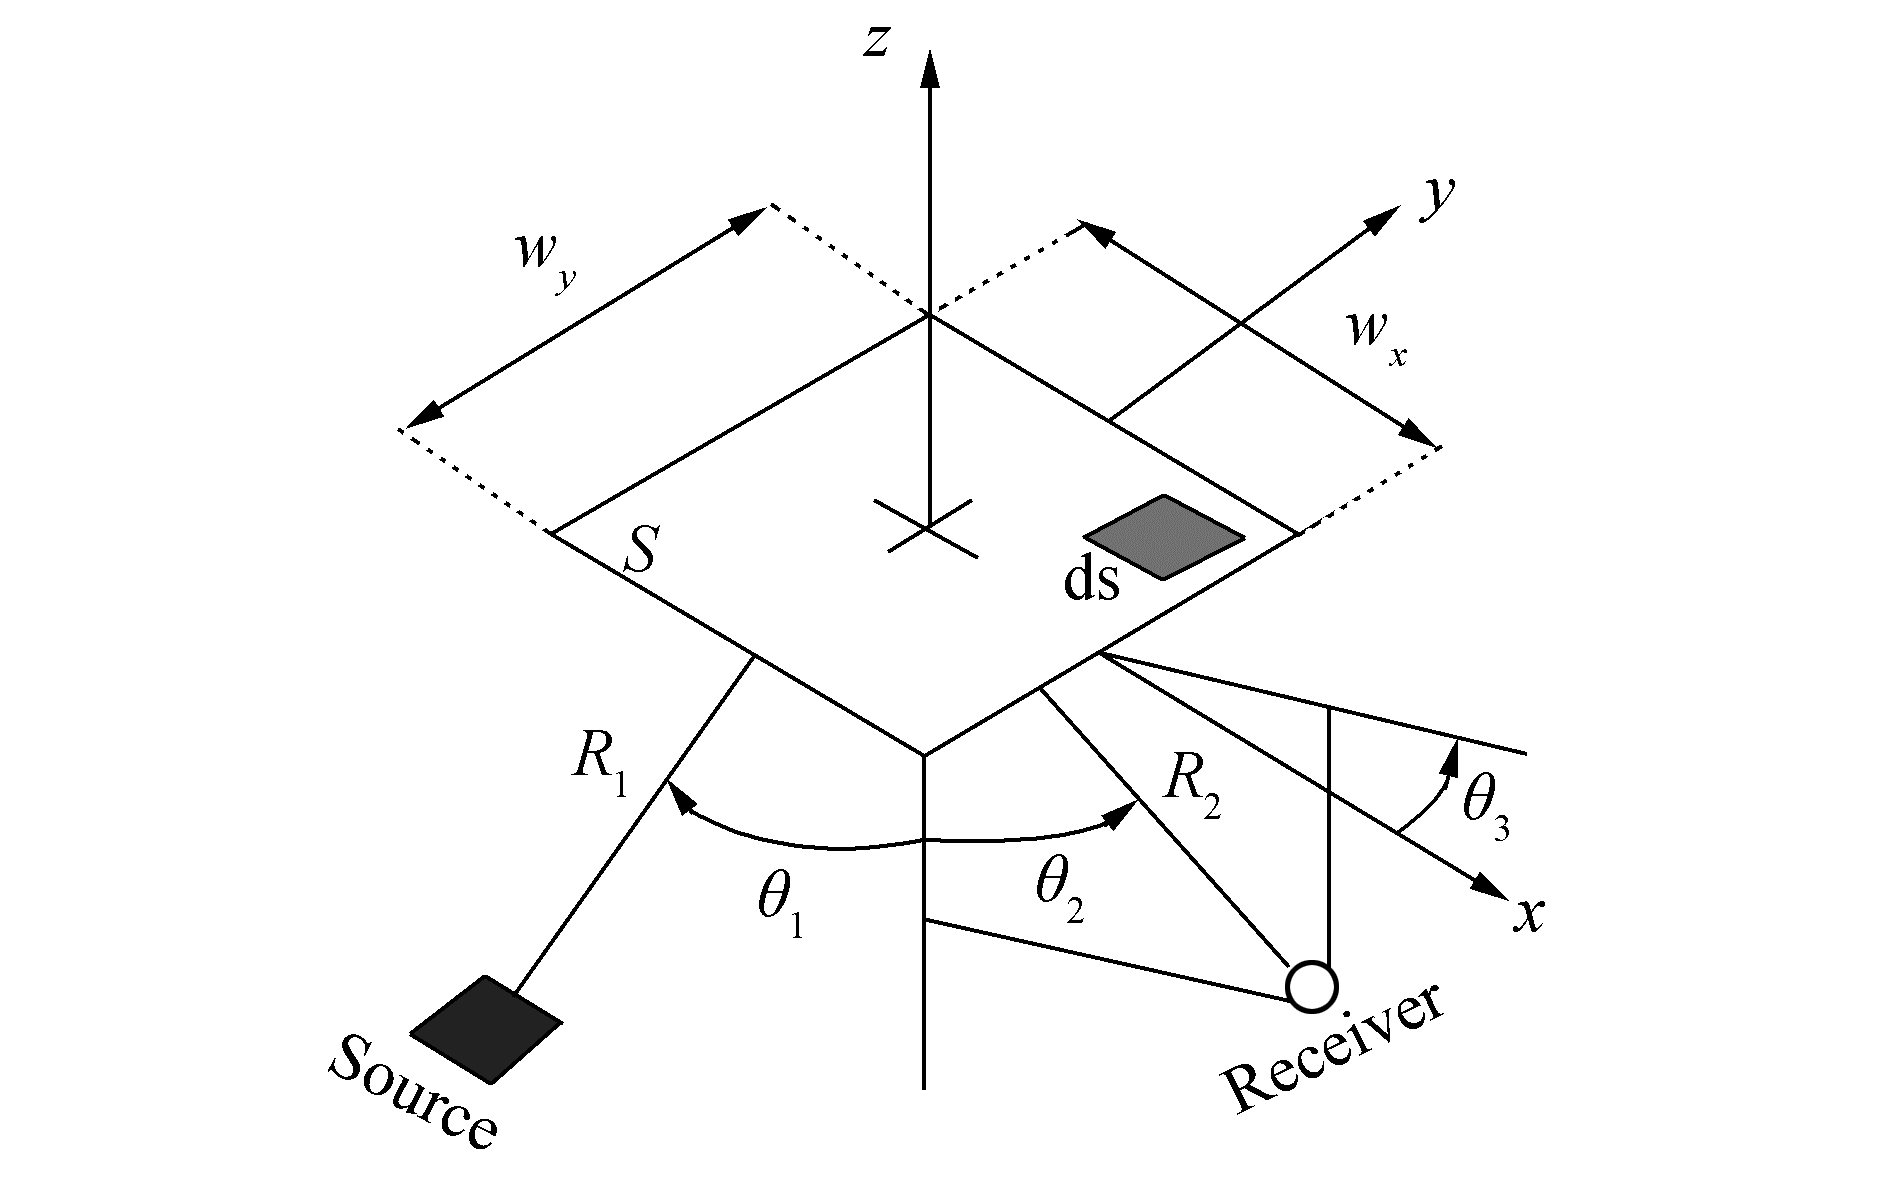
The incremental area,dS,is at a depthξ(x’,y')relative to the x’ and y' plane(Fig. 4). The local depth,ξ,(i.e.,the local roughness)is a deviation from the plane interface and is small relative to RS and R; therefore the second-order Fresnel approximation of RS and R in Eq.(10)(Medwin and Clay,1998)can be applied. In addition,in Eq.(10)ℜ12 is the reflection coefficient at the air-water interface. As discussed in the previous section,to include the bubbly water effects on the entering sound,a three phase media can be considered at the sea surface. Therefore,through replacing ℜ12 with the multi-layered reflection coefficient,ℜ13,the scattered pressure from a point at range,R2,to the receiver is shown in Fig. 5,and can be obtained as follows,
|
| Figure 5 Scattering geometry: Differential area dS is at a position x, y and has height ξ with respect to the mean surface (Medwin and Clay, 1998) |
| $\begin{array}{l} p \cong \frac{{{\rm{i}}{p_0}{R_0}{\mathcal{R}_{13}}kG\left( \theta \right)\exp \left[ {{\rm{i}}\omega t - {\rm{i}}k\left( {{R_1} + {R_2}} \right)} \right]}}{{2{\rm{\pi }}{R_1}{R_2}}} \times \\ \int {\int_{ - \infty }^\infty {{D_t}\exp \left[ { - {\rm{i}}\left( {\frac{{{x^2}}}{{x_f^2}} + \frac{{{y^2}}}{{y_f^2}} + 2\alpha x + 2\beta y + 2\gamma \xi } \right)} \right]{\rm{d}}y{\rm{ d}}x} } \end{array}$ | (16) |
where
| $ x_f^{ - 2} \equiv \frac{k}{2}\left( {\frac{{{{\cos }^2}({\psi _1})}}{{{R_1}}} + \frac{{1 - {{\sin }^2}({\psi _2}){{\cos }^2}({\psi _3})}}{{{R_2}}}} \right) $ | (17) |
| $y_f^{ - 2} \equiv \frac{k}{2}\left( {\frac{1}{{{R_1}}} + \frac{{1 - {{\sin }^2}\left( {{\psi _2}} \right){{\sin }^2}({\psi _3})}}{{{R_2}}}} \right)$ | (18) |
| $G(\theta ) \cong \frac{{\cos {\theta _1} + \cos {\theta _2}}}{2}$ | (19) |
| $2\alpha \equiv k(\sin {\theta _1} - \sin {\theta _2}\cos {\theta _3})$ | (20) |
| $2\beta \equiv - k(\sin {\theta _2}\sin {\theta _3})$ | (21) |
| $2\gamma \equiv k(\cos {\theta _1} + \cos {\theta _2})$ | (22) |
To obtain the surface scattering strength it is necessary to find the mean-squared scattered pressure. Considering a smooth surface image reflection,the reflected pressure can be described as(Medwin and Clay,1998)
| $p = \frac{{{p_0}{R_0}{\mathcal{R}_{12}}\exp [{\rm{i}}\omega t - {\rm{i}}k({R_1} + {R_2})]}}{{{R_1} + {R_2}}}$ | (23) |
The scattered sound intensity depends on the Root Mean Square(RMS),height h,and the correlation of the nearby surface displacement within the insonified area. Equation(23)can be used to compute the covariance
| $ {p^*} = \int\limits_S {P{{\left( {x,y,\tau } \right)}^*}} {\rm{exp}}\left( {2i\gamma \xi } \right){\rm{d}}S $ | (24) |
| $p\left( {\xi ,\eta ,\tau '} \right) = \int\limits_S {P\left( {x',y',\tau '} \right)} {\rm{exp}}\left( { - 2i\gamma \xi '} \right){\rm{d}}S' $ | (25) |
Therefore,the covariance of the scattered pressure is
| $pp_{{\rm{scat}}}^* = {\int\limits_S {\int\limits_S {P\left( {x,y,\tau } \right)} } ^*}P\left( {x',y',\tau '} \right)\exp \left[ {2{\rm{i}}\gamma \left( {\xi - \xi '} \right)} \right]{\rm{d}}S{\rm{d}}S'$ | (26) |
The effect of surface on the incident sound is defined by the expression inside < > ,which is called the characteristic function,w,and represents the rough surface term
| $ w = {\rm{exp}}\left[ {2{\rm{i}}\gamma (\xi - \xi ')} \right] = \int\limits_{ - \infty }^\infty {\int\limits_{ - \infty }^\infty {{w_2}{\rm{exp}}\left[ {2{\rm{i}}\gamma (\xi - \xi ')} \right]{\rm{d}}\xi {\rm{ d}}\xi } } $ | (27) |
where w2 is the bivariate Probability Density Function(PDF),which depends on both the PDF at a point and the correlation of the surface heights,C(ξ,η),between the points,as in
| ${w_2}(x,y,x + \xi ,y + \eta ) \equiv {\left[ {2{\rm{\pi }}{h^2}{{\left( {1 - {C^2}} \right)}^{\frac{1}{2}}}} \right]^{ - 1}}\exp \left\{ { - \frac{{\xi _1^2 + \xi _2^2 - 2{\xi _1}{\xi _2}C}}{{2{h^2}(1 - {C^2})}}} \right\}$ | (28) |
where
| $C = \frac{{{\xi _1}{\xi _2}}}{{{h^2}}}$ | (29) |
In addition,the beam geometry term is expressed as
| $\mathcal{G}\exp \left( {2{\rm{i}}\alpha \xi + 2{\rm{i}}\beta \eta } \right)$ | (30) |
where
| ${\mathcal{G}} \equiv \exp ( - {s_\xi }{\xi ^2} - {s_\eta }{\eta ^2})$ | (31) |
in which aξ and aη are defined as
| ${a_\xi } = \frac{{{X^2}}}{{2x_f^4}} + \frac{1}{{2{X^2}}}$ | (32) |
| $ {a_\eta } = \frac{{{Y^2}}}{{2y_f^4}} + \frac{1}{{2{Y^2}}}$ | (33) |
Hence,the equation of the mean-squared scattered pressure from bubbly ocean water is
| $p{p^*} = p_0^2R_0^2\frac{{\mathcal{R}_{13}^2{K^2}{G^2}(\theta )A{{\rm{e}}^{{\rm{i}}\omega \tau }}}}{{8{{\rm{\pi }}^2}R_1^2R_2^2}}\int {\int\limits_{ - \infty }^\infty {\begin{array}{*{20}{c}} {{\rm{\mathcal{GW}}}{{\rm{e}}^{2{\rm{i}}\left( {\alpha \xi + \beta \eta } \right)}}} \end{array}{\rm{d}}\xi {\rm{ d}}\eta } } $ | (34) |
where A=πXY is the insonified area. Eq.(34)can be written in a simpler form as
| $p{p^*} = p_0^2R_{\rm{0}}^{\rm{2}}\frac{A}{{R_1^2R_2^2}}S$ | (35) |
where S is the scattering coefficient given by
| $S = \frac{{\mathcal{R} _{13}^2{K^2}{G^2}(\theta )A{{\rm{e}}^{{\rm{i}}\omega \tau }}}}{{8{{\rm{\pi }}^2}}} \times \int {\int\limits_{ - \infty }^\infty {\begin{array}{*{20}{c}} {{\rm{\mathcal{GW}}}{{\rm{e}}^{2{\rm{i}}\left( {\alpha \xi + \beta \eta } \right)}}} \end{array}{\rm{d}}\xi {\rm{ d}}\eta } } $ | (36) |
Obtained in decibels,S is commonly used with 10 times the logarithm of the surface scattering strength as in
| $ {\rm{SS}} = {\rm{1}}0\lg S $ | (37) |
Until this point,the required relations for calculating the scattering strength have been described. It has also been explained that it is possible to modify the HKF method by modifying the reflection coefficient in the HKF integral. In addition,through considering the extended HN model for the sub-surface bubble population,the previously introduced SSAS algorithm has been modified. It is now possible to use the MSSAS to obtain the scattered sound characteristics. The MSSAS algorithm,with the aim of finding scattered sound features,is illustrated in Fig. 6. In this model,calculations can be made in two parallel processes; in the first process(left side steps of Fig. 6)sound speed in bubbly water and bubbly water density are calculated. As a result,the reflection coefficients of,R12,R23,and R13 for a three phase environment can be obtained. In the second process(right side steps of Fig. 6),the required parameters–such as rough surface correlations–are found and used to obtain W in Eq.(34). The obtained data can then be used to solve Eqs.(16)and(36),and subsequently the scattered pressure can be computed in a water medium. In addition,other scattered sound parameters such as the scattering strength coefficient,pressure level in decibels,and sound intensity can be computed.

|
| Figure 6 Algorithm of MSSAS method |
To simulate the effects of sea surface on sound propagation,the recently introduced software known as the Sea Surface Acoustical Simulator(SSAS)was improved and named the Modified SSAS(MSSAS). Input data for the MSSAS are shown in Table 1. Source characteristics and environmental conditions are two different types of data given to the MSSAS by the user. Source pressure in Pascals(in a range 1 m from the source)is one of the important factors used to determine the produced sound intensity. Low frequency and high frequency sounds have different behaviors,and are therefore generally examined separately. In addition,bubble resonant frequency and sound propagation range are different at various frequency ranges; therefore,source location relative to the sea surface and its frequency are important factors in the properties of scattered sound. In addition,the resonance frequency of bubble populations is directly related to the incident sound frequency and may cause significant variations in scattered sound features,such as scattering strength. Furthermore,sound may hit the sea surface at different incident angles,and this factor is another variable on which the scattering strength directly depends(Medwin and Clay,1998). Wind speed,root mean square of wave height,domain size,and the physical properties of air and water help to determine the environmental conditions within the sea’s surface,such as sea surface roughness and sub-surface bubble populations. Wind speed affects the bubble populations through producing breaking waves and determines the level of sea surface roughness.
| Source characteristics | Environmental conditions |
| Wind speed/ (m·s-1) | |
| Source pressure at range 1 m | RMS wave height/ m |
| /Pascal | Domain size in x, y, z |
| Source frequency /Hz | directions (Fig. 2) |
| Source depth /m | Air density/(kg·m-3) |
| Incident angle /rad | Water density/(kg·m-3) |
| Sound speed in air/ (m·s-1) | |
| Sound speed in water/(m·s-1) | |
| Water viscosity |
As previously mentioned,it is considered that the bubbly medium affects the attenuation of the entering sound. In addition,the irregular boundaries of the bubble plumes may actually affect the pattern of the scattered sound from the sea surface. However,in the current study the effects of bubbles on the scattering pattern are neglected; the volumetric effects of bubbles on sound attenuation,which affect scattering strength,are considered to be important.
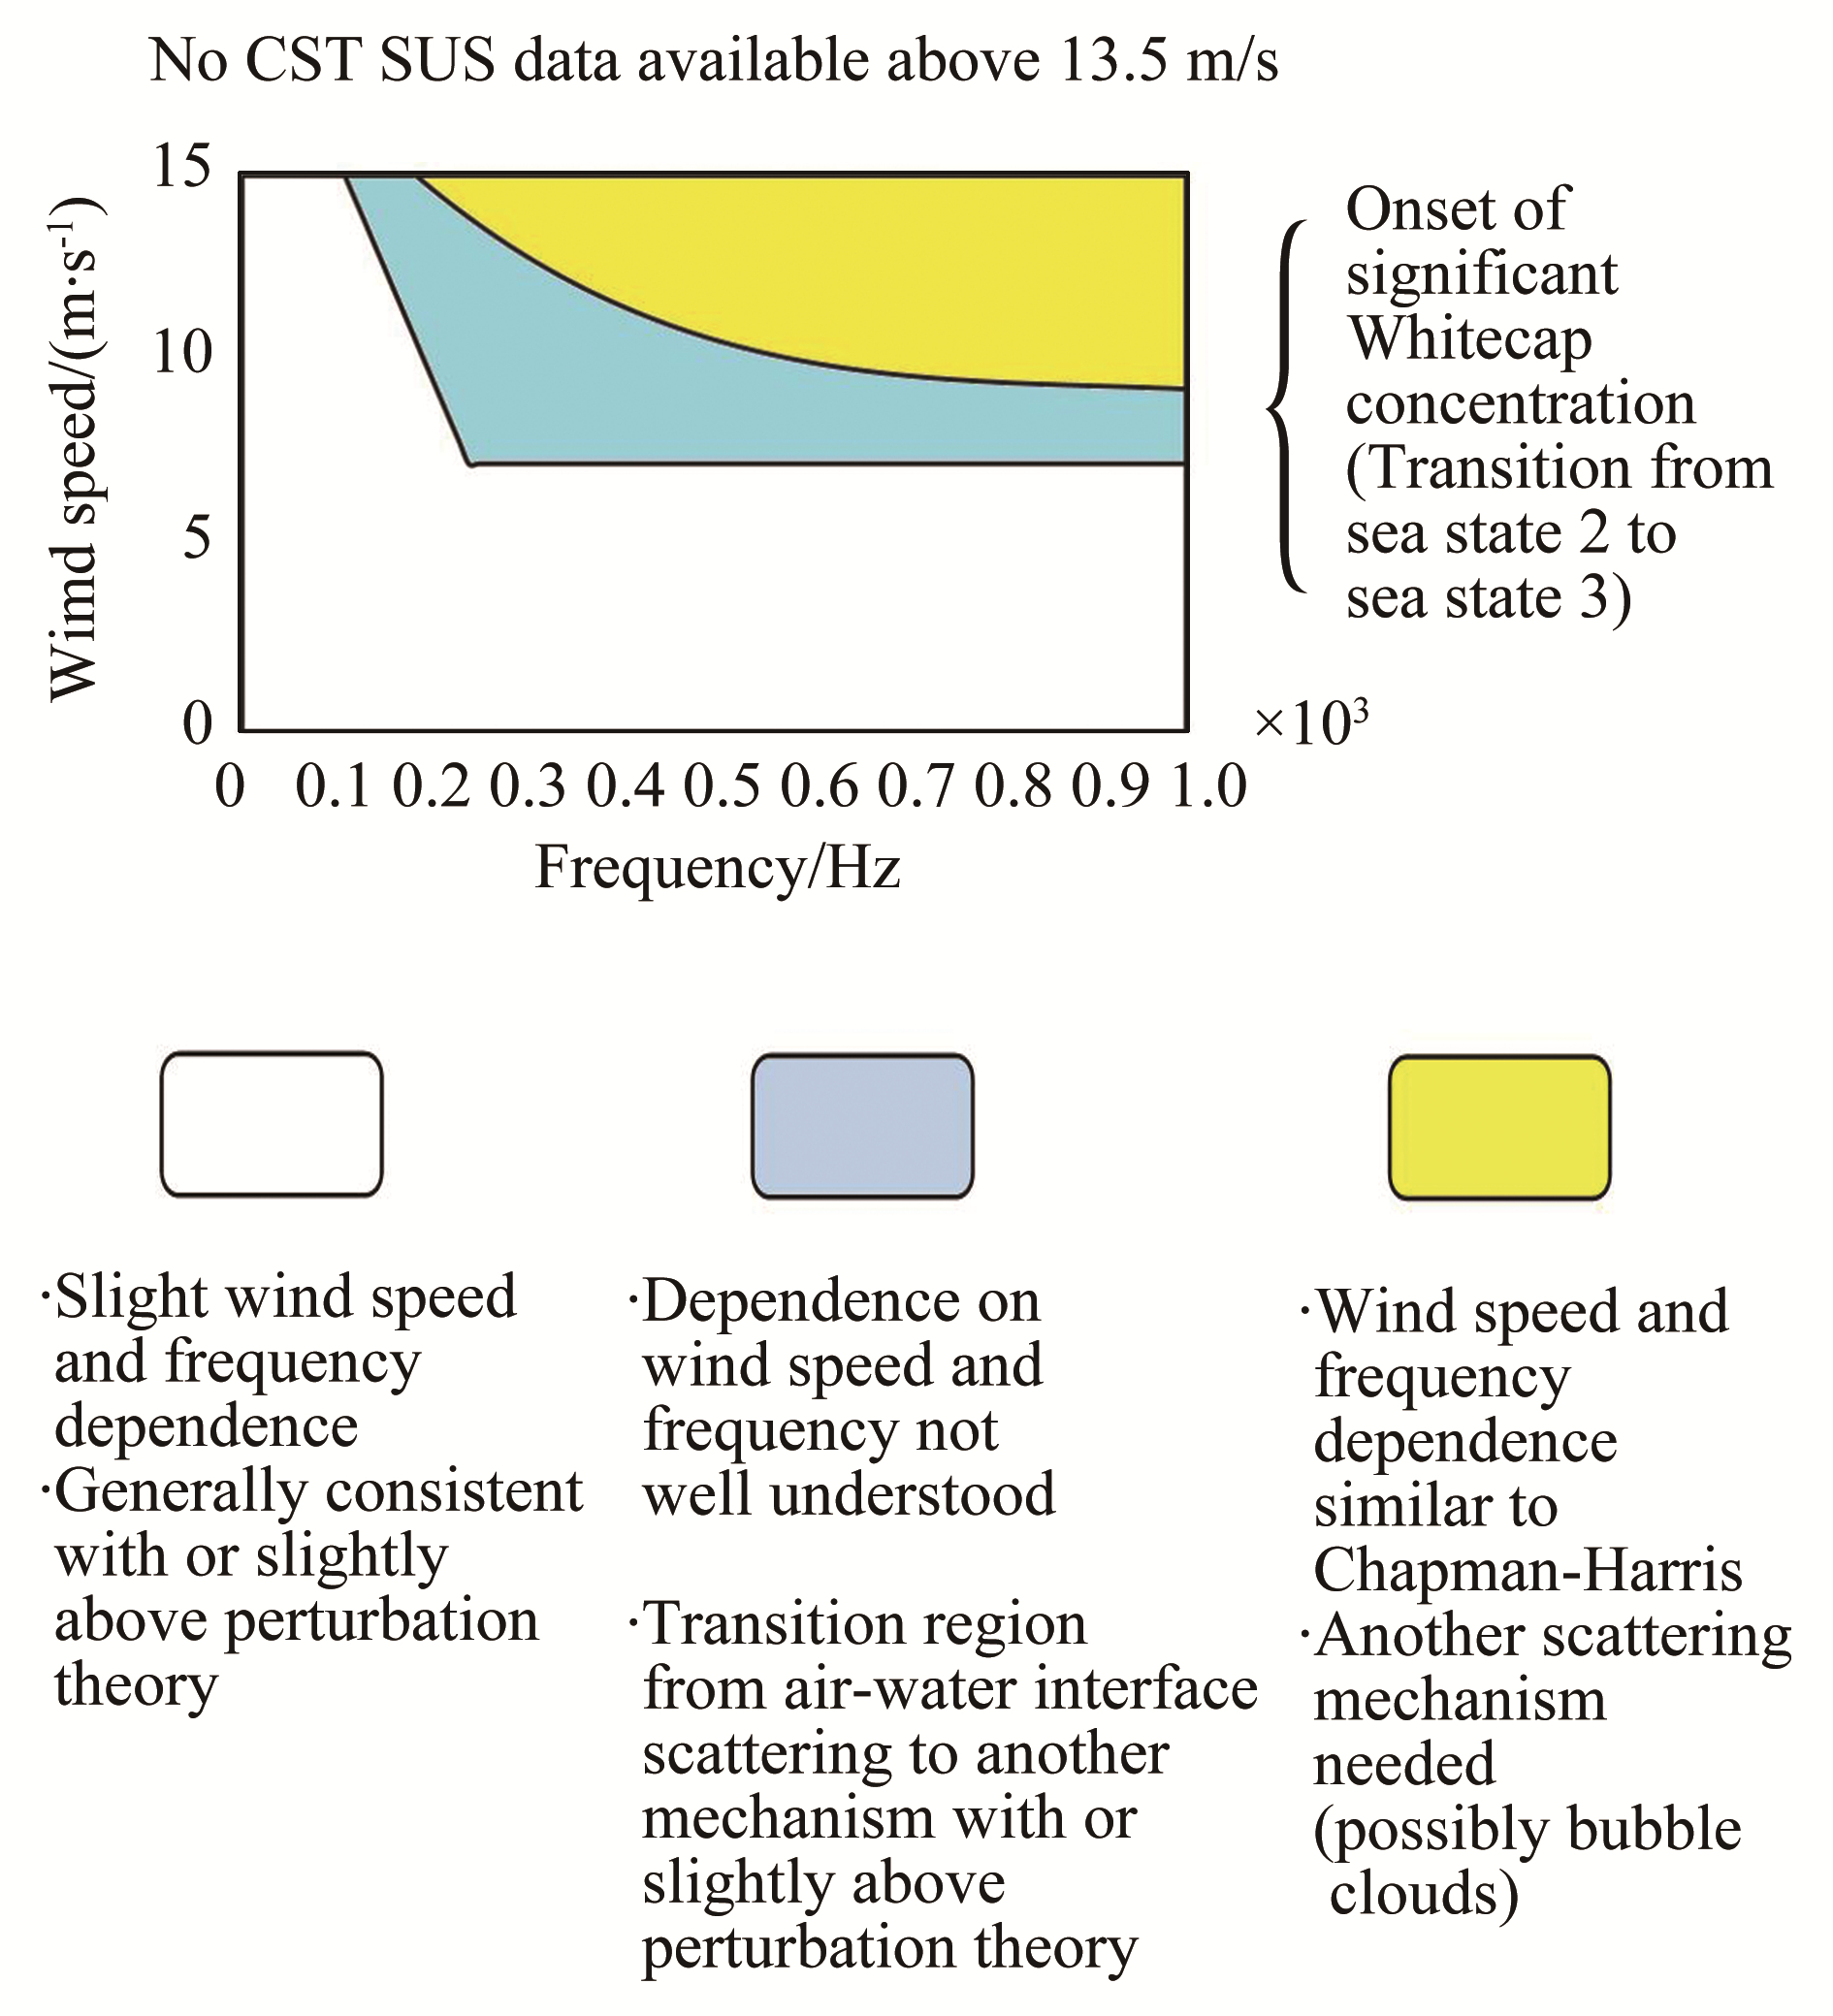
To validate results of the MSSAS,the results of CST experiments(Ogden and Erskine,1994a; 1994b)are used. Extensive measurements at a low-frequency(70–1000 Hz)sea surface backscattering strength were made as part of the Critical Sea Tests(CST)4 and 7 experiments by Ogden and Erskine(1994a,1994b). Ogden and Erskine(1994a)concluded that there are two different distinct mechanisms in surface scattering. The first mechanism occurs at a wind speed less than 7 m/s,where scattering strengths are generally consistent with perturbation theory. Furthermore,at lower frequencies the validity of perturbation theory appears to be extended to successively higher wind speed,as frequency decreases.
The second mechanism occurs at wind speeds above 10 m/s and frequencies above 500 Hz,in which the CST7 data have wind speed and frequency dependencies that are similar to those of Chapman-Harris(CH)(Chapman and Harris,1962). Although these two mechanisms are fairly well-defined(Fig. 7)(Ogden and Erskine,1994a),they are separated by a transition region in which scattering strengths are not very consistent with the trends of either the CH or perturbation theory. For example,at low wind speeds(below about 7 m/s)and frequencies between 250 Hz and 1 kHz,or for lower frequencies(below 250 Hz)at somewhat higher wind speeds,the scattering is primarily from the rough air-water interface,whereas at high wind speeds above 10 m/s and frequencies from about 500 Hz to 1 kHz the scattering is dominated by subsurface bubble scatter(Ogden and Erskine,1994a; 1994b). In this region,scattering from the air-water interface appears to play a minor role. However,in the transition domain,both scattering mechanisms may contribute to the scattering strength variation(Ogden and Erskine,1994a),and it is therefore necessary to suggest a method that is capable of including the effects of both mechanisms. As previously mentioned,the MSSAS involves both scattering mechanisms. The characteristic function(𝒲 in Eq.(27))representing the roughness of air-water can be estimated using the bivariate Gaussian PDF,
|
| Figure 7 Frequency–wind speed (f–U) domain for sea-surface scattering strengths Ogden and Erskine (1994b) |
| $\mathcal{W} = \exp [ - 4{\gamma ^2}{h^2}\left( {1 - C\left( {\xi ,\eta } \right)} \right)]$ | (38) |
where C(ξ,η)is the spatial correlation function. According to Eq.(38),it can be concluded that there is as an inverse relationship between characteristic function and wave height,while the spatial correlation function depends on wave number. If wave height is considered as a function of wind speed through using Pierson-Moskowitz spectrum,there will be a direct relationship between the rms wave height and wind speed. Therefore,in higher sea states and wind speeds,wave height rms will increase and cause a reduction in the amount of the characteristic function. However,scattering variations due to rough sea surface will decrease(Eq.(34)),which agrees with Ogden and Erskine(1994a,1994b)in relation to the second mechanism. In addition,since bubbles are wind generated in the MSSAS approach,wind speed as an environmental factor affects bubble populations. Based on Eq.(10),it can be concluded that at higher wind speeds,the bubble populations as a result of breaking waves exhibit a growth that is in good agreement with the second mechanism,as concluded by Ogden and Erskine(1994a; 1994b). In contrast,wind speed reduction causes a reduced bubble cloud population and thus the bubble cloud plays a minor role in the scattering of sound. In addition,a reduction in wind speed results in a shorter wave height rms,which increases the value of the characteristic function. Therefore,scattering will be more affected by the rough air-water interface than the effect of bubbles,and this procedure also agrees with the first mechanism of Ogden and Erskine(1994a; 1994b).
In the transition domain,which is more challenging,both bubble populations and the rough surface contribute to scattering variations through the MSSAS,because in the MSSAS both variables have their own effects(according to the defined source and environmental conditions)on the scattering of sound.
In order to validate the results of the MSSAS,two different runs from CST7 experiments are chosen,and a summary of these is shown in Table 2. The information presented in Table 2 was used as input data for the MSSAS. Previously,van Vossen and Ainslie(2011)thoroughly discussed the possibility of calculating the bubble population in CST experiments based on Eq. 4,and their results for the bubbly medium are therefore considered in the current study.
| Run | Receiver depth / m | Estimated SUS detonation depth / m |
Average wind speed /(m∙s-1) |
Relative wind direction / (°) |
Significant wave height / m |
Estimated sea state |
| 3C | 160 | 540 | 15.0 | 158 | 3.0 | 4 |
| 25D | 177 | 550 | 3 | 269 | 2.2 | 2 |
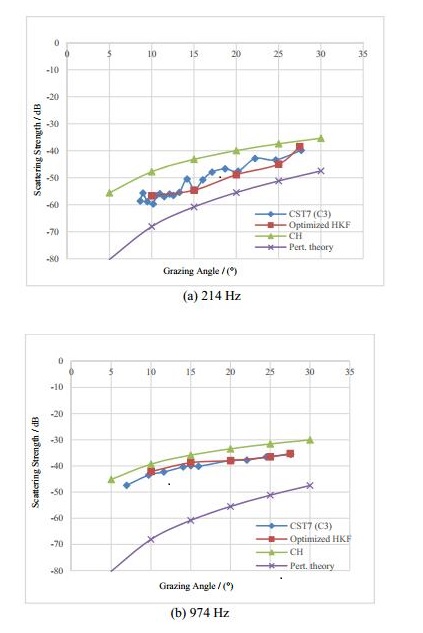
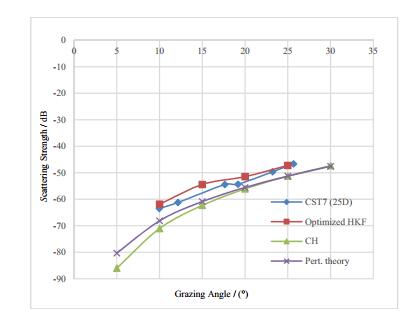
In Fig. 8,the results of scattered strengths by the MSSAS are compared against data available for CST7(C3),CH,and perturbation theories. Frequency and wind speed for the C3 run are located in the domain of the first mechanism and therefore bubbles have a major effect on scattering. Values of the scattering strength in the MSSAS method and CST7(C3)fall between perturbation theory and the CH results; curves have similar trends and all results reduce as the grazing angle increases. The results of the MSSAS and CST7(C3)in Fig. 8(b),which are compared with curves at a frequency of 214 Hz in Fig. 8(a),are closer to the CH results. Figures 9 and 10 show the scattering results of MSSAS,CST7(25D),perturbation and CH theories. The wind speed in CST7(25D)is 3 m/s and has a frequency of 218 Hz,thus representing the second mechanism(Fig. 9). As mentioned earlier,in the second mechanism,the rough air-sea interface is dominant and has major effects on scattering. In the second mechanism,the perturbation method is more accurate(Ogden and Erskine,1994a).
|
| Figure 8 Scattering strengths produced by MSSAS and CST7 (C3) |

|
| Figure 9 Scattering strengths produced by MSSAS and CST7 (25D) at frequency 218 Hz |
The scattering results in this domain should therefore be closer to the results of perturbation theory,and it is evident that results of the MSSAS and CST7(25D)at a frequency of 218 Hz are very close in this respect. Figure 10 represents the scattering results at a frequency of 945 Hz and with CST7(25D)conditions. Again,the domain of the second mechanism is appropriate for the mentioned conditions,and the results of perturbation theory,which are more dependent on the roughness of surface,are more precise.
|
| Figure 10 Scattering strengths produced by the MSSAS and CST7 (25D) at frequency 945 Hz |
In a sample result of the MSSAS,certain arbitrary conditions are considered where the incident sound is in the position X(0,0,-20)related to the hit point,and the sound hits the sea surface at a significant angle. Environmental and source conditions can be seen in Table 3 and 4,and Fig. 11 shows the geometry in this respect.

|
| Figure 11 Schematic of the problem |
| Source Parameters | Value |
| Source pressure at range 1 m | 1 Pascal |
| Source depth | 20 m |
| Environmental conditions / Unit | Value |
| Domain dimensions / km | 1×1×1 |
| Wind Speed / (m·s-1) | 10 |
| Significant wave height / m | 0.53 |
| Sound speed in air / (m·s-1) | 330 |
| Sound speed in water / (m·s-1) | 1470 |
| Air density / (kg·m-3) | 1.23 |
| Water density / (kg·m-3) | 1020 |
| Bubble radius / mm | > 1 |
As discussed earlier,the MSSAS is capable of producing scattered pressure levels at different incident angles. Figs. 12–17 show the scattered pressure levels in the source located planes at various frequencies and incident angles. Sub-surface bubbles in the real sea surface have various radii,which are here considered to vary in a range up to more than 1 mm. The HN model only considers a dominant bubble radius,but the extended HN model can consider various radii of bubbles that are closer to realistic conditions. The algorithm for determining the distribution of bubbles’ radii is discussed by van Vossen and Ainslie(2011)and applied by the MSSAS to consider the effects of sub-surface bubbles.

|
| Figure 12 Scattered acoustic pressure levels at frequency 100 Hz and grazing angle 90° |

|
| Figure 13 Scattered acoustic pressure levels at frequency 100 Hz and grazing angle 60° |

|
| Figure 14 Scattered acoustic pressure levels at frequency 500 Hz and grazing angle 30° |

|
| Figure 15 Scattered acoustic pressure levels at frequency 500 Hz and grazing angle 60° |

|
| Figure 16 Scattered acoustic pressure levels at frequency 1000 Hz and grazing angle 30° |

|
| Figure 17 Scattered acoustic pressure levels at frequency 1000 Hz and grazing angle 60° |
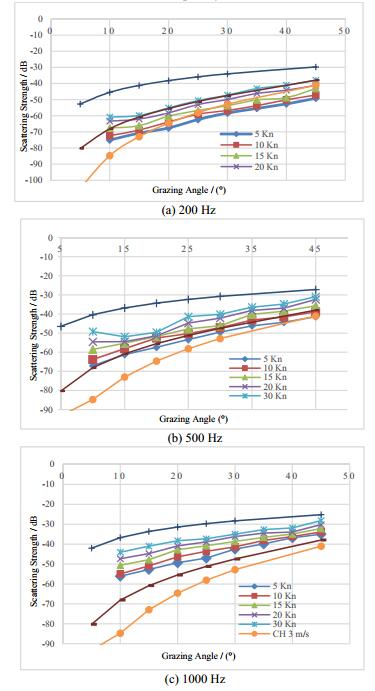
In the previous sections,the MSSAS and two different mechanisms of scattering along the transition region were explained. Results of the MSSAS method were then compared against two runs of CST7 experiments and perturbation and CH theories,in two ranges of wind speed. It was thus shown that the MSSAS has good conformance with experimental values. To examine how different parameters affect the scattering from the surface in the MSSAS,three parametric studies were performed at different frequencies and wind speeds,and the results are presented in Fig. 18. The grazing angle is an independent variable in each study. In all of these studies,source location depth and pressure in the range of 1 m to the source are 20 m and 1 Pa,respectively. Chapman-Harris’s results for maximum and minimum values of CST7 wind speeds,along with the results of perturbation theory,are shown in all three studies. Fig. 18(a)represents the scattering strengths at 200 Hz frequency at different wind speeds as a function of the grazing angle. Transition and second mechanism regions are involved depending on the wind speeds and frequency. It can be seen that almost all the results from the MSSAS method fall between CH(3 m/s)and perturbation theory curves. Although the results of 10 and 15 m/s wind speeds are located in the transition area,their scattering results are closer to perturbation theory. As described earlier,the effects of both rough surface and bubble cloud are involved in the transition area. Therefore,at these two wind speeds,and at this chosen frequency,the role of the sea surface is more dominant. Fig. 18(b)represents the scattering result at a frequency of 500 Hz,in which all existing regions are involved. Contrary to the results of the MSSAS in Fig. 18(a),all the curves related to the MSSAS results in Fig. 18(b)(except for 2.5 m/s curve)are located between CH(17.5 m/s)and perturbation theory curves. Although both Fig. 18(a)and 18(b)have the same conditions(except frequency),all curves in Fig. 18(b)are shifted compared to Fig. 18(a)curves,which demonstrates the effect of frequency. Similar to Fig. 18(b),all the curves in Fig. 18(c)are shifted compared to those of Fig. 18(a)curves,which shows the effect of frequency in the same conditions. Furthermore,all MSSAS curves tend to be more similar to the CH 17.5 m/s results as the frequency increases.
|
| Figure 18 Scattering strength in MSSAS method as a function of wind speed and grazing angle in 3 different frequencies compared with CH and perturbation method results |
The sea surface is one of the most important boundary conditions in relation to sound propagation in ocean water. It has many physical complexities which include the presence of surface waves and sub-surface bubbles. Wind speed,which causes surface waves and bubble generation,is a significant environmental parameter to be considered. In this paper,the previously introduced Sea Surface Acoustic Simulator(SSAS)is modified to consider various incident angles and sub-surface bubble radii to effectively simulate sound scattering from the sea surface. To improve the capabilities and precision of the SSAS,the Modified SSAS(MSSAS)method is presented to provide scattered pressure levels and scattering coefficients based on different input data,such as wind speed,frequency,bubble radii,and incident angles. As scattering contains two different mechanisms that are separated by a transient region,it is necessary to study the resulting data in the three mentioned regions. Such studies show that within the transition area,which is known as an ill-defined region by acousticians,both frequency and wind speed can dramatically affect sound scattering. The results of the MSSAS were compared against data available for CST7 experiments,and they were proven to be very reasonable. Comparisons also indicate that the MSSAS is valid for both scattering mechanisms and for the transition region between them. Furthermore,to illustrate the capability of this method compared with the other method for different frequencies,an analysis of wind speeds,grazing angles,and an extensive set of parametric studies was conducted. Results demonstrate that the MSSAS is able to model sound scattering from sea surface with very good detail and precision.
| Ainslie MA, 1996. Reflection and transmission coefficients for a layered fluid sediment overlying a uniform solid substrate. Journal ofthe AcousticalSociety of America, 99(2), 893–902. DOI:10.1121/1.414663 |
| Ainslie MA, 2005. Effect of wind-generated bubbles on fixed range acoustic attenuation in shallow water at 1-4 kHz. Journal of the Acoustical Society of America, 118(6), 3513–3523. DOI:10.1121/1.2114527 |
| Bass FG, 1960. Boundary conditions for the average electromagnetic field on a surface with random irregularities and with impedance fluctuations. Izv. Vuzov, Radio Fizika. 3, 3, 72–78. |
| Chapman RP, Harris JH, 1962. Surface backscattering strength measured with explosive sound sources. Journal of the Acoustical Society of America, 34(10), 1592–1597. DOI:10.1121/1.1909057 |
| Chapman RP, Scott HD, 1964. Surface Backscattering Strengths Measured Over an Extended Range of Frequencies and Grazing Angles. Journal of the Acoustical Society of America, 36(9), 1735–1737. DOI:10.1121/1.1919274 |
| Dahl PH, 2003. The contribution of bubbles to high-frequency sea surface backscatter:A 24-h time series of field measurements. Journal of the Acoustical Society of America, 113(2), 769–780. DOI:10.1121/1.1532029 |
| Dahl PH, Choi JW, Williams NJ, Graber HC, 2008. Field measurements and modeling of attenuation from near-surface bubbles for frequencies 1-20 kHz. Journal of the Acoustical Society of America, 124(3), EL163–EL169. |
| Dahl PH, Kapodistrias G, 2003. Scattering from a single bubble near a roughened air-water interface:Laboratory experiments and modeling. Journal of the Acoustical Society of America, 113(1), 94–101. DOI:10.1121/1.1519543 |
| Dahl PH, Plant WJ, Nutzel B, Schmidt A, Herwig H, Terray EA, 1997. Simultaneous acoustic and microwave backscattering from the sea surface. Journal of the Acoustical Society of America, 101(5), 2583–2995. DOI:10.1121/1.418500 |
| Deane GB, Stokes MD, 2002. Scale dependence of bubble creation mechanisms in breaking wave. Nature, 418, 839–844. DOI:10.1038/nature00967 |
| Etter PC, 2003. Underwater acoustic modeling and simulation. London and New York: Third ed. Spon Press1-18. |
| Foldy LL, 1945. The multiple scattering of waves. Physical Review, 67(3-4), 107–119. DOI:10.1103/PhysRev.67.107 |
| Garrett C, Li M, Farmer MD, 2000. The connection between bubble size spectra and energy dissipation rates in the upper ocean. Journal of Physical Oceanography, 30(9), 2163–2171. DOI:10.1175/1520-0485(2000)030 < 2163:TCBBSS > 2.0.CO; 2 |
| Gauss RC, Fialkowski JM, 1993. Measurements of the spectral characteristics of low-frequency, low-grazing-angles surface reverberation. Journal of the Acoustical Society of America, 93(4), 2299–2300. DOI:10.1121/1.406465 |
| Ghadimi P, Bolghasi A, Chekab MAF, 2015a. Low frequency sound scattering from rough bubbly ocean surface:small perturbation theory based on the Reformed Helmholtz-Kirchhoff-Fresnel method. Journal of Low Frequency Noise, Vibration and Active Control, 34(1), 49–72. DOI:10.1260/0263-0923.34.1.49 |
| Ghadimi P, Bolghasi A, Chekab MAF, 2015b. Sea surface effects on sound scattering in the Persian Gulf region based on empirical relations. Journal of Marine Science and Application, 14(2), 113–125. DOI:10.1007/s11804-015-1306-x |
| Ghadimi P, Bolghasi A, Chekab MAF, Zamanian R, 2015c. Numerical investigation of transmission of low frequency sound through a smooth air-water interface. Journal of Marine Science and Application, 14(3), 334–342. DOI:10.1007/s11804-015-1315-9 |
| Ghadimi P, Bolghasi A, Chekab MAF, Zamanian R, 2015d. A significant look at the effects of Persian Gulf environmental conditions on sound scattering based on small perturbation method. Journal of Marine Science and Application, 14(4), 413–424. DOI:10.1007/s11804-015-1332-8 |
| Ghadimi P, Bolghasi A, Chekab MAF, 2016. Acoustic simulation of scattering sound from a more realistic sea surface-consideration of two practical underwater sound sources. Journal of the Brazilian Society of Mechanical Sciences and Engineering, 38(3), 773–787. DOI:10.1007/s40430-014-0285-1 |
| Hall MV, 1989. A comprehensive model of wind-generated bubbles in the ocean and predictions of the effects on sound propagation at frequencies up to 40 kHz. Journal of the Acoustical Society of America, 86(3), 1103–1117. DOI:10.1121/1.398102 |
| Henyey FS, 1991. Acoustic scattering from ocean micro bubble plumes in the 100 Hz to 2 kHz region. Journal of the Acoustical Society of America, 90(1), 399–405. DOI:10.1121/1.401264 |
| Johnson BD, Cook RC, 1979. Bubble populations and spectra in coastal water:A photographic approach. Journal of Geophysical Research, 84(C7), 3761–3766. DOI:10.1029/JC084iC07p03761 |
| Keiffer RS, Novarini JC, Norton GV, 1995. The impact of the background bubble layer on reverberation-derived scattering strengths in the low to moderate frequency range. Journal of the Acoustical Society of America, 97(1), 227–234. DOI:10.1121/1.412990 |
| Keiffer RS, Novarini JC, Zingarelli RA, 2001. Finite-difference time domain modeling of low to moderate frequency sea-surface reverberation in the presence of a near-surface bubble layer. Journal of the Acoustical Society of America, 110(2), 782–785. DOI:10.1121/1.1383769 |
| Kuo YET, 1988. Sea surface scattering and propagation loss:review, update, and new predictions. IEEE Journal of Oceanic Engineering, 13(4), 229–234. DOI:10.1109/48.9235 |
| Kuo YET, 1992. Acoustic wave scattering from two solid boundaries at the ocean bottom:reflection loss. IEEE Journal of Oceanic Engineering, 17(1), 159–170. DOI:10.1109/48.126964 |
| Kuo YET, 1994. The perturbation characterization of reverberation from a wind-generated bubbly ocean surface-I:Theory and a comparison of backscattering strength predictions with data. IEEE Journal of Oceanic Engineering, 19(3), 368–381. DOI:10.1109/48.312913 |
| Leighton TG, 1994. The acoustic bubble. London: Academic Press300-353. |
| Leifer I, Caulliez G, de Leeuw G, 2006. Bubbles generated from wind steepened breaking waves:2. Bubble plumes, bubbles, and wave characteristics. Journal of Geophysical Research, 111(C6), C06021. DOI:10.1029/2004JC002676 |
| Leifer I, Caulliez G, de Leeuw G, 2007. Characteristics of bubble plumes, bubble-plume bubbles and waves from wind-steepened wave breaking. Journal of Marine Systems, 66(1-4), 61–70. DOI:10.1016/j.jmarsys.2006.01.011 |
| Marsh HW, 1961. Exact solution of wave scattering by irregular surfaces. Journal of the Acoustical Society of America, 33(3), 330–333. DOI:10.1121/1.1908654 |
| Medwin H, 1974. Acoustic fluctuations due to micro bubbles in the near-surface ocean. Journal of the Acoustical Society of America, 56(4), 1100–1104. DOI:10.1121/1.1903391 |
| Medwin H, Clay CS, 1998. Fundamentals of acoustical oceanography. Boston: Second ed., Academic Press289-341. |
| McDaniel ST, 1993. Sea surface reverberation:A review. Journal of the Acoustical Society of America, 94(4), 1905–1922. DOI:10.1121/1.407514 |
| Nicholas M, Ogden PM, Erskine FT, 1998. Improved empirical descriptions for acoustic surface backscatter in the ocean. IEEE Journal of Oceanic Engineering, 23(2), 81–95. DOI:10.1109/48.664088 |
| Novarini JC, Norton GV, 1994. Acoustic index of refraction in the background bubble layer of the ocean:an updated bubble spectrum and the computer program CBUBBLY. Naval Research Laboratory Report NRL/FR/7181m, 93, 93–94. |
| Ogilvy JA, 1991. Theory of Wave Scattering from Random Rough Surfaces. Adam Hilger Publication, Bristol, 109–181. |
| Ogden PM, Erskine FT, 1994a. Surface scattering measurements using broadband in the explosive charges Critical Sea Test experiments. Journal of the Acoustical Society of America, 95(2), 746–761. DOI:10.1121/1.408385 |
| Ogden PM, Erskine FT, 1994b. Surface scattering measurements using broadband in the explosive charges Critical Sea Test 7 experiments. Journal of the Acoustical Society of America, 96(5), 2908–2920. DOI:10.1121/1.411300 |
| Prosperetti A, 1977. Thermal effects and damping mechanisms in the forced radial oscillations of gas bubbles in liquids. Journal of the Acoustical Society of America, 61(1), 17–27. DOI:10.1121/1.381252 |
| Prosperetti A, Lu NQ, Kim HS, 1993. Active and Passive Acoustic Behavior of Bubble Clouds at the Ocean's Surface. Journal of the Acoustical Society of America, 93(6), 3117–3127. DOI:10.1121/1.405696 |
| van Vossen R, Ainslie MA, 2011. The effect of wind-generated bubbles on sea-surface backscattering at 940 Hz. Journal of the Acoustical Society of America, 130(5), 3413–3420. DOI:10.1121/1.3626125 |
| Verestchagina TN, Fedotovsky VS, 2009. Low frequency resonant dispersion of sound in bubble media. Acoustical Physics, 55(6), 735–740. DOI:10.1134/S1063771009060074 |
| Wu J, 1992. Individual characteristics of whitecaps and volumetric description of bubbles. IEEE Journal of Oceanic Engineering, 17(1), 150–158. DOI:10.1109/48.126963 |


