2. China Ship Scientific Research Center, Wuxi 214082, China
1 Introduction
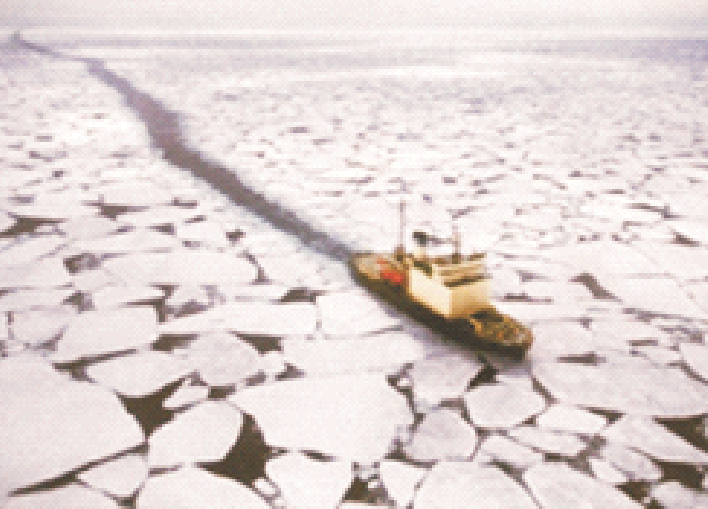
Global warming and the disappearance of Arctic sea ice in recent years has made possible the navigation of transport vessels in some Arctic regions. In these regions,the sea water is covered with pack ice in summer. Such conditions allow transport vessels to pass through independently without being led by icebreakers as shown in Fig. 1. However,the ice resistance experienced by Arctic transport vessels plays an important role in their design. Therefore,scholars have carried out a large amount of research on ice-ship interactions,including theoretical studies,numerical simulations,and model tests. For instance,Huang et al.(2015)numerically simulated the interaction between a vessel and ice. Su et al.(2011)studied the ice load on vessels during the ice-breaking process and numerically simulated the entire ice-breaking process to predict the corresponding vessel motion. Von Bock und Polach(2010)used model tests to clarify the heave and pitch motions of vessels that have a significant effect on the breaking pattern of ice and the mean and maximum resistance. Karulin and Karulina(2011)utilized a two-dimensional disk element to simulate the interaction between a moored vessel and ice floes,and compared the simulated results with those of ice tank tests.
|
| Figure 1 Ship navigating in pack ice region |
Most research work has been associated with level ice conditions(Valanto,2006; Su et al.,2014; Suominen and Kujala,2014; Hu and Zhou,2015),and thus far,only a few studies have addressed pack ice conditions. Since Arctic waters have important national strategic and economic significance,it is a matter of some urgency that model tests be performed to establish an ice-ship interaction database to provide vital inputs to the design and construction of polar vessels. In this paper,we describe a series of model tests that were performed to investigate the navigation resistance of a large transport vessel that is expected to navigate Arctic pack-ice-covered regions.
2 Model tests 2.1 Test facilitiesTests were performed in the ice tank at the Ice Engineering Laboratory of Tianjin University. The tank,which is 20 m long,5 m wide,and 1.5 m deep,is housed in an insulated room that can be cooled to an air temperature of −22°C. By varying the room’s air temperature,ice sheets can be grown,tempered,or melted. Two carriages that span the tank can travel its length. The larger main carriage is designed for loads up to 5 tons and has a speed range from 1 to 500 mm/s and is driven by a gear-rack meshing system. The smaller carriage is the service carriage,which is used to install models on the main carriage and has a speed range of 1 to 200 mm/s.
2.2 Scaling laws and test parametersSince the tests we performed were a kind of ship towing test,we used Froude and Cauchy scaling laws. The corresponding scaling factors are listed in Table 1. The geometric scaling factor λ was taken as 1:50 for our tests,by which the dimensions of the full-scale vessel were reduced to model-scale. The main dimensions of the vessel in full-and model-scale are presented in Table 2.
| Parameters | Scaling factors |
| Length | λ |
| Time | λ 1/2 |
| Velocity | λ 1/2 |
| Mass | λ 3 |
| Strength | λ |
| Ice thickness | λ |
| Elastic modulus | λ |
| Ice force | λ 3 |
| Parameters | Full-scale | Model |
| L PP / m | 259.2 | 5.184 |
| L WL / m | 274 | 5.480 |
| B WL / m | 44 | 0.880 |
| ▽/ m 3 | 145 500 | 1.164 |
| D / m | 15.55 | 0.311 |
Based on survey results from China’s fifth and sixth Arctic expeditions,we used the following target ice conditions for these tests: ice thickness of 1.6 m and flexural strength of 500 kPa. As noted above,we reduced the field ice conditions to model-scale,yielding an ice thickness of 32 mm and flexural strength of 10 kPa.
2.3 Model iceWe used urea model ice in the tests. The generation of an ice sheet was initiated at “wet seeding” and grown at a room temperature of −22°C. A certain period of time was required for the ice growth to achieve the desired ice thickness. Fig. 2 shows a piece of the generated model ice that clearly shows that its texture is dominated by a columnar structure,which is the predominant characteristic of natural ice in Arctic regions.

|
| Figure 2 Photo of a piece of the model ice |
We controlled the flexural strength of the model ice by tempering the ice sheet,and we measured the flexural strength by pushing the tips of cantilever beams in upward and downward directions and measuring the maximum force and the size of broken beams(Ashton,1986). Before each test run,we measured three cantilever beams,and the variability of their measured flexural strengths did not exceed 10%. Due to the discrete characteristic of model ice,we used the average of the measured value as the final flexural strength of the model ice.
2.4 Test procedures and conditionsWhen the ice sheet was determined to have reached the desired flexural strength,we carried out a corresponding test. Before each test run,we prepared the ice field by cutting intact level ice into many ice blocks to simulate pack ice conditions. The dimensions of the ice blocks were determined according to published Arctic vessel navigation records(Enkvist,1979),in which the ice block sizes were reported to be greater than the breadth of the vessel while inducing significant resistance. To avoid a significant boundary effect in the ice tank,the ice block sizes were kept to within one to two times the breadth of the model vessel. The resistance of a vessel in low-concentration pack ice conditions is not high since the ice floes are easily pushed aside by the vessel's motion. Therefore,in the tests,we simulated three concentrations of ice,i.e.,90%,70%,and 50%. Figs. 3 and 4 show examples of the different pack ice scenarios(70% and 90% ice concentrations)as recorded by the test videos. Tests were performed by towing the model vessel through the ice floes. The model vessel was mounted to a rigid frame using a one-direction load sensor. We used a BK-5 cantilever load sensor(1.6 kN capacity)made by the China Academy of Aerospace Aerodynamics to measure the ice forces. In the preparation phase of the model tests,the load sensor must be calibrated to obtain the conversion factors between the measured data and the ice force. We installed the rigid frame on the towing beam of the main carriage,and adjusted the connecting position of the sensor and vessel to the waterline in the vertical direction and at the center of the model along the horizontal plane. We simulated four navigating velocities(2,3,4,and 5 kn in prototype conditions)during the tests,and performed a total of twelve tests. Details of the test conditions are listed in Table 3. We prepared a total of four model ice sheets for the four navigation velocities. The broken ice channel was cleared upon the completion of the 90% ice concentration test. Then,we carried out the 70% ice concentration test,and then,similarly,the 50% ice concentration test. As such,consistency was maintained with respect to the flexural strength of the model ice and the navigation velocity.
| Test No. |
Ice thickness / mm |
V / (m·s –1) |
Flexural strength / kPa |
Ice concentration / % |
| 1 | 32 | 0.146 | 13 | 50 |
| 2 | 32 | 0.146 | 13 | 70 |
| 3 | 32 | 0.146 | 13 | 90 |
| 4 | 32 | 0.218 | 13 | 50 |
| 5 | 32 | 0.218 | 13 | 70 |
| 6 | 32 | 0.218 | 13 | 90 |
| 7 | 30 | 0.291 | 12 | 50 |
| 8 | 30 | 0.291 | 12 | 70 |
| 9 | 30 | 0.291 | 12 | 90 |
| 10 | 31 | 0.363 | 12 | 50 |
| 11 | 31 | 0.363 | 12 | 70 |
| 12 | 31 | 0.363 | 12 | 90 |

|
| Figure 3 70% ice concentration in test |

|
| Figure 4 90% ice concentration in test |
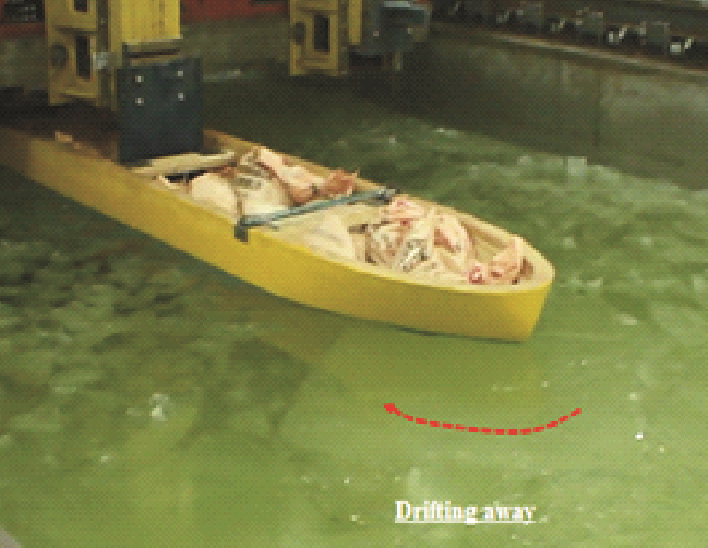
The moving and failure modes of the ice blocks are key factors in determining the total resistances as vessels navigate in pack ice conditions. Therefore,we carefully observed the status of the ice during the tests. Overall,the ice-ship interactions during the tests can be classified into two modes. In the first,the ice block was directly broken by the vessel model after making contact,as shown in Fig. 5. In the second mode,the ice blocks developed momentum and quickly drifted away from the vessel’s navigation direction without causing significant damage,as shown in Fig. 6.

|
| Figure 5 First iceship interaction mode |
|
| Figure 6 Second iceship interaction mode |
Confinement of the ice blocks is probably the major reason that different modes are induced in ice-ship interactions. As discussed above,the major difference between the two modes can be attributed to the motion of the ice blocks. Moreover,their status as moving or stationary depends on whether the ice blocks had sufficient space to drift. The concentration of the ice floes in pack ice conditions is an important factor in the status of ice. Obviously,a high ice concentration will generate highly confined conditions,such that ice blocks are obstructed from drifting away. In contrast,a clean drifting path for big ice blocks is available in low-ice concentration conditions,making the second ice-ship interaction mode easy.
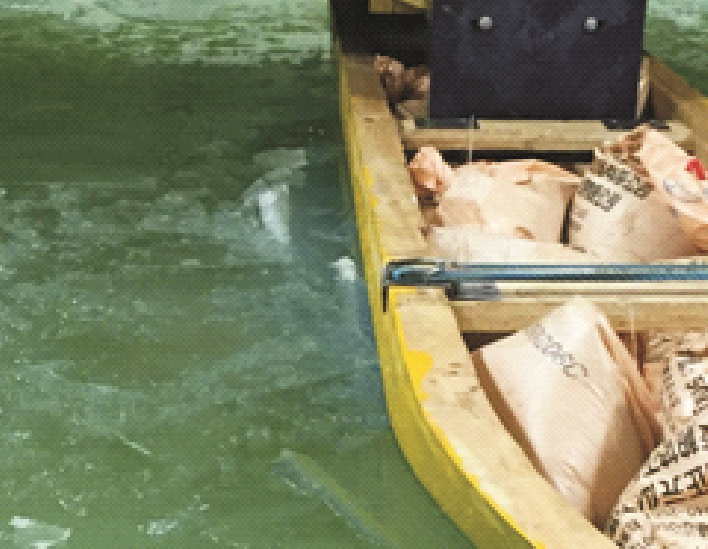
During first-mode interactions,we observed an important process. Subsequent to the ice-breaking process,rotation of big ice blocks commonly occurred at the middle of the hull. Many researchers have shown that this process can lead to a high broadside load(Tan and Riska,2014; Zhou and Riska,2013). Figs. 7 and 8 provide a comparison between the model test and field navigation scenarios,indicating that the simulations of the physical interactions well represent the field events.
|
| Figure 7 Rotation process of ice blocks |

|
| Figure 8 Rotation of huge ice block in Arctic region |
As noted above,a load sensor recorded the total resistance on the model vessel in each test. As an example,Fig. 9 shows the resistance time history in Test 1. Different interaction modes can be observed from the fluctuations in the resistance. As shown in the figure,a steep fluctuation with large amplitudes correspond to the first interaction mode. Thus,we can deduce that the navigation resistance is dominated by its interaction mode. A gentle fluctuation with small amplitudes corresponds to the second interaction mode.

|
| Figure 9 Resistance time history (0.146 m/s and 50% ice concentration) |
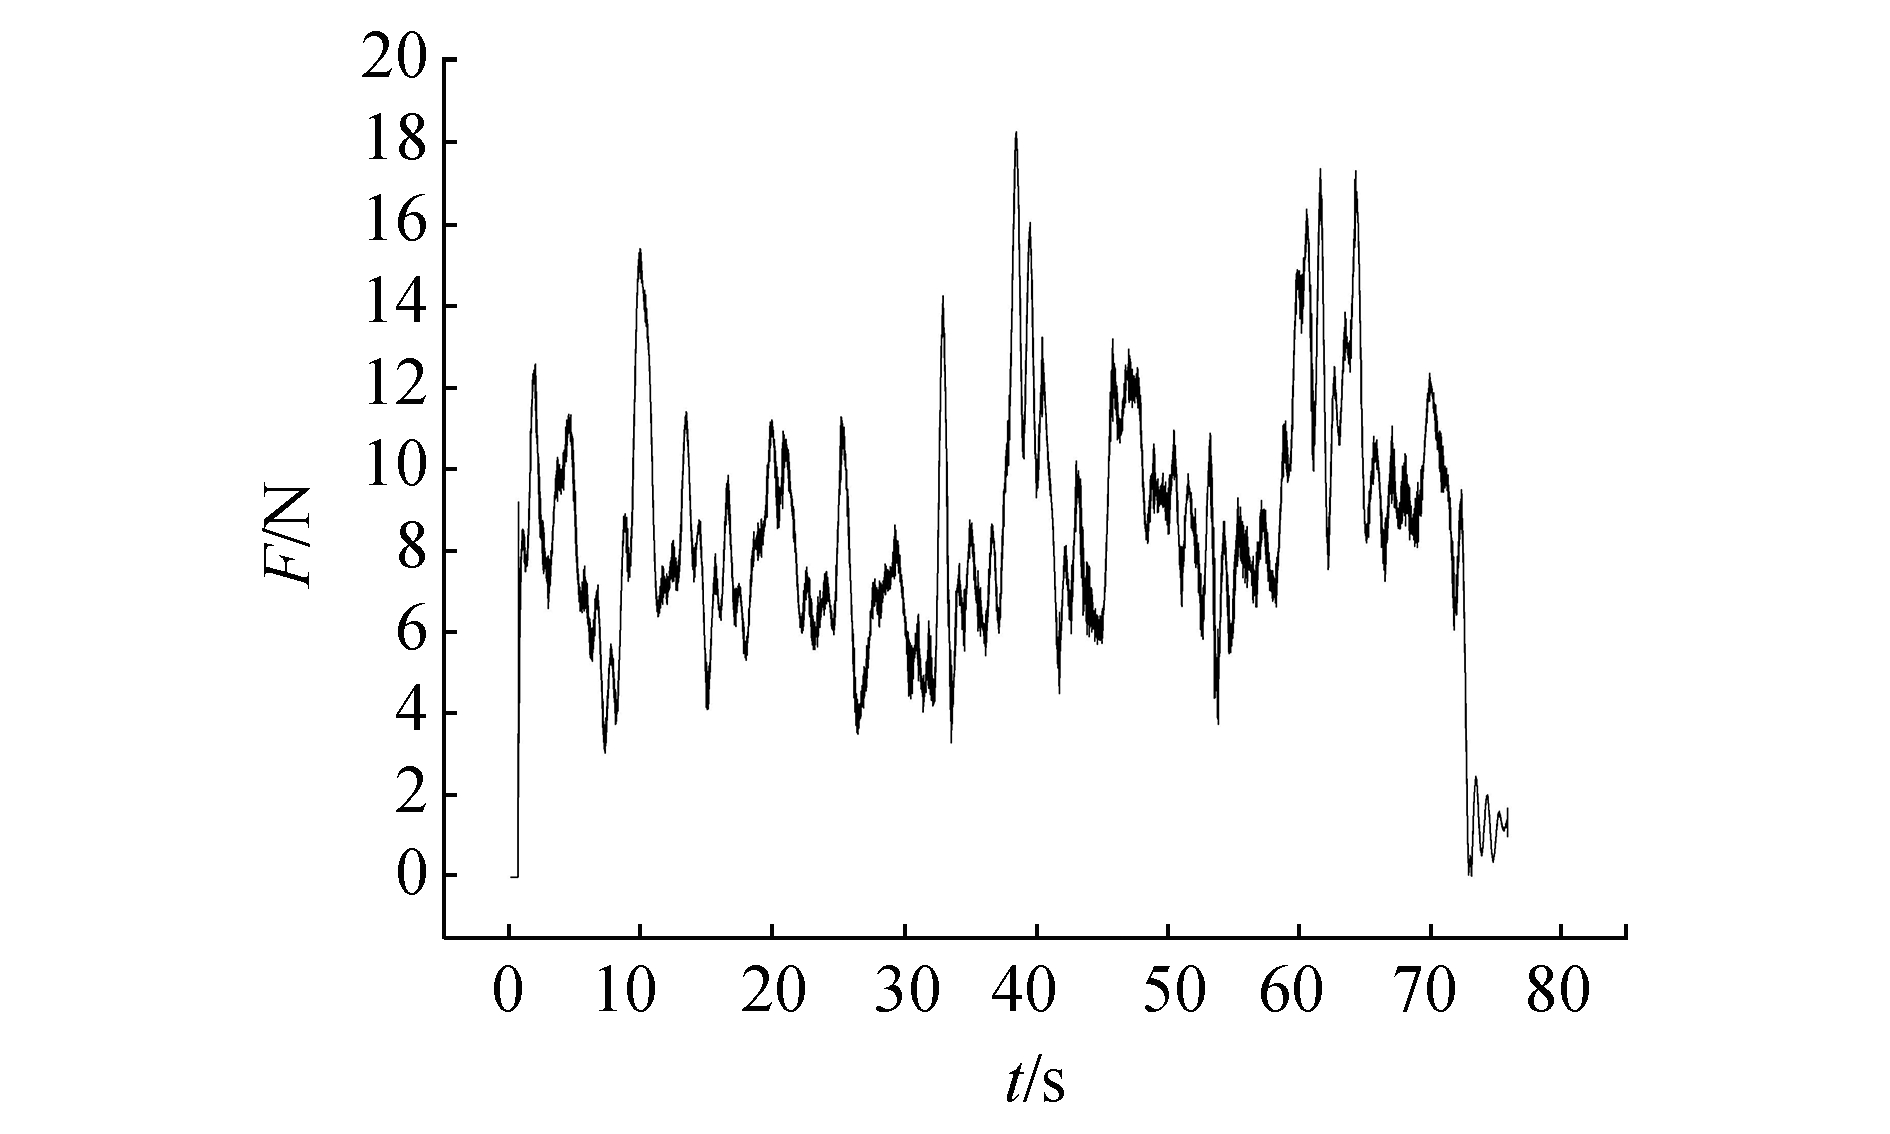
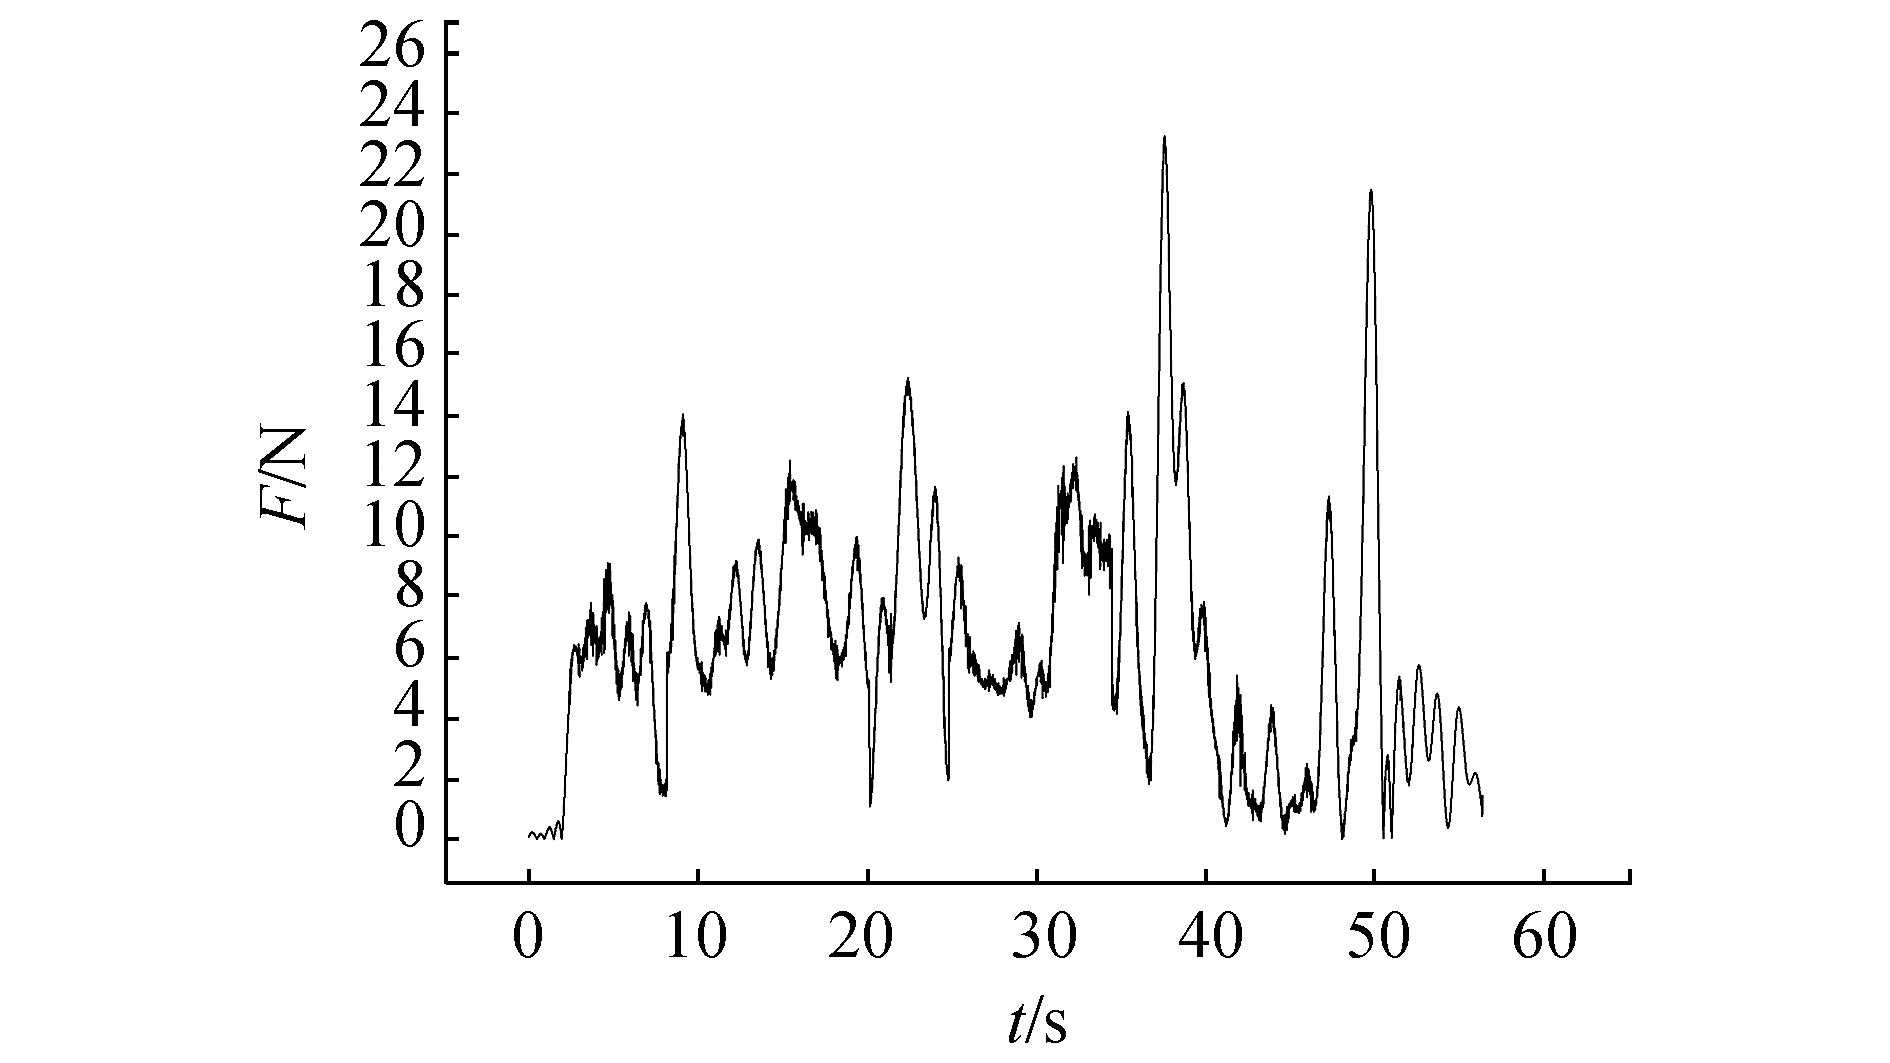
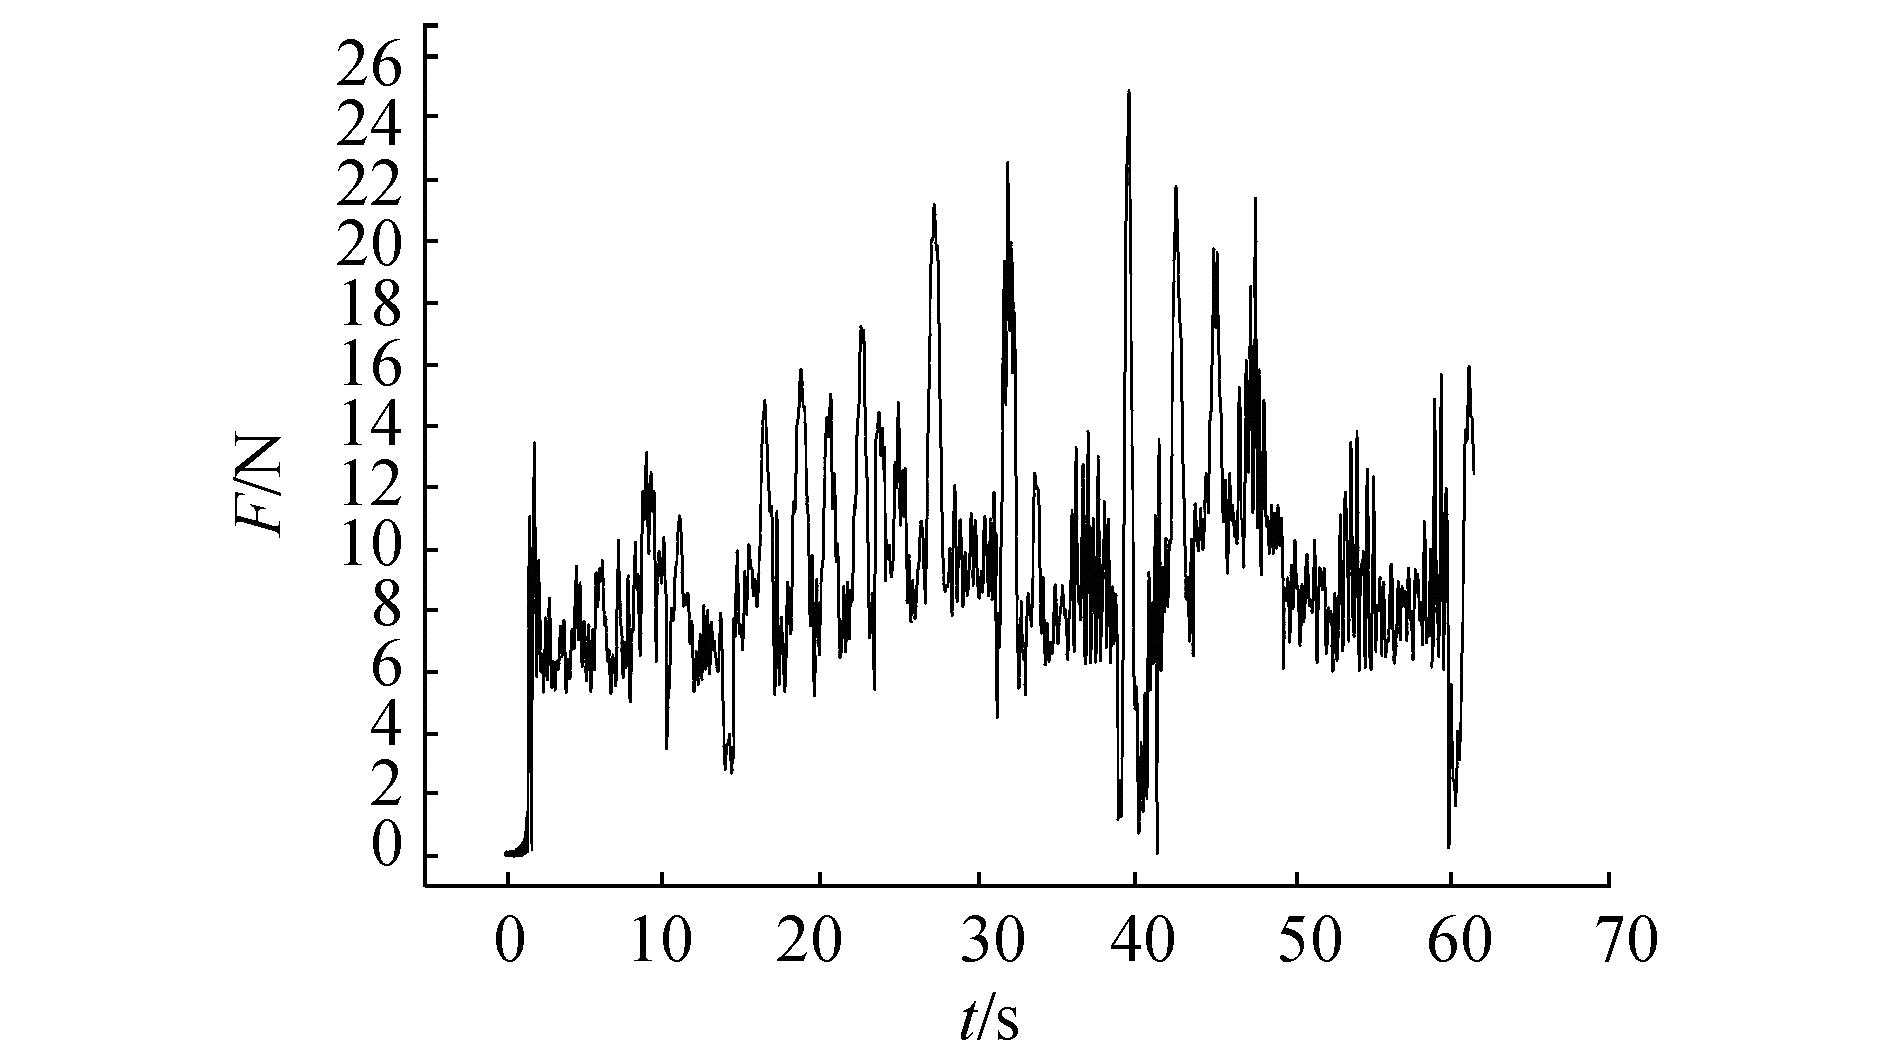
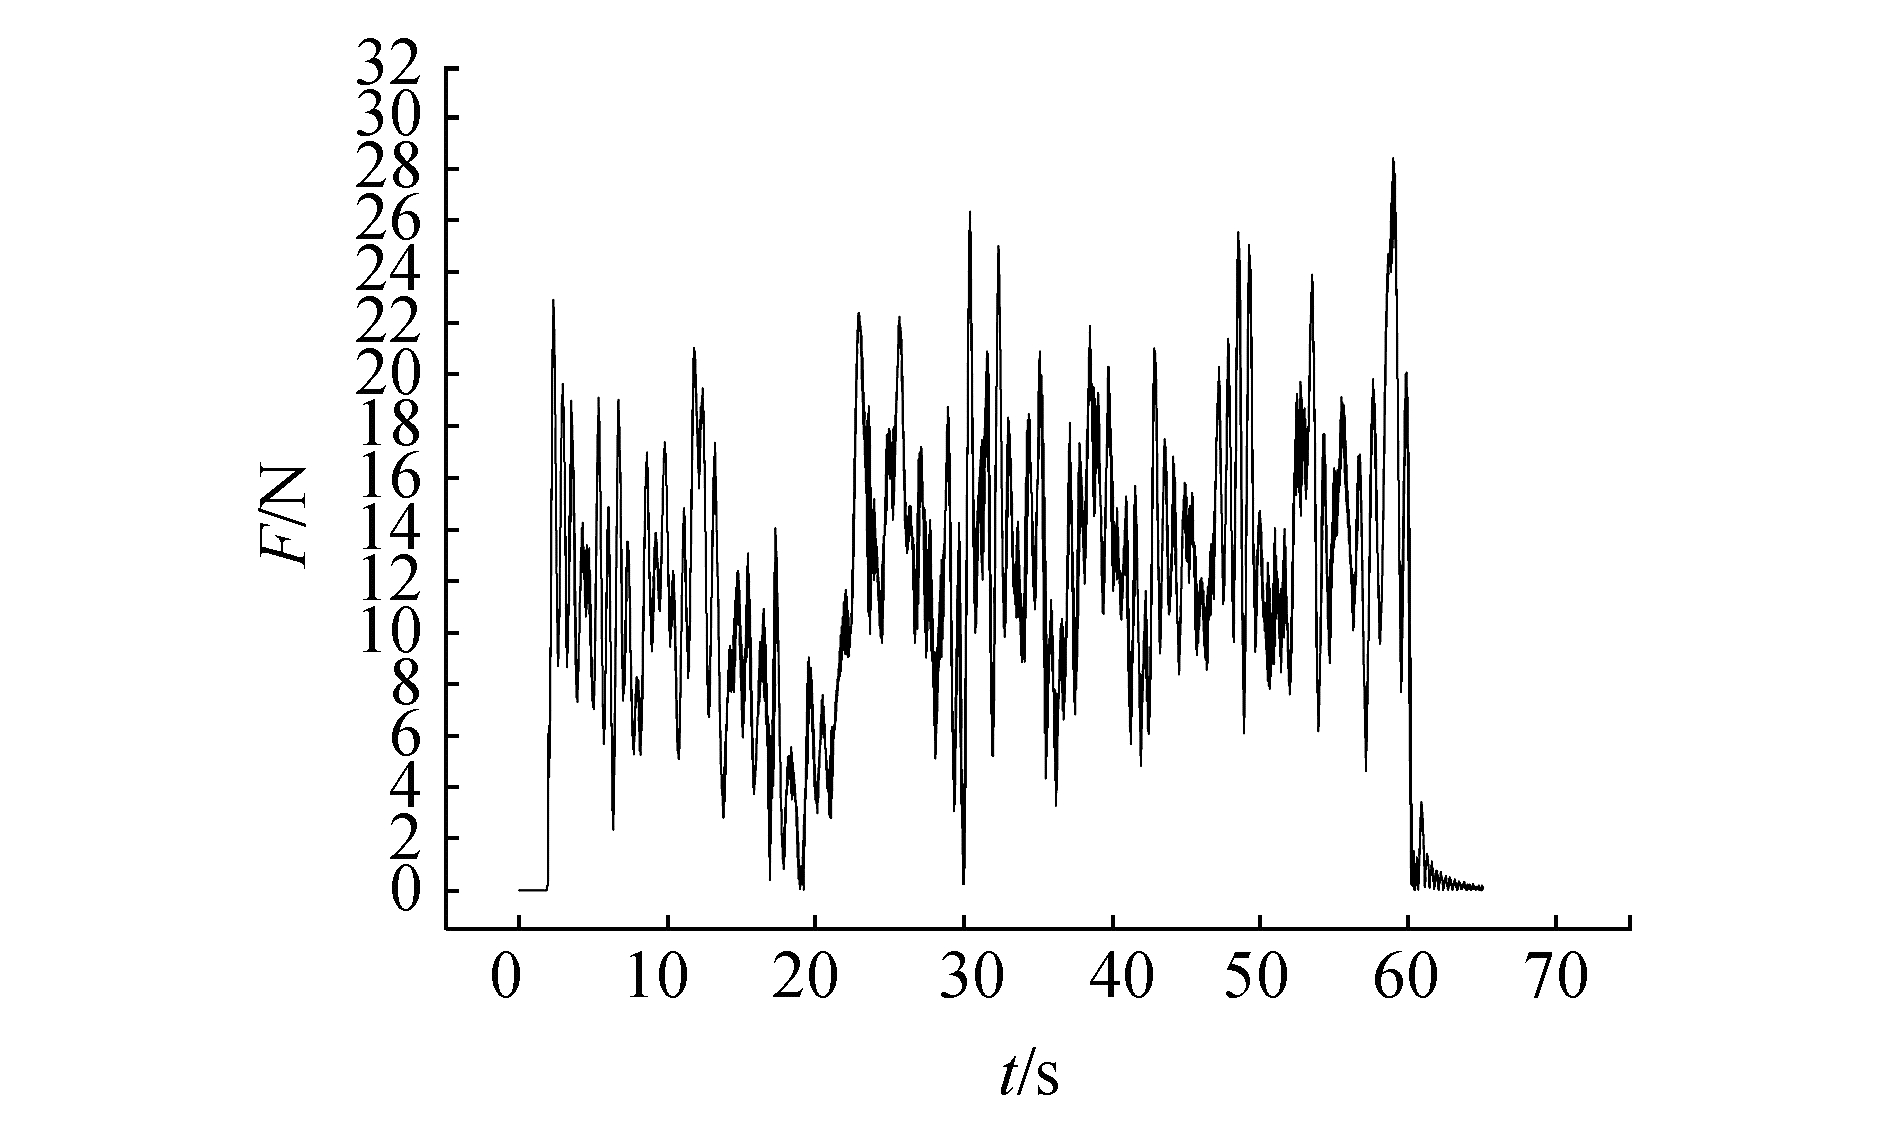
Furthermore,when the ice failure is dominated by bending,a relatively slow fluctuation of the resistance was subsequently and frequently observed. This subsequent fluctuation characteristic can be attributed to the rotation of a large ice block. Similar fluctuation characteristics can also be observed in the other test records,as shown in Figs. 10-14.

|
| Figure 10 Resistance time history (0.146 m/s and 70% ice concentration) |
|
| Figure 11 Resistance time history (0.146 m/s and 90% ice concentration) |
|
| Figure 12 Resistance time history (0.218 m/s and 50% ice concentration) |
|
| Figure 13 Resistance time history (0.218 m/s and 70% ice concentration) |
|
| Figure 14 Resistance time history (0.218 m/s and 90% ice concentration) |
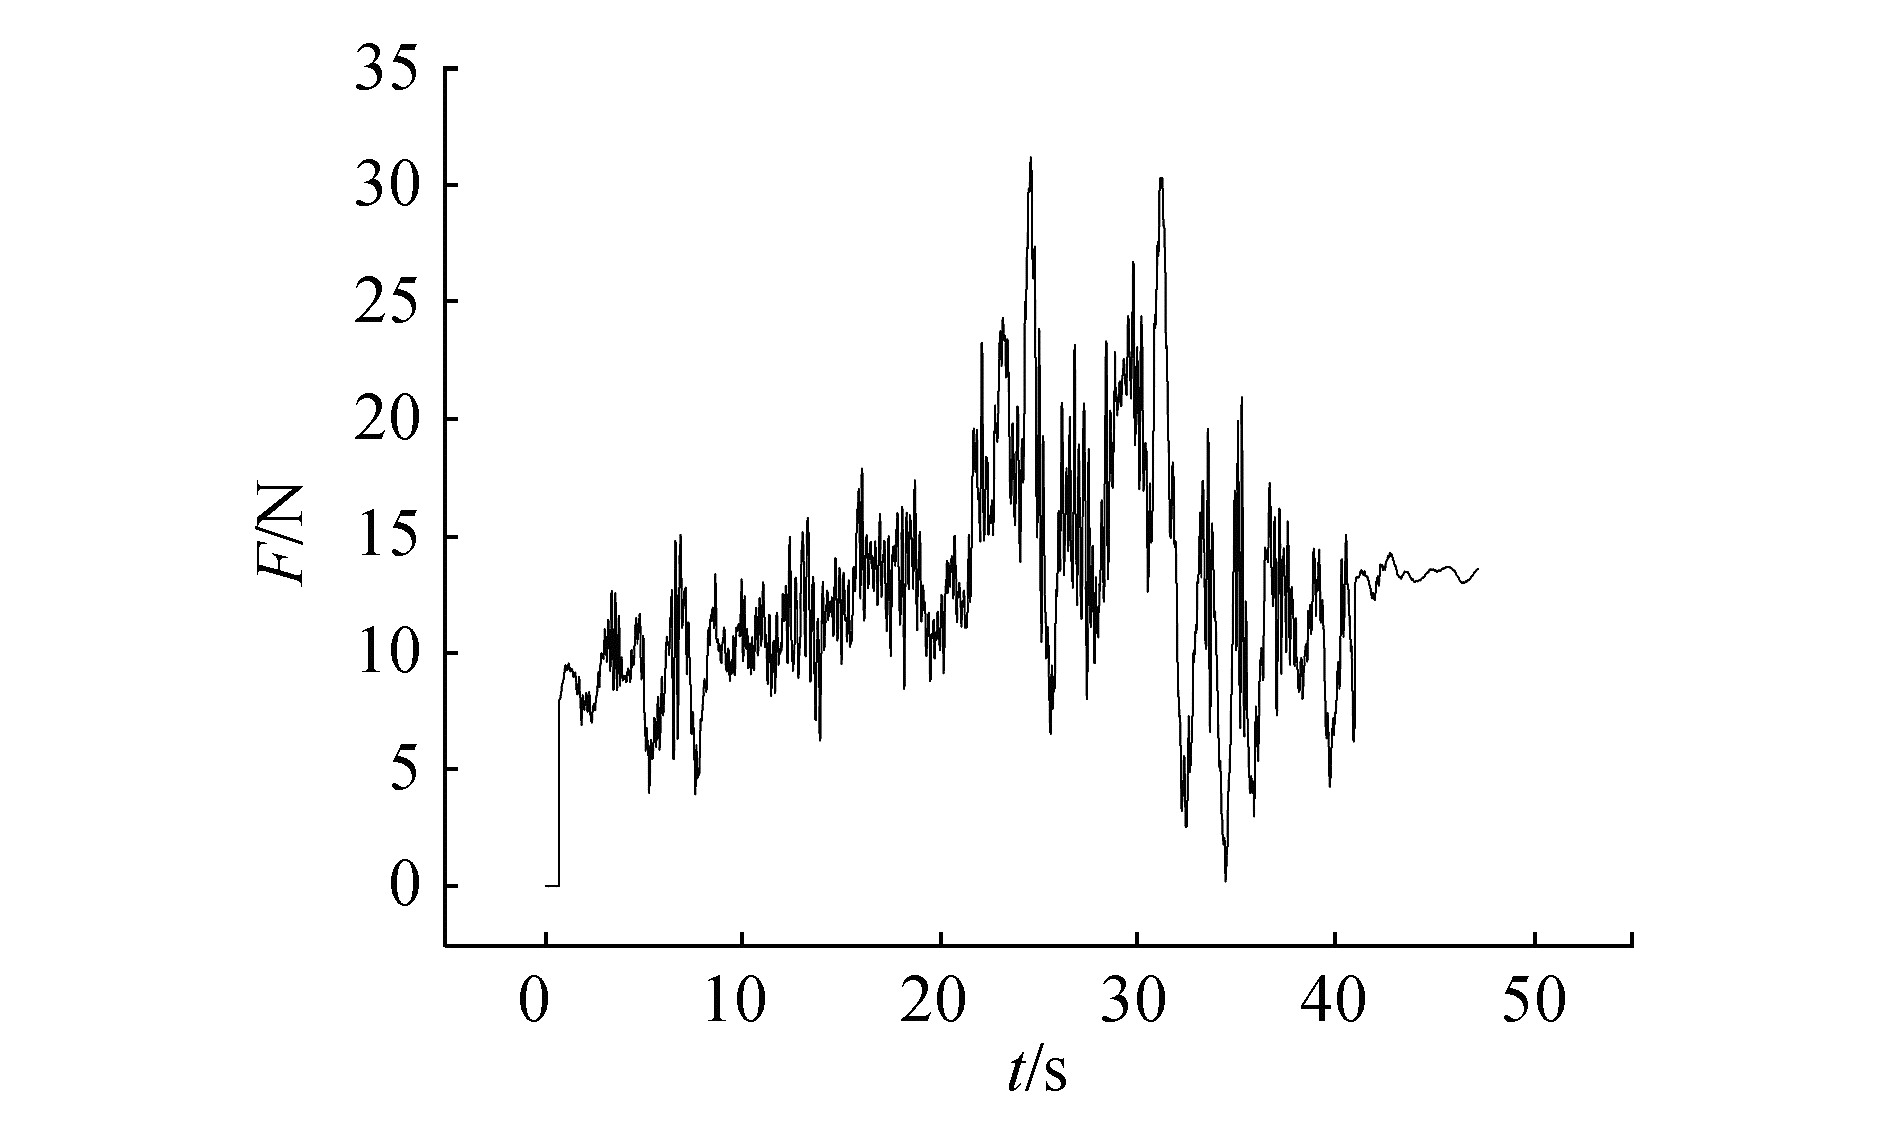
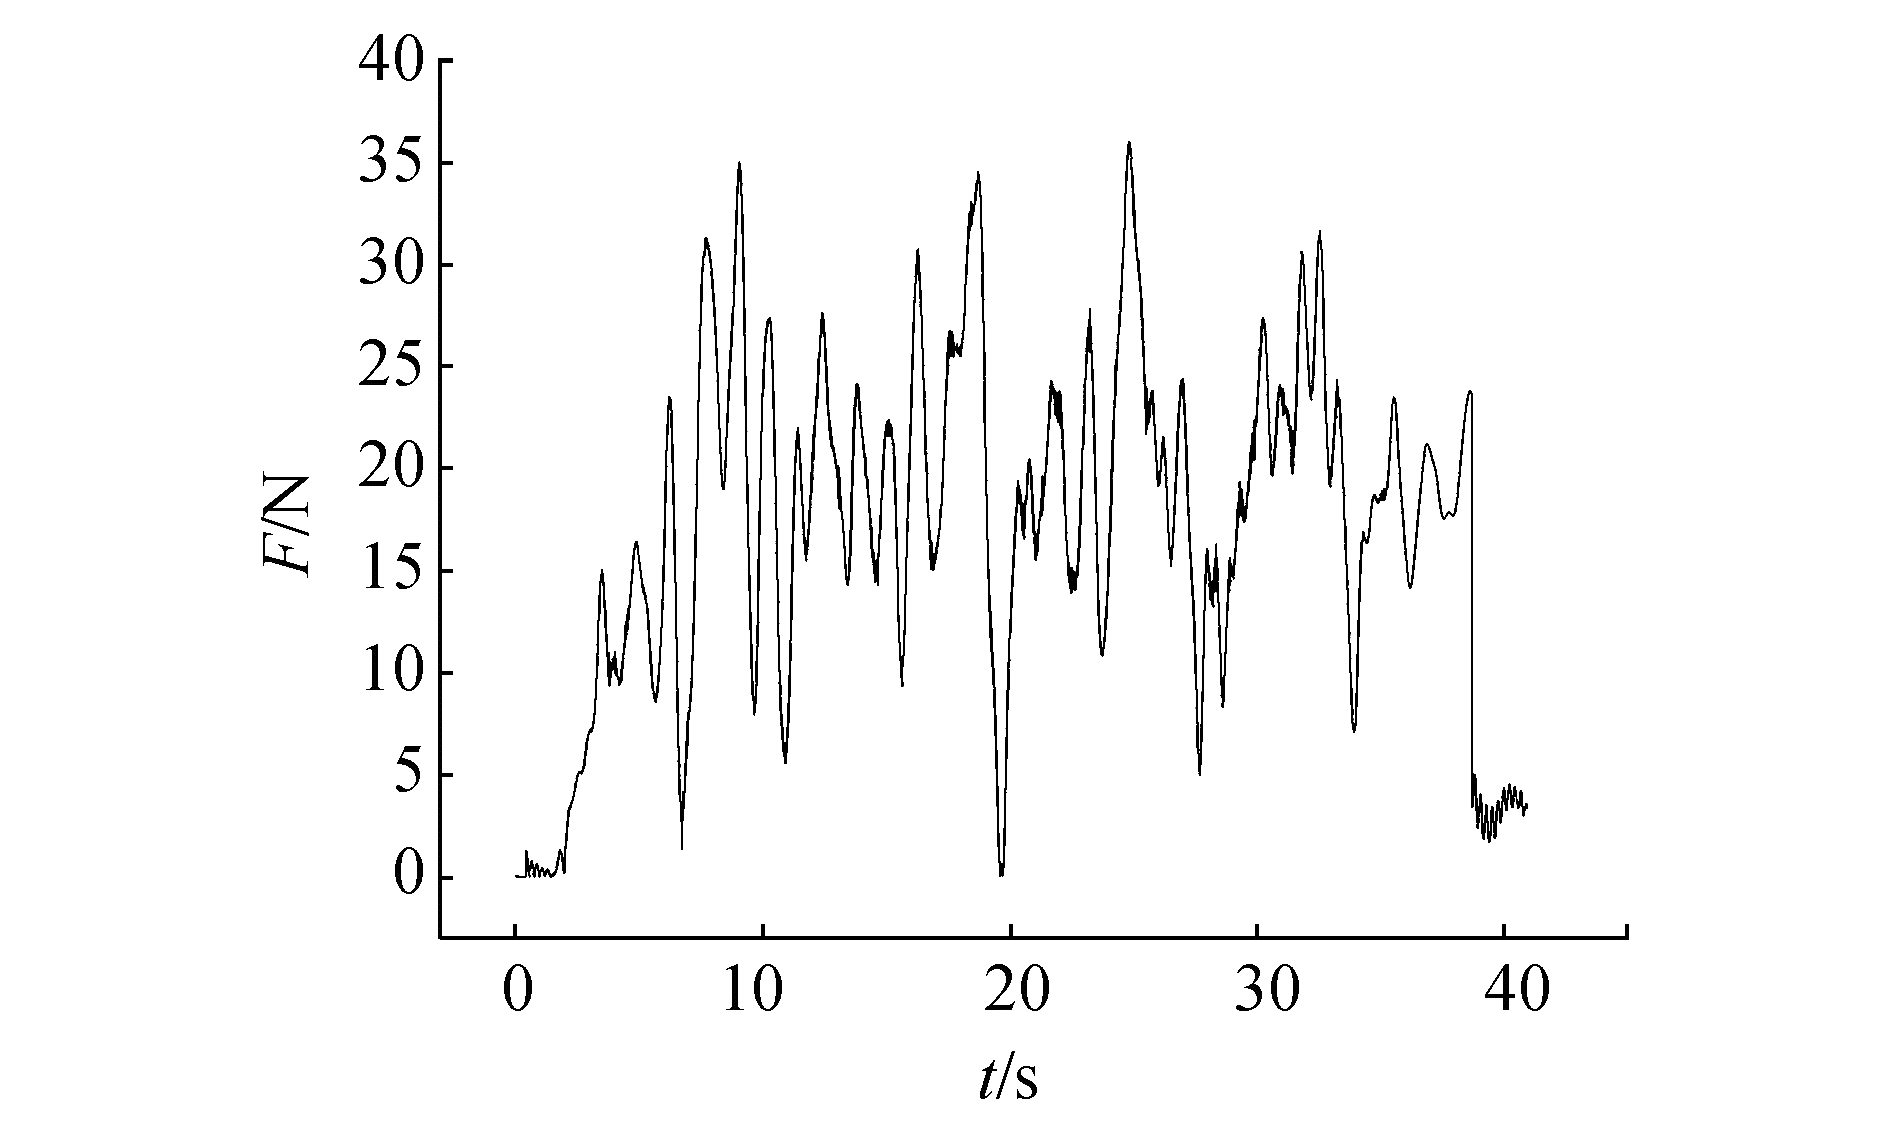
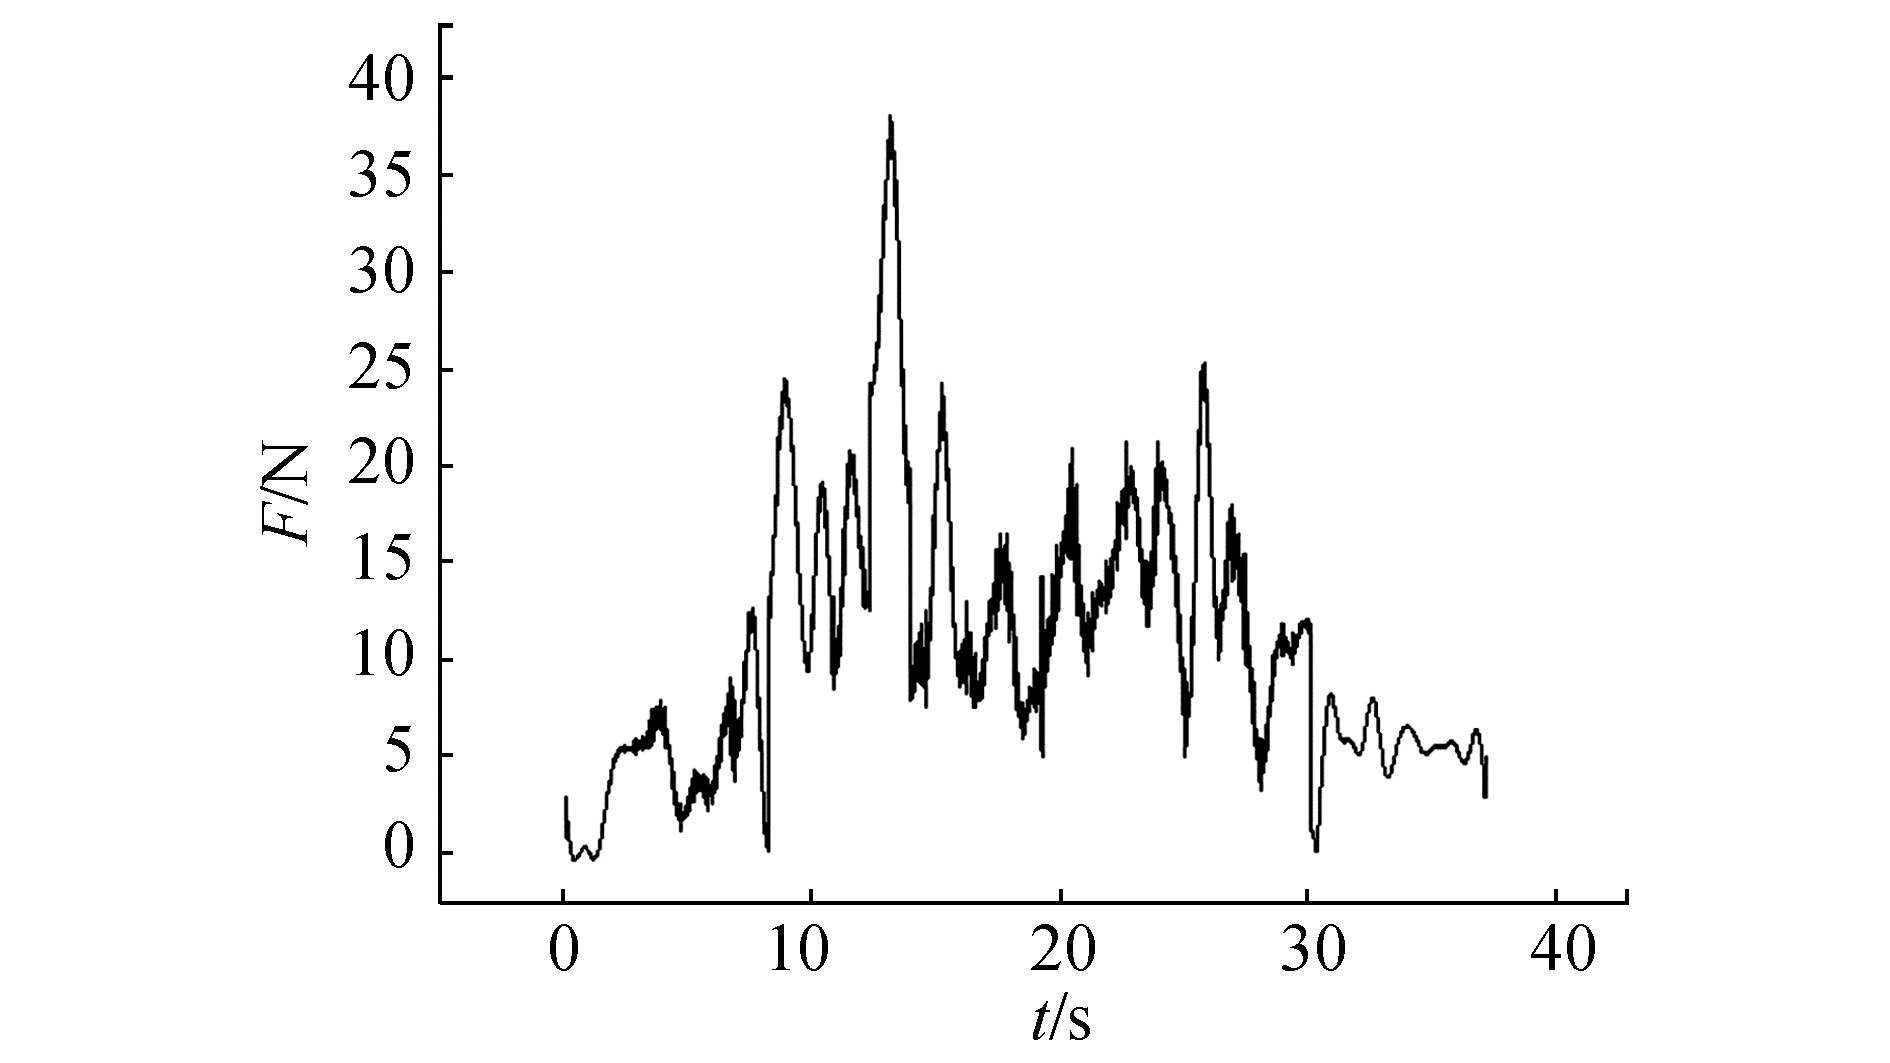
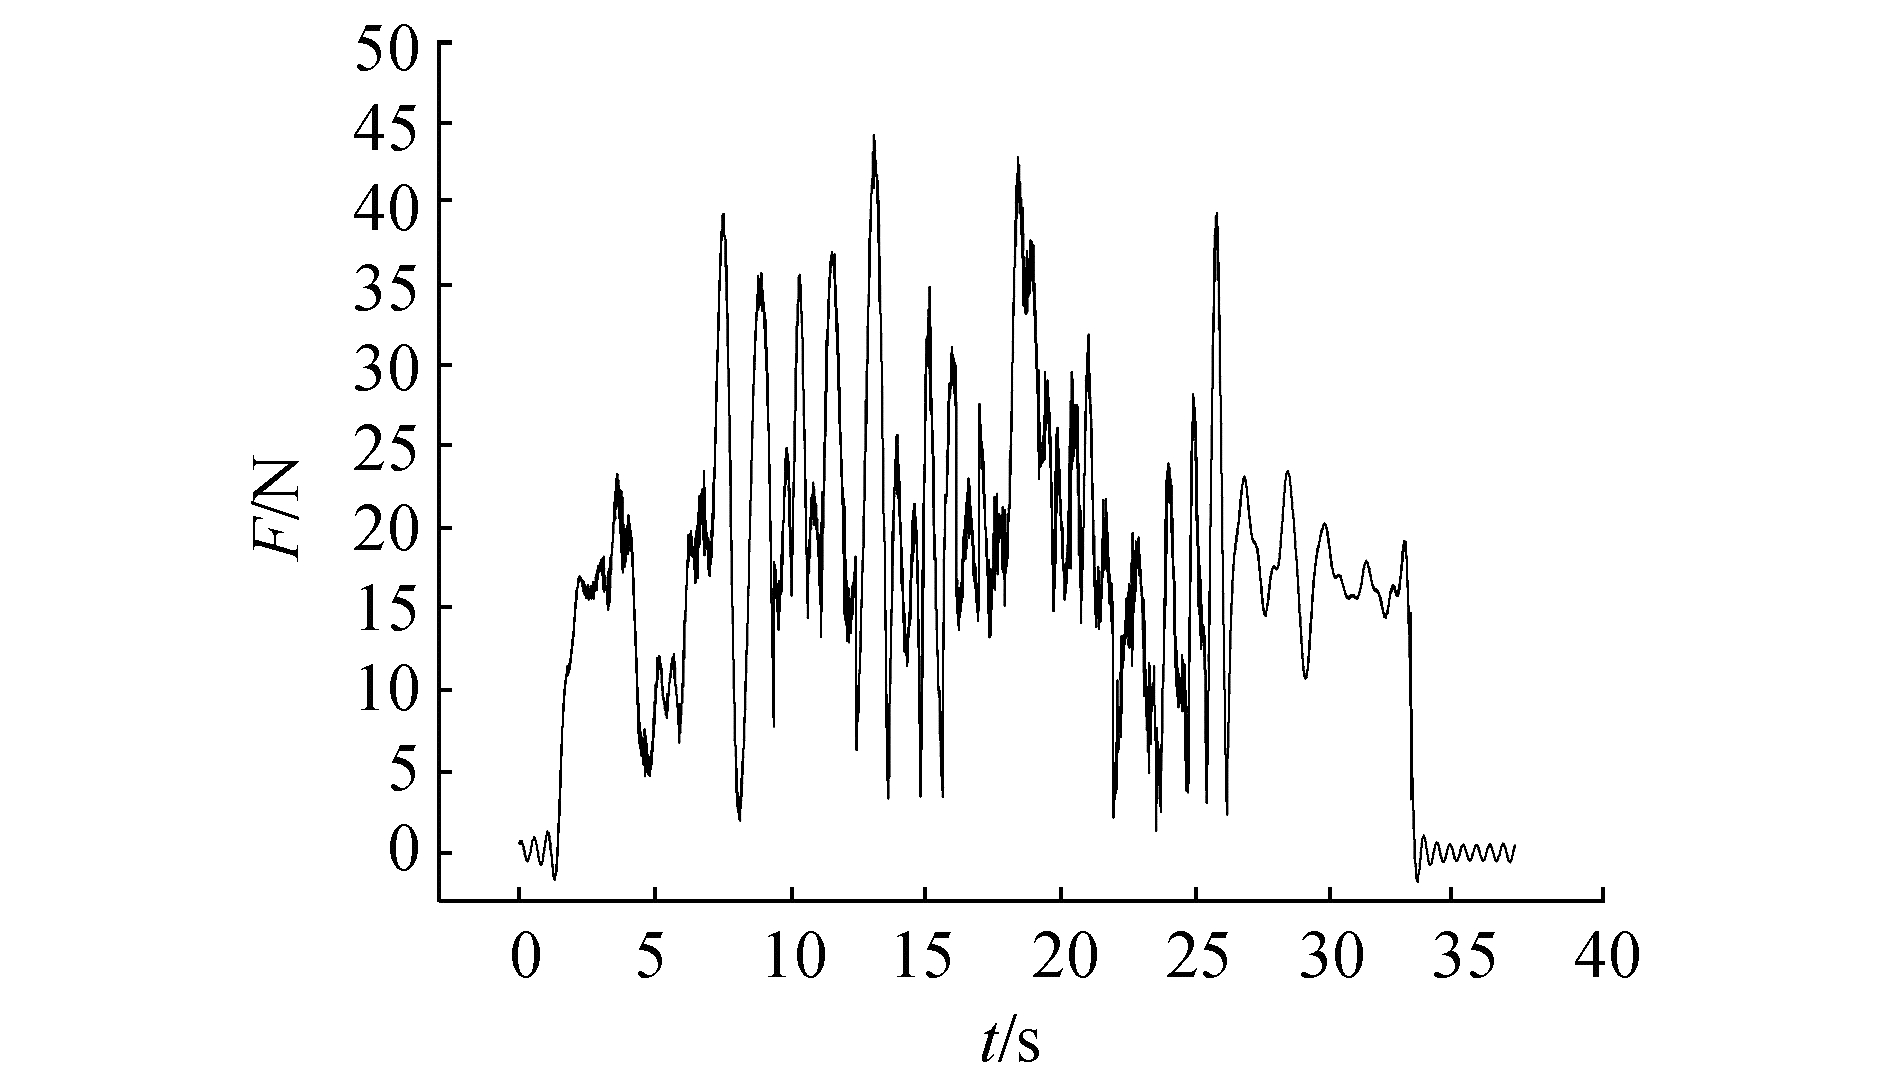
In further observations,we found the navigation velocity to be another governing factor in determining the interaction mode and corresponding resistance characteristic. As shown in Figs. 15-20,any trace of the second interaction mode disappears in the resistance records when the navigation velocity exceeds a certain level(0.291 m/s in the present tests). In these cases,a high navigation velocity promoted the splitting and bending failure of the ice as the dominant process. The highest resistance record is shown in Fig. 20(0.363 m/s and 90% ice concentration).

|
| Figure 15 Resistance time history (0.291 m/s and 50% ice concentration) |
|
| Figure 16 Resistance time history (0.291 m/s and 70% ice concentration) |
|
| Figure 17 Resistance time history (0.291 m/s and 90% ice concentration) |

|
| Figure 18 Resistance time history (0.363 m/s and 50% ice concentration) |
|
| Figure 19 Resistance time history (0.363 m/s and 70% ice concentration) |
|
| Figure 20 Resistance time history (0.363 m/s and 90% ice concentration) |
For vessels navigating in the Arctic region,mean resistance directly determines its cruising capability,and the ability to use the installed power is determined by the maximum resistance. Therefore,we discuss these issues in the following.
As noted above,ice concentration and navigation velocity are the important factors in determining the level of vessel resistance. Fig. 21 shows the variances in the mean and maximum resistance with respect to navigation velocity under different ice concentrations. We observed the following varying trends:

|
| Figure 21 Plotted results of resistance against navigation velocity |
1)The mean and maximum resistance increased with ice concentration.
2)The mean and maximum resistance increased with navigation velocity.
Furthermore,an increasing gradient of the mean resistance is also accompanied by an increasing ice concentration. However,the increasing gradient of the maximum resistance is almost constant under different ice concentrations. Fig. 22 plots the variances of the mean resistance with ice concentration under different navigation velocities. The varying trends,as shown in the figure,clearly indicate that the higher the navigation velocity,the more the increasing gradient of the mean resistance increases with ice concentration.

|
| Figure 22 Plotted results of mean resistance against ice concentration |
Based on test results and observations,in this paper,we analyzed the total resistance on the vessel and the moving and failure modes of ice at different navigation velocities and ice concentrations. In addition,we carefully analyzed the variances of the mean and maximum resistance. We summarize the main conclusions of this investigation below:
1)There are a variety of moving and failure modes of ice due to various navigation velocities and ice concentrations,which lead to significant variances in the total resistance.
2)The mean and maximum resistance increases with navigation velocity and ice concentration.
3)The higher the navigation velocity,the more the increasing gradient of the mean resistance increases with ice concentration. The higher the ice concentration,the more the increasing gradient of the mean resistance increases with navigation velocity.
The paper focused on the resistance experienced by a transport vessel in Arctic pack ice regions. As the resistance loads on different hull areas have different origins,it is clear that the distribution of resistance along the hull should be given research emphasis. Further studies of these issues are planned.
| Ashton GD, 1986. River and lake ice engineering. Water Resources Publication, Littleton, Colorado. |
| Enkvist E, VarstaP, Riska K, 1979. The Ship-iceinteraction. The International Conference on Port and Ocean Engineering under Arctic Conditions (POAC), Trondheim, 2, 977–1002. |
| Hu J, Zhou L, 2015. Experimental and numerical study on ice resistance for icebreaking vessels. International Journal of Naval Architecture and Ocean Engineering, 7(3), 626–639. DOI:10.1515/ijnaoe-2015-0044 |
| Huang Y, Guan P, Yu M, 2015. Study of the sailing's moving responses of an icebreaker in ice. Mathematics in Practice and Theory, 45(2), 149–160. |
| Karulin EB, Karulina MM, 2011. Numerical and physical simulations of moored tanker behavior. Ship and Offshore Structures, 6(3), 179–184. DOI:10.1080/17445302.2010.544087 |
| Suominen M, Kujala P, 2014. Variation in short-term ice-induced load amplitudes on a ship's hull and related probability distributions. Cold Regions Science and Technology, 106–140. DOI:10.1016/j.coldregions.2014.07.001 |
| Su B, Riska K, Moan T, 2011. Numerical study of ice-induced loads on ship hulls. Cold Regions Science and Technology, 24(2), 132–152. DOI:10.1016/j.coldregions.2010.10.004 |
| Su B, Roger Skjetne, Tor Einar Berg, 2014. Numerical assessment of a double-acting offshore vessel's performance in level ice with experimental comparison. Cold Regions Science and Technology, 106-107, 96–109. DOI:10.1016/j.coldregions.2014.06.012 |
| Tan X, Riska K, 2014. Effect of dynamic bending of level ice on ship's continuous-mode icebreaking. Cold Regions Science and Technology, 106-107, 82–95. DOI:10.1016/j.coldregions.2014.06.011 |
| Valanto P, 2006. On the ice load distribution on ship hulls in level ice. 7th International Conference and Exhibition on Performance of Ships and Structures in Ice (ICETECH), Banff, 153–162. |
| Von BockundPolach R, 2010. Impact of heave and pitch motions on ships in ice. 20th IAHR International Symposium on Ice, IAHR2010-101. |
| Zhou L, Riska K, 2013. Experiments on level ice loading on an icebreaking tanker with different ice drift angles. Cold Regions Science and Technology, 85(1), 79–93. DOI:10.1016/j.coldregions.2012.08.006 |


