1 Introduction
MEPC 68(2015) states that“the same methods, procedures and empirical coefficients shall be used to extrapolate the model scale values to full scale for all draughts and trims. Where different empirical coefficients for the different draughts are used, full details shall be recorded in the tank test report.”Among these factors, k is important to correctly predict the full-scale total resistance and speed at different drafts.
ITTC final report of Resistance Committee reported a survey conducted by the ITTC Specialist Committee on powering performance prediction, found that many organizations use the form factor method, and many of those organizations obtain the form factor from a low-speed Prohaska (hereafter, PRO) test (The Resistance Committee, 2011).
There is considerable difficulty in determining a reliable form factor for an individual ship. Problems arise from the following areas: the modern bulbous bows present on many ships, the additional resistance caused by stable separations and induced vortices—this occurs with full block vessels like tankers and bulk carriers, and the effects of large immersed transom sterns.
A study on the form factor using the PRO method (Hollenbach, 2009) concluded that the form factor method increases the accuracy of predictions in cases where a bulbous bow and an immersed transom stern are absent. The determination of a suitable form factor using the PRO method is much more sensitive to form features of modern hulls than has been expected. For full block vessels, the choice of a reasonable form factor has a significant influence on the predicted resistance. In the past, the ITTC recommended not using a form factor derived from the individual tests in cases where separations occur, Instead, the ITTC recommended using a form factor derived from full forms, which do not suffer from severe separation problems that may cause considerably different predictions.
It is possible for Computational Fluid Dynamics (CFD) to provide reliable k values with a double model. Wang et al. (2013) performed a study on the application of the CFD method to predict form factor of some full ships at design draft; this method was proven to be feasible The advantages of using a CFD viscous double model at design speed includes the following: no waves are compared with a low-speed model test, there is no need for a frictional line (k=Cp/Cf, both Cp and Cf are from CFD), and the large uncertainty during low-speed measurements can be avoided.
2 Examination of CFD methodSeveral aspects of the CFD method were examined to see whether it was possible to obtain a reasonable k for different ships and drafts.
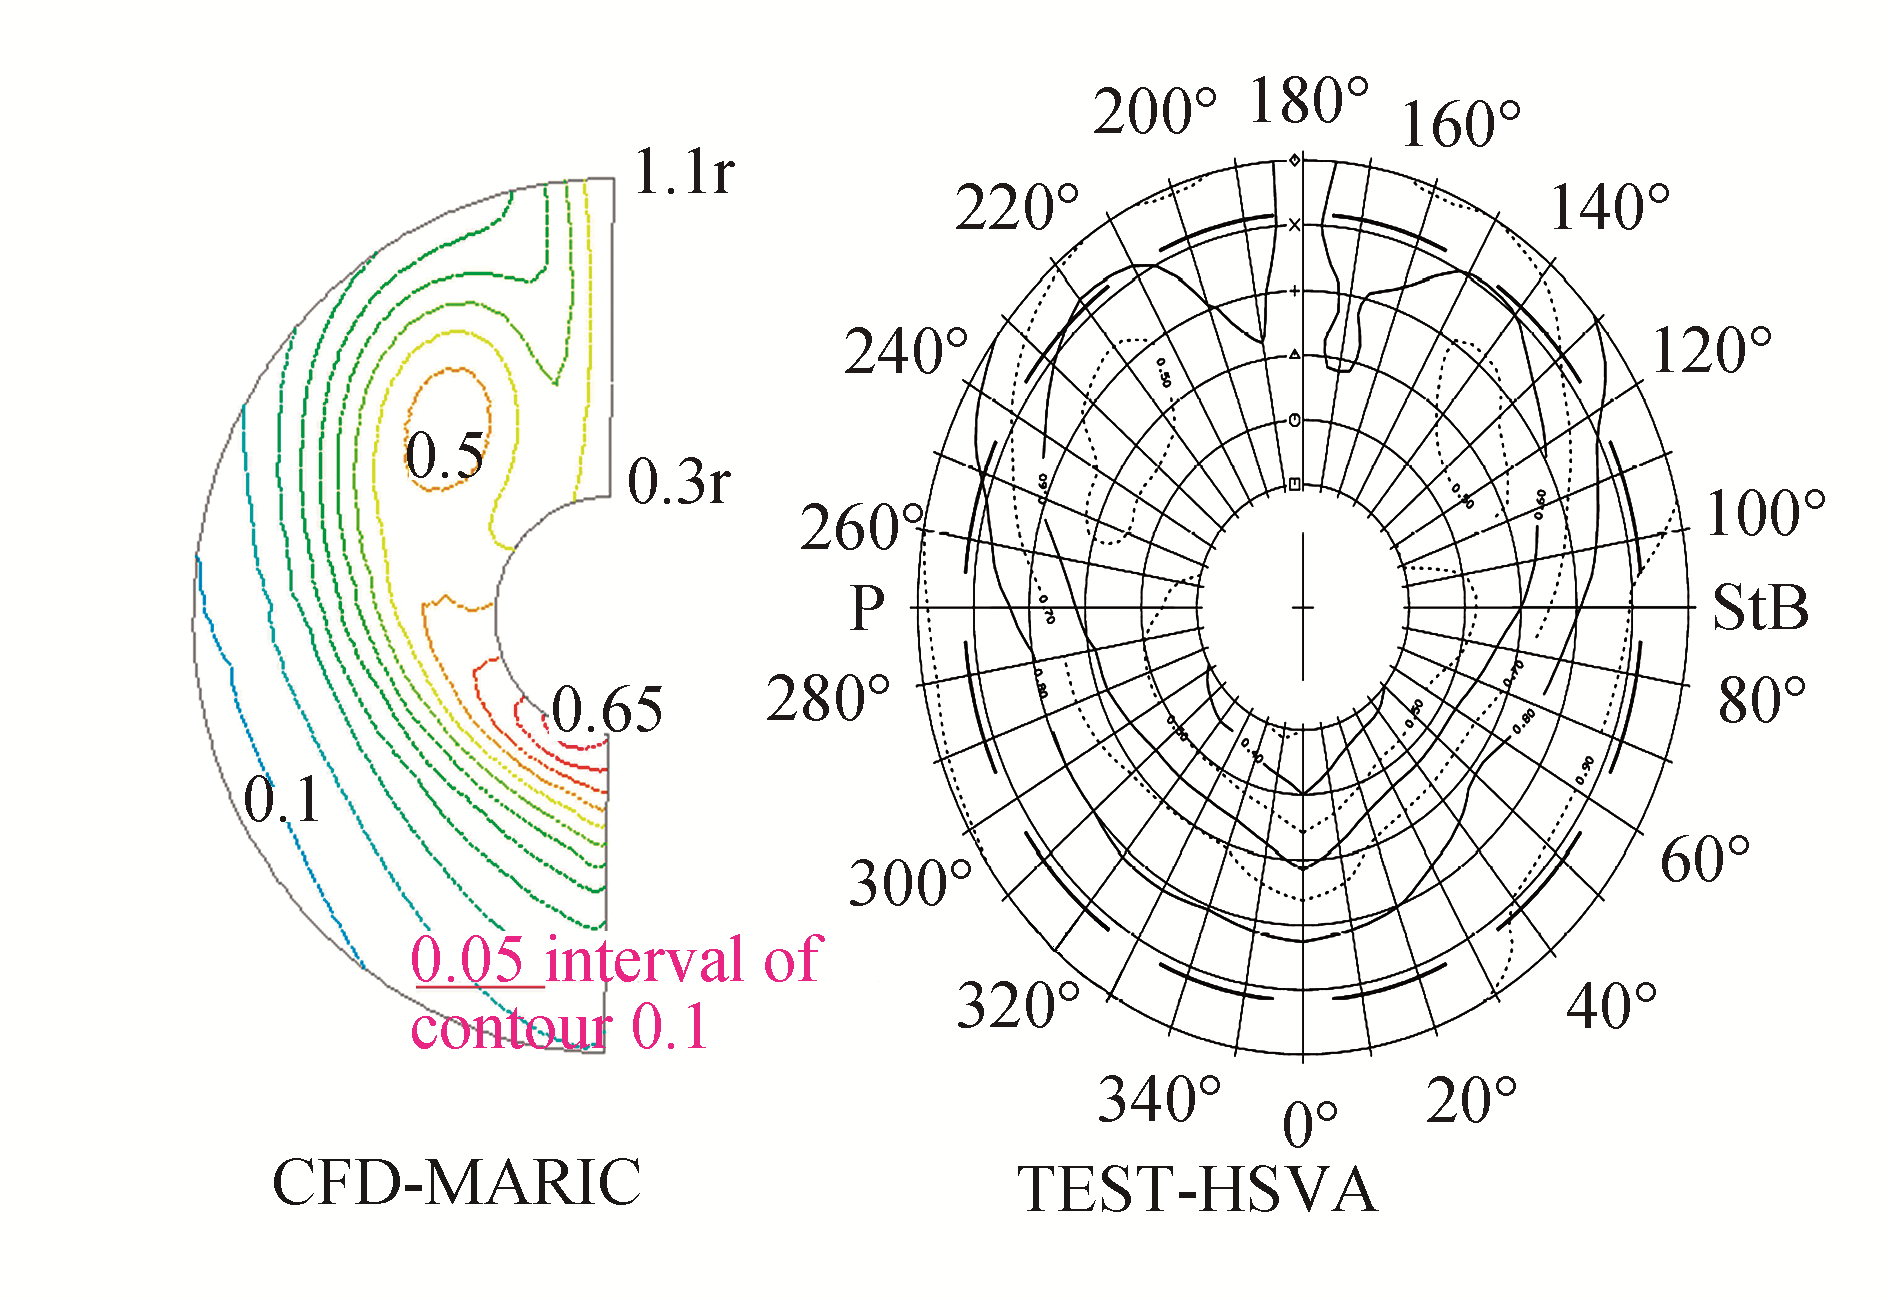
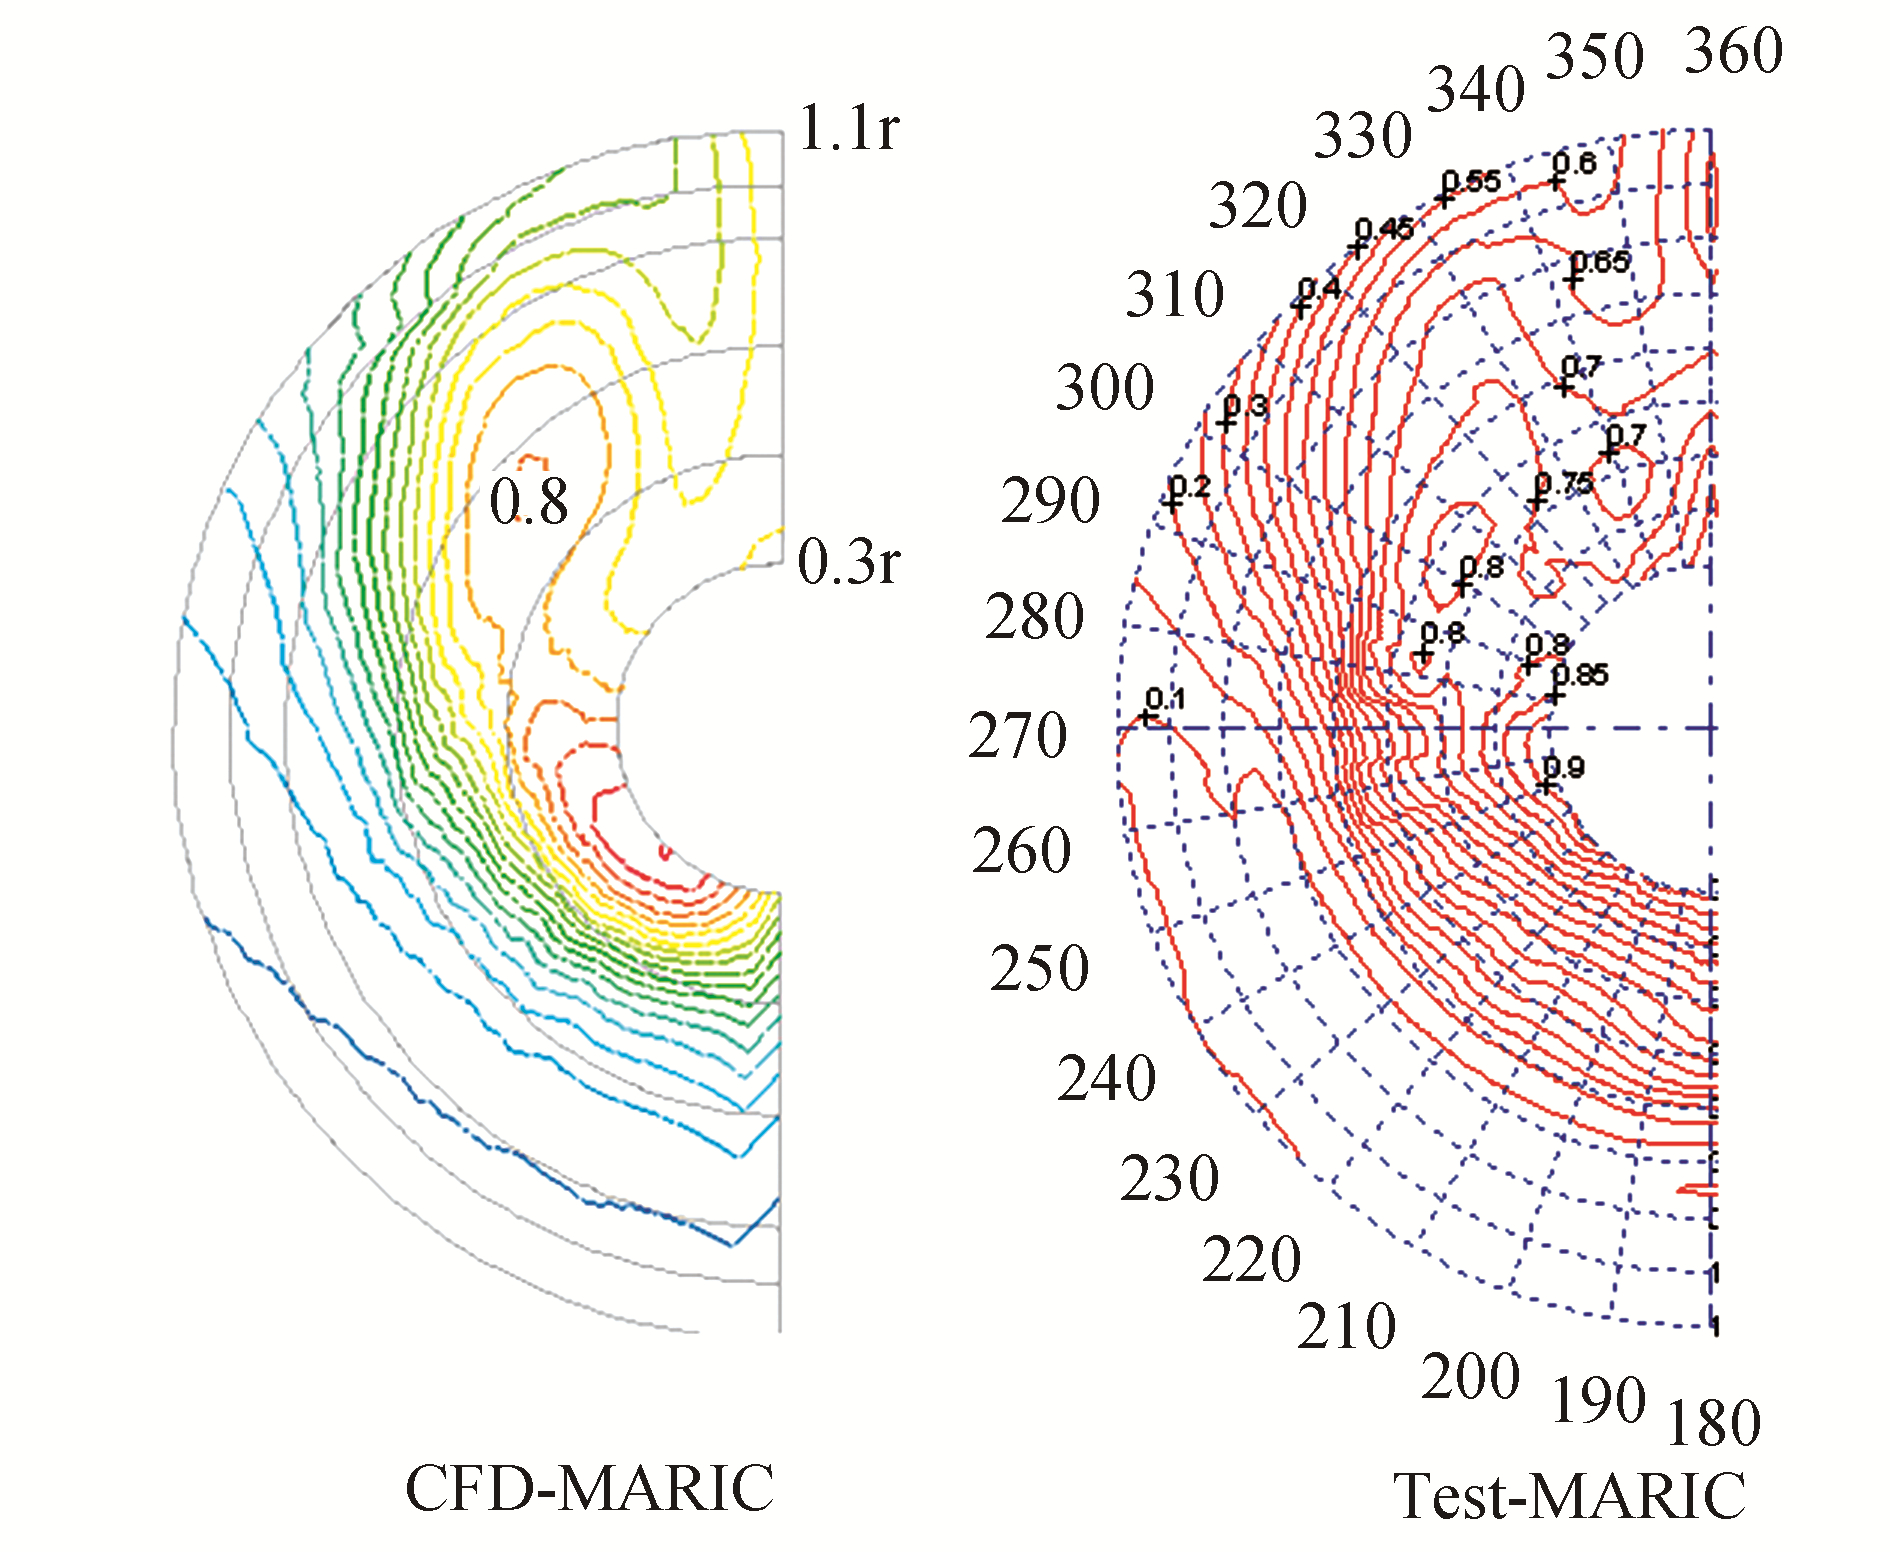
2.1 Wake field simulationWang et al. (2010) performed a numerical simulation of a viscous wake field around slow-full ships on a VLCC and a very large ore carrier at design draft. It was concluded that the CFD method could capture the main character of a wake field when compared with the model test. To better understand whether CFD can provide the correct flow-field information on other ships, the following ships were used to compare the wake field at the propeller disk at model scale: 110 000 oil tank (Fig. 1), 9 000TEU container ship (Fig. 2), and 200 000 bulk carrier(Fig. 3) illustrate that the main characteristics of the wake fields, e.g., vortex center and strength, were correctly captured with the CFD test when compared with the model test.

|
| Figure 1 Wake field comparison at propeller disk–110 000t oil tank |
|
| Figure 2 Wake field comparison at propeller disk–9 000TEU |
|
| Figure 3 Wake field comparison at propeller disk–200 000t bulk carrier |
The above-discussed comparison involving wake field characteristics proves that CFD is capable of accurately simulating the wake field for an oil tank, bulk carrier, and a container ship at design draft; free surface and posture were not considered. The CFD method could be used to evaluate the hull’s resistance component.
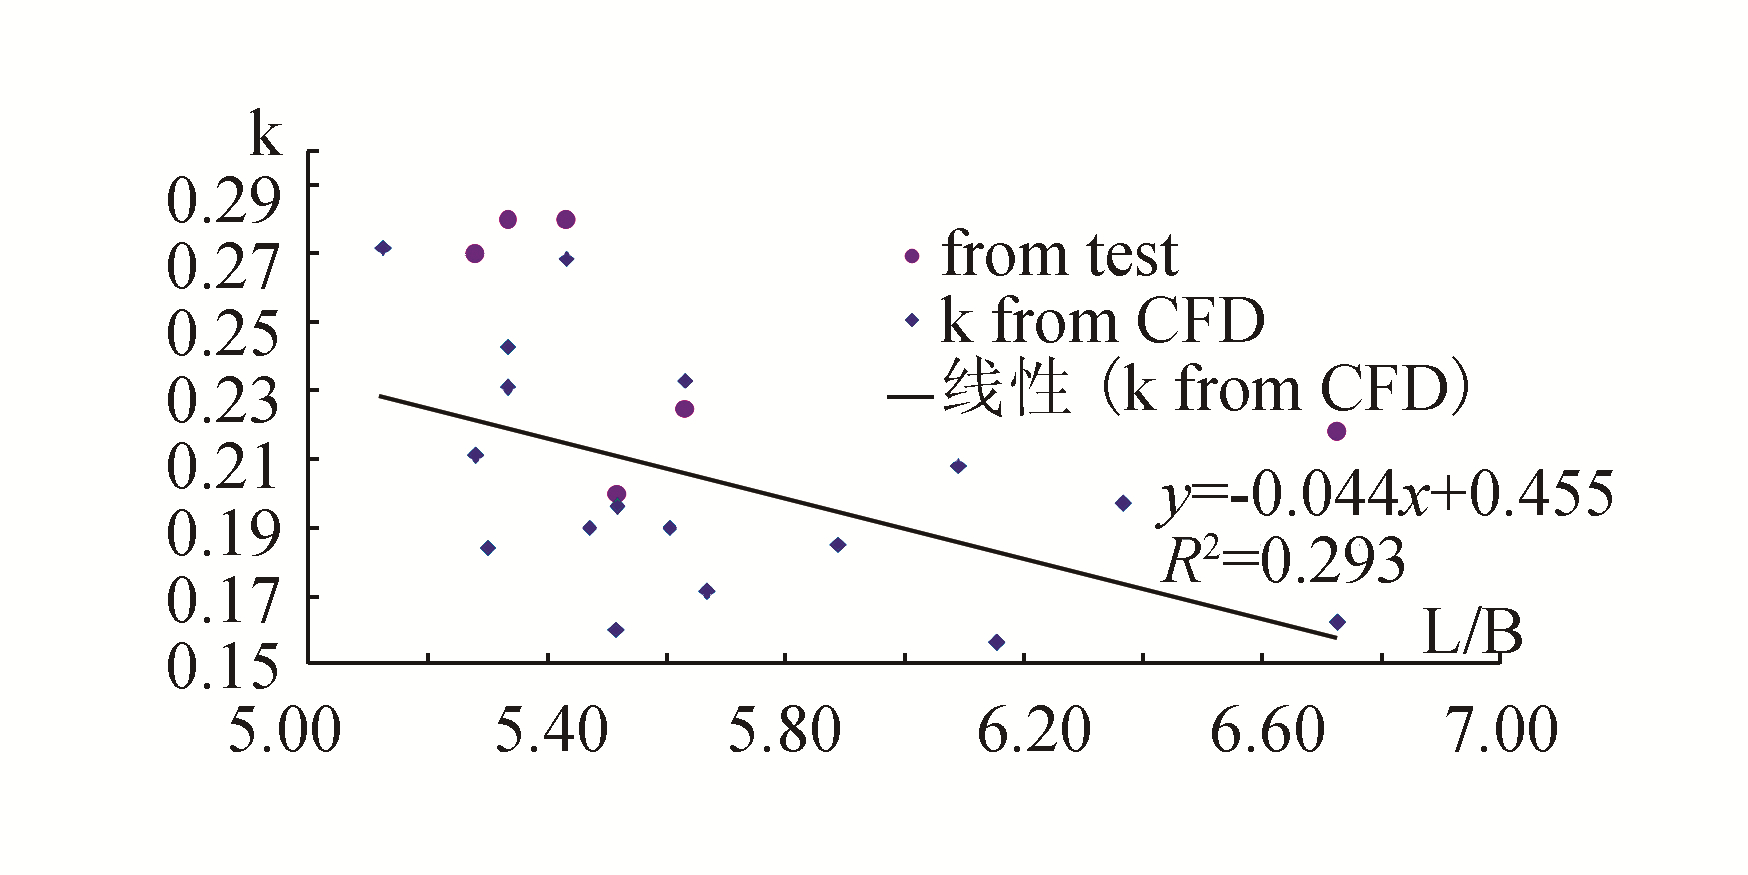
2.2 Influence of ship parameters on kTo see whether the k obtained using the CFD method reflects the tendency of changes in a ship’s parameters, 17 ships were studied. Fig. 4 illustrates the trend that an increase of L/B corresponds to a decrease in k obtained from the CFD method. While Fig. 5 shows that an increase of Cb corresponds to an increase in k. These tendencies are reasonable, although a large scattering was observed.
|
| Figure 4 Influence of L/B on k |

|
| Figure 5 Influence of Cb on k |
Figs. 4 and 5 also show that some k obtained from the model test is remarkably larger than the k from the CFD method. One possible explanation for this difference is that these k were not really obtained from the model test, but are taken empirical values from reference ship. A larger k is dangerous because it means a greater risk of failing to meet the contract speed.
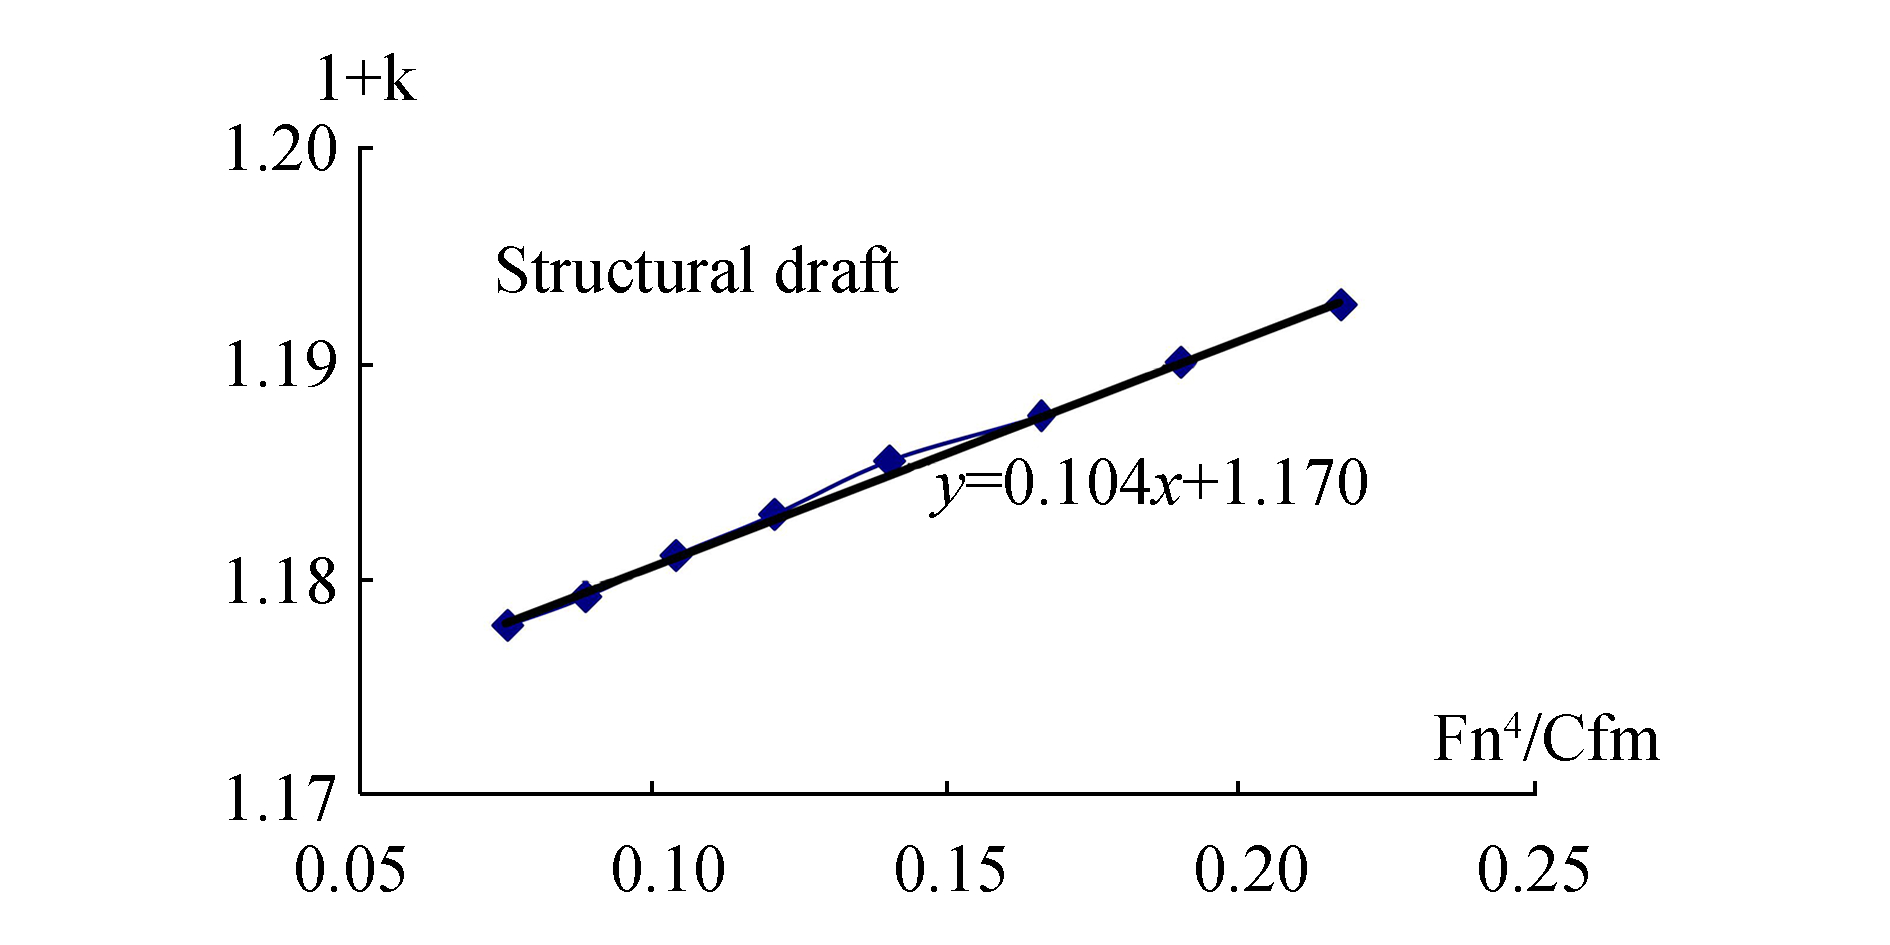
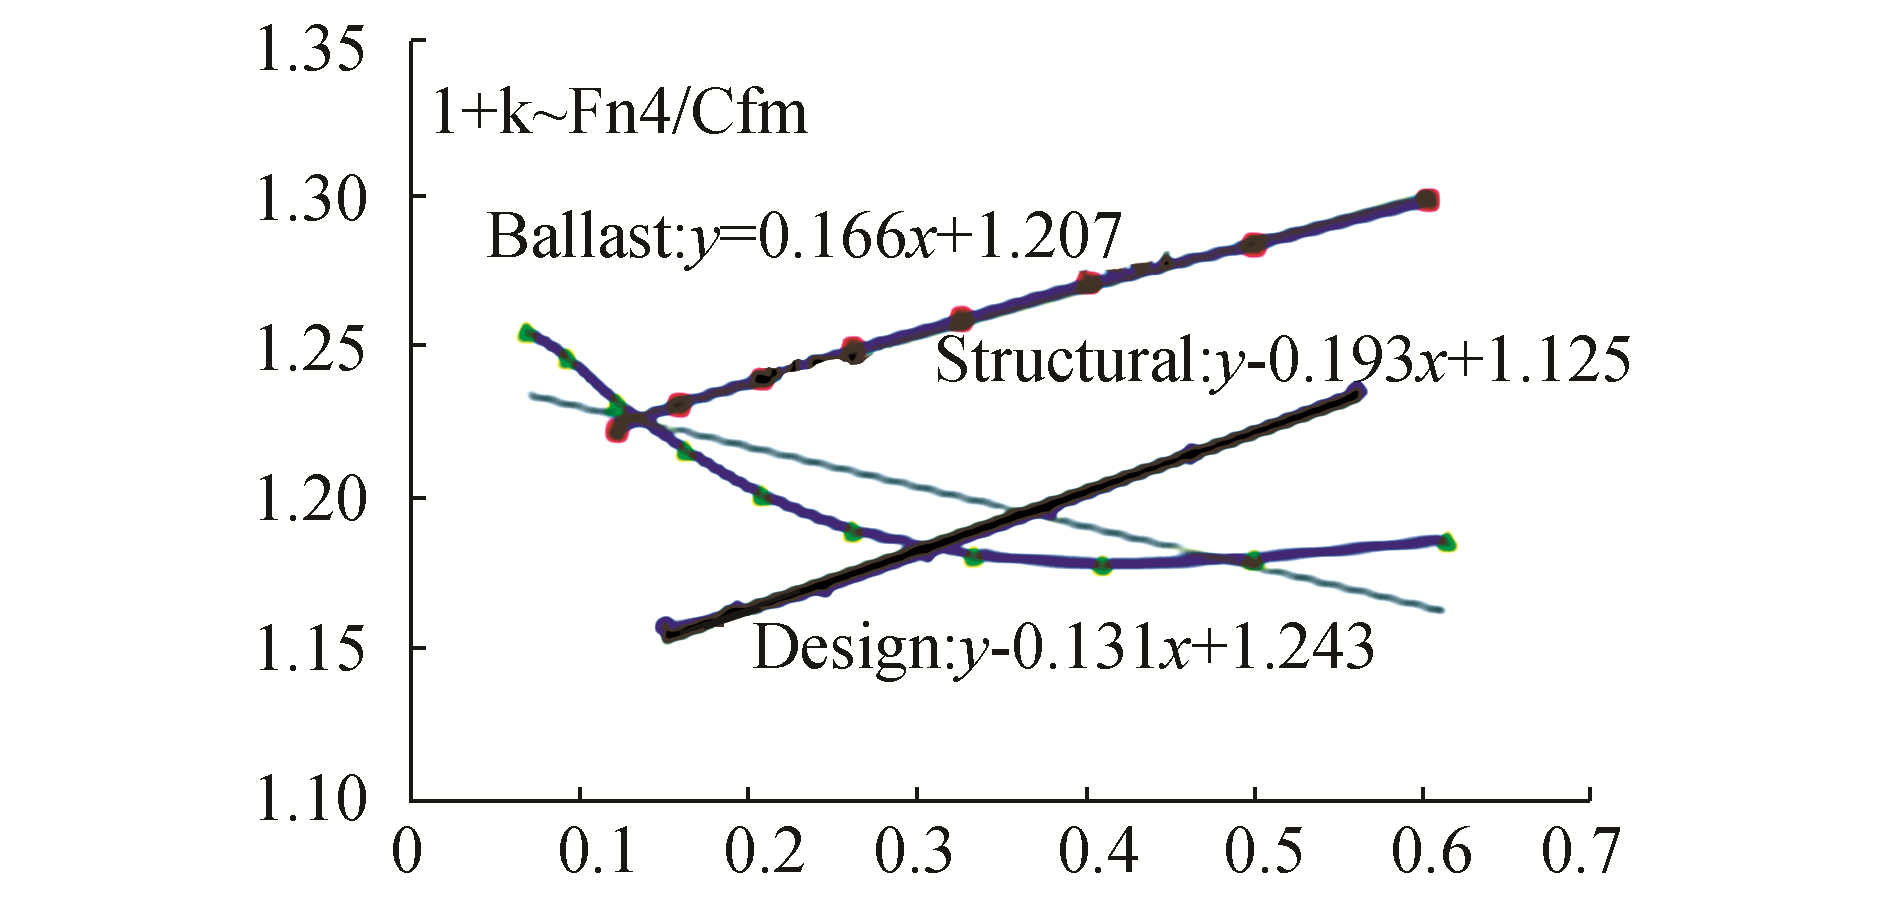
2.3 Comparison of k at different draftsTo find the relationship between k values from the CFD and PRO methods, a comparison was made at different drafts for oil tanks and containers. Fig. 6 shows the 1+k obtained using the PRO method on an Aframax oil tank. Table 1 shows a comparison of k between the two methods at different drafts. Fig. 7 shows the line of an Aframax oil tank.
|
| Figure 6 1+k from PRO method on an Aframax oil tank |
| Item | S | D | B |
| LPP/B | 5.52 | 5.52 | 5.52 |
| Cb | 0.817 | 0.805 | 0.74 |
| TF | 15 | 13.5 | 6 |
| TA | 15 | 13.5 | 9 |
| k_CFD | 0.17 | 0.16 | 0.13 |
| k_PRO | 0.17 | 0.148 | 0.125 |
| dk=k_P–k_CFD | 0 | −0.012 | −0.005 |
|
| Figure 7 line of an Aframax oil tank |
The figures show that k values obtained from different methods are highly consistent with each other. This consistency may be attributed to an absence of bulbous bows and a very small immersion of the transom stern.
More comparisons of k from different ways on other oil tanks are shown in Table 2.
| Ship | Ship A | Ship B | Ship C | |||||||||
| Draft | S | D | B | S | D | B | S | D | B | |||
| LPP/B | 6.15 | 6.15 | 6.15 | 5.67 | 5.67 | 5.67 | 5.6 | 5.6 | 5.6 | |||
| Cb | 0.81 | 0.798 | 0.754 | 0.803 | 0.793 | 0.735 | 0.799 | 0.791 | 0.719 | |||
| TF | 12.5 | 11.2 | 6 | 13.3 | 12.2 | 5.4 | 17.15 | 16 | 5.9 | |||
| TA | 12.5 | 11.2 | 8 | 13.3 | 12.2 | 8.2 | 17.15 | 16 | 9.3 | |||
| k_CFD | 0.154 | 0.156 | 0.145 | 0.175 | 0.171 | 0.154 | 0.21 | 0.19 | 0.127 | |||
| k_PRO | 0.15 | 0.159 | 0.168 | 0.2 | 0.199 | 0.189 | 0.194 | 0.167 | 0.132 | |||
| dk=k_P–k_CFD | −0.004 | 0.003 | 0.023 | 0.025 | 0.028 | 0.035 | −0.016 | −0.023 | 0.005 | |||
S, D and B represent structrural, design and ballast draft respectively.
Ships A, B, and C are all characterized by an absence of a bulbous bow and a very limited transom under water. In general, k does not differ significantly among different methods. However, the difference was relatively large for Ship B; the resistance obtained from the PRO method was approximately 3% smaller than the resistance obtained from the CFD method. Attention should also be paid to the ballast draft with trim that might cause a slightly larger difference.
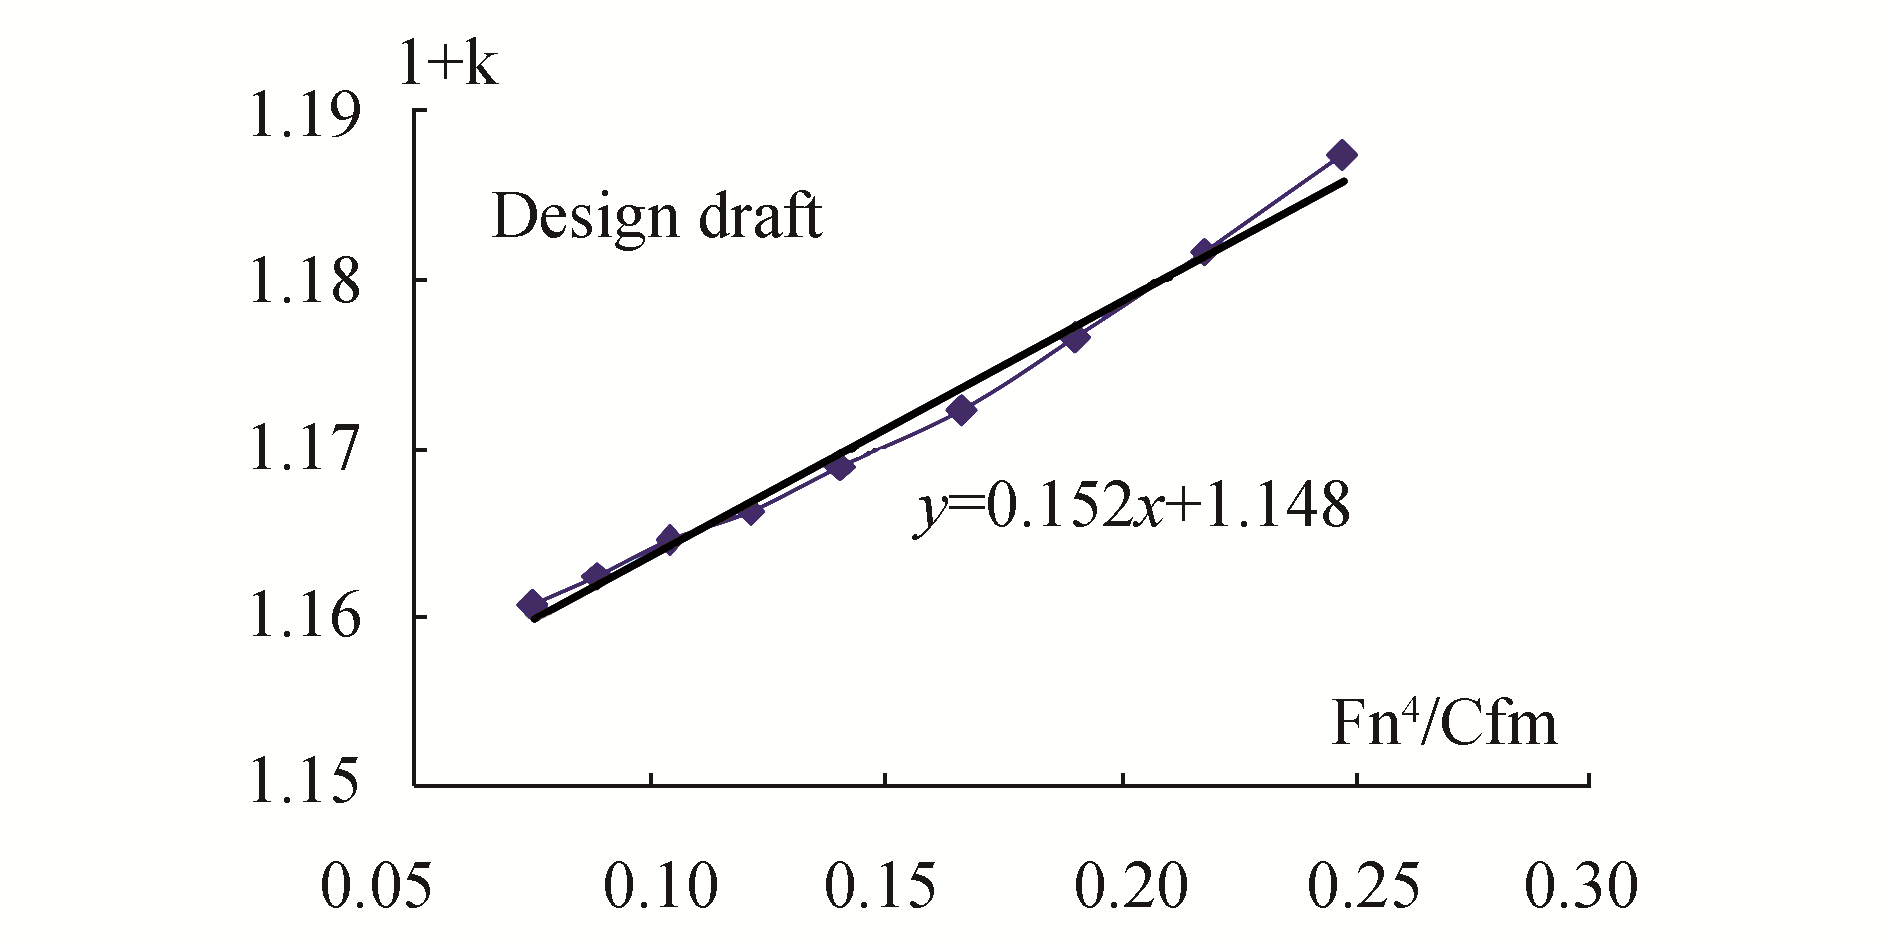
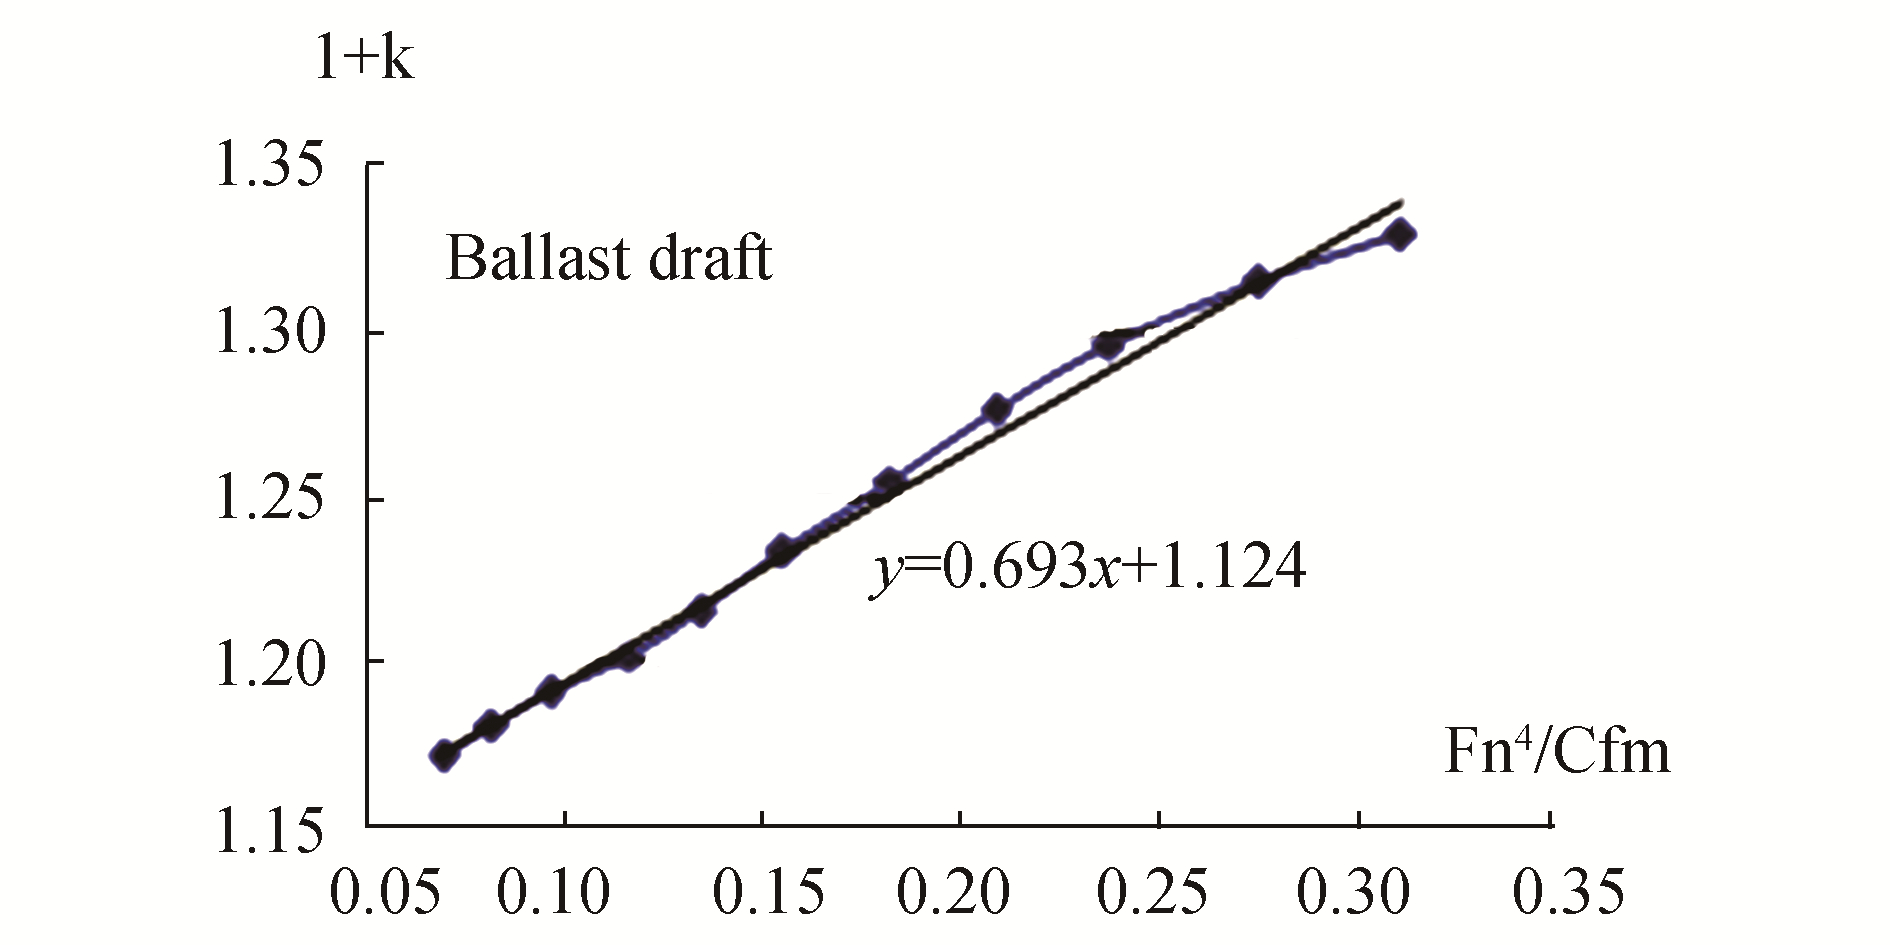
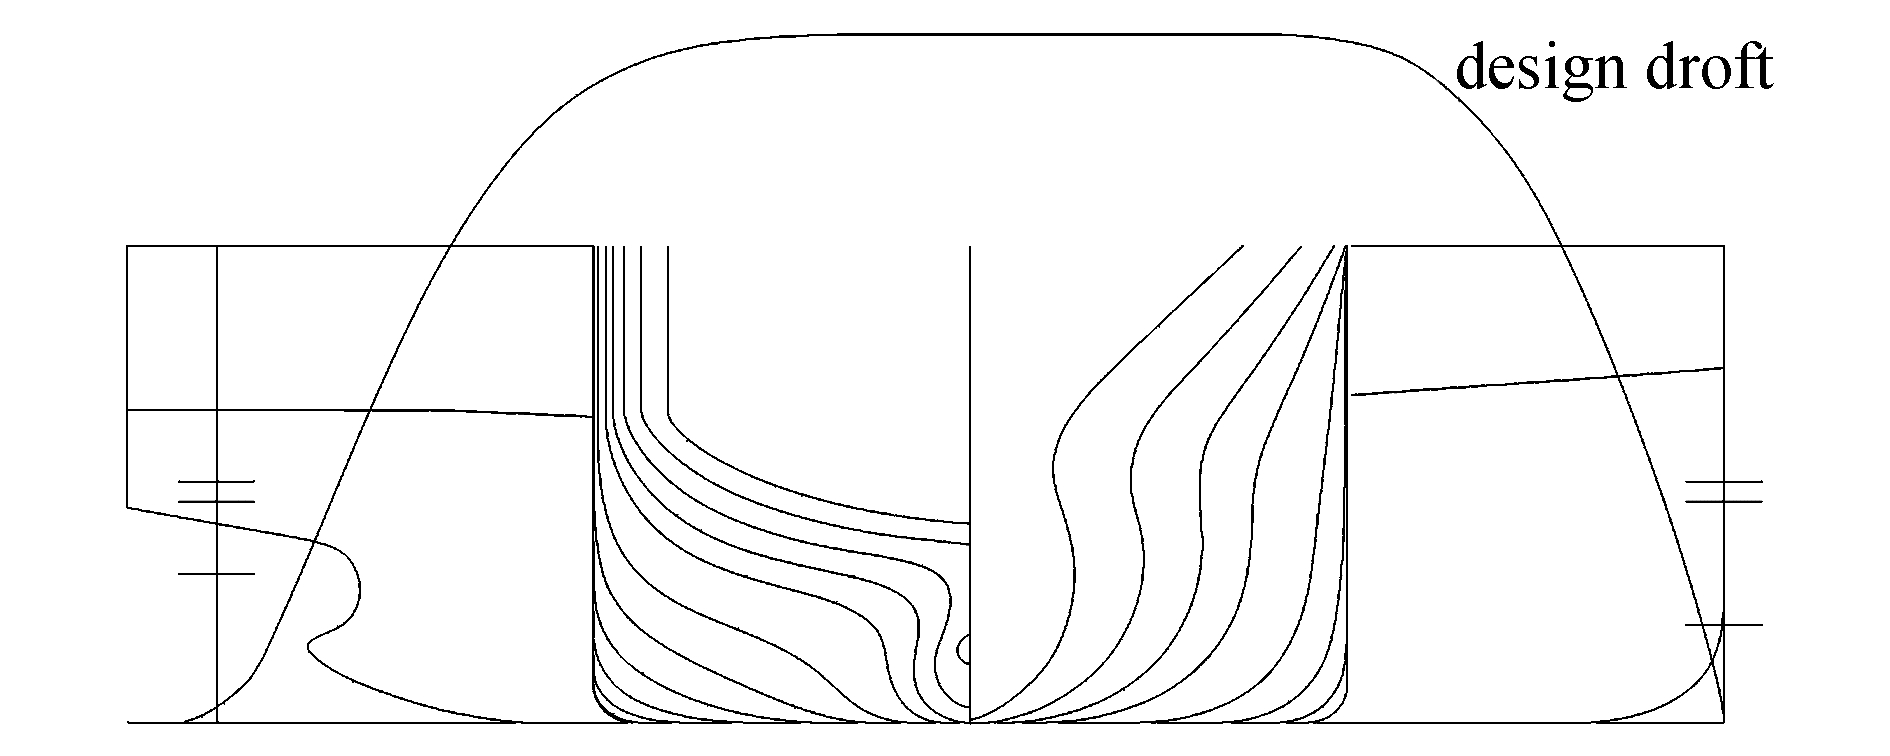
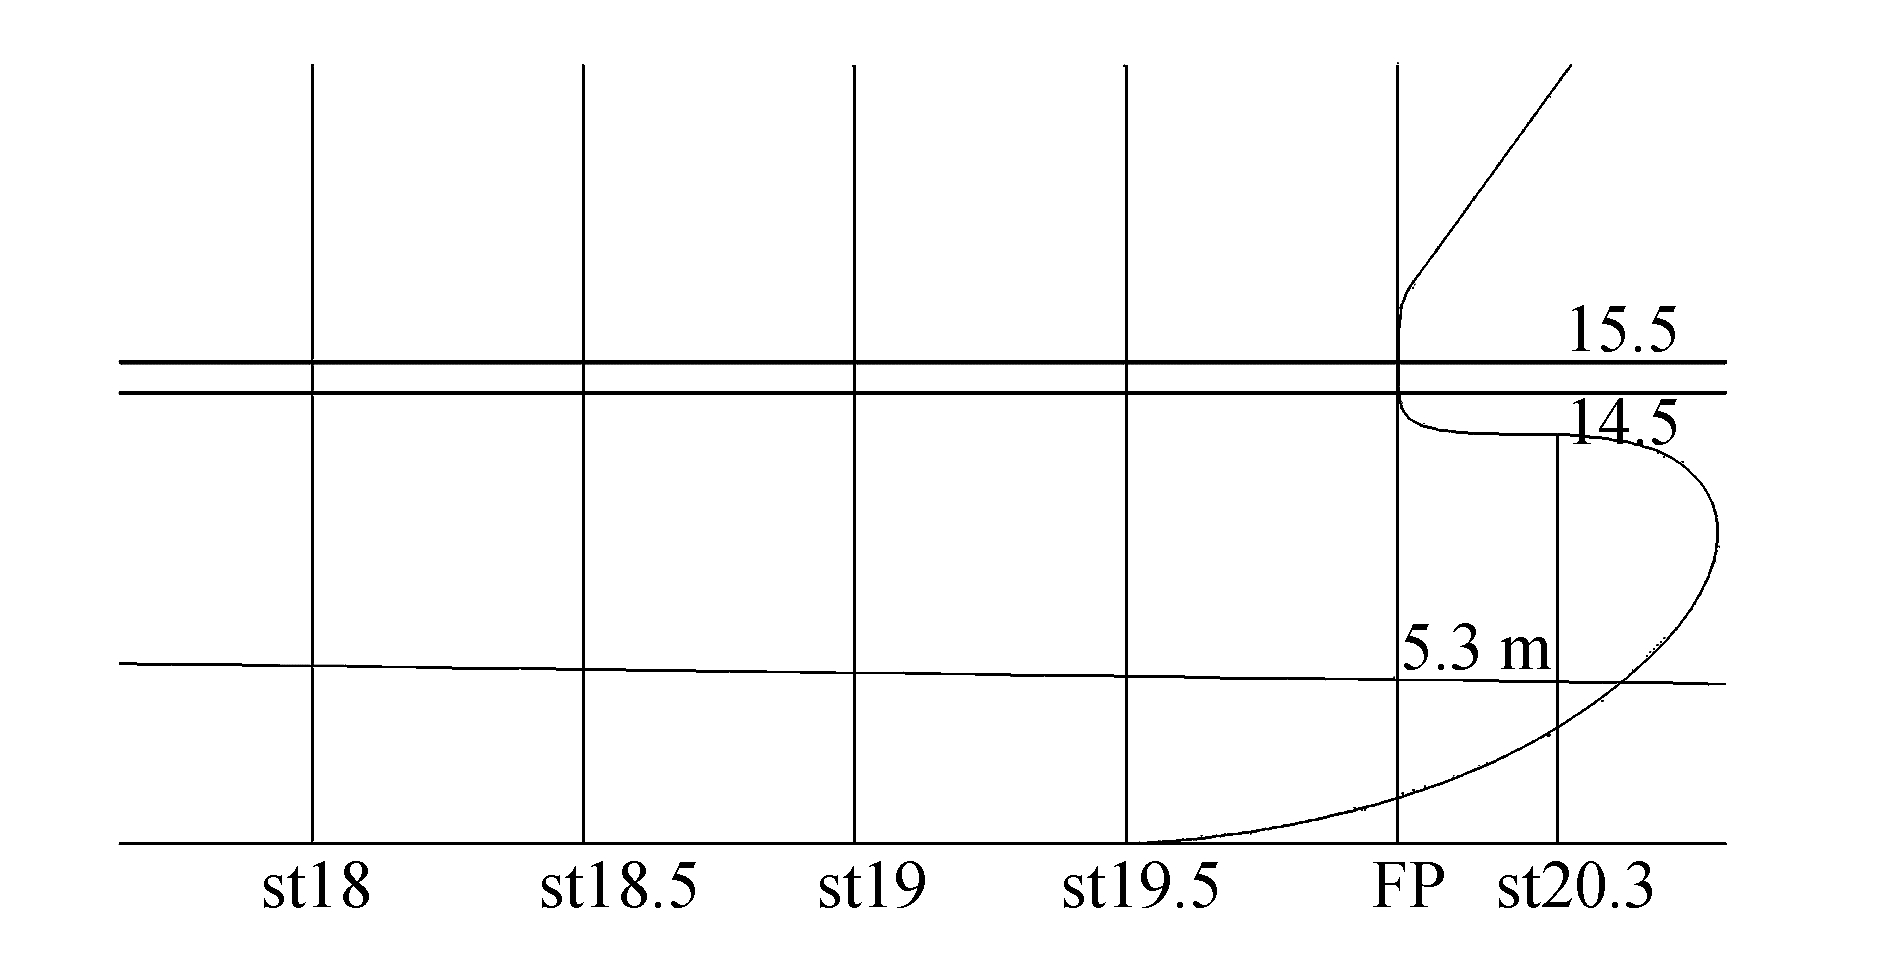
For container ships, it was not the same case. Table 3 shows the comparison of k between two methods at different drafts on two container ships. Figs. 8 and 9 are the lines on the fore part. Fig. 10 shows the results from using the PRO mothod to get 1+k at different drafts for Ship B.
| Ship | Ship A | Ship B | ||||
| Draft | S | D | B | S | D | B |
| Lpp/B | 6.84 | 6.84 | 6.84 | 6.64 | 6.64 | 6.64 |
| CB | 0.700 | 0.688 | 0.595 | 0.633 | 0.604 | 0.537 |
| TF | 15.5 | 14.5 | 5.3 | 15.0 | 13.0 | 5.1 |
| TA | 15.5 | 14.5 | 9.7 | 15.0 | 13.0 | 10.2 |
| k_CFD | 0.110 | 0.10 | 0.056 | 0.136 | 0.127 | 0.070 |
| k_PRO | 0.118 | / | 0.113 | 0.125 | / | 0.207 |
| dk=k_P–k_CFD | 0.008 | / | 0.077 | 0.011 | / | 0.13 |
|
| Figure 8 Outline of Ship A |
|
| Figure 9 Outline of Ship B |
|
| Figure 10 PRO method used to obtain 1+k at different drafts for Ship B |
At a scantling draft, k is consistent among different methods. However, at ballast draft, k obtained from the PRO method is much larger than the k obtained from the CFD method, which is impractical. Moreover, at design draft, k cannot be obtained from the PRO method (Fig. 10). At any draft, k obtained from the CFD method is reasonable when compared at different drafts on one or more ships.
Based on the above-mentioned study, we concluded that the CFD method is capable of capturing a correct wake field. The k obtained from the CFD method can reflect the tendency of change in a ship’s parameters, including draft changes. The k value agrees well with the model test for ships without bulbous (or bulbous far below waterline) bows and without an immersed transom (or with very limited transom). In addition, when the PRO method fails to provide k, the CFD method still works. Therefore, obtaining k from the CFD method is an important possible way to obtain a reasonable k.
3 Consistency study of CFD methodThe grid generation method and turbulence model are two important factors that may influence the form factor k.
3.1 Grid generation methodTo ensure that the results for different ships are comparable, several measures were taken. Firstly, the bowl-shape grid shown in Fig. 11 was used for all ships. Secondly, the minimum distance of the first grid to the wall was studied to get a suitable distance. Thirdly, the different grid type of the fore part was compared to get the correct type.

|
| Figure 11 Topology of bowl-shape grid |
| y/Lpp | y+ | Cp | Cf | k |
| 1×10⁻⁴ | 15 | 0.841 | 3.7 | 0.227 |
| 1.5×10⁻⁴ | 22.5 | 0.806 | 3.55 | 0.227 |
| 2×10⁻⁴ | 30 | 0.774 | 3.414 | 0.227 |
| 2.5×10⁻⁴ | 37.5 | 0.775 | 3.4 | 0.228 |
| 4×10⁻⁴ | 60 | 0.775 | 3.37 | 0.230 |
y+ was estimated according to empirical formula 0.172×y/Lpp×Re0.9, while Reynolds number Re=Lpp×V/ν.
From the table, we can see, within a certain range, that k is almost the same.
The grid shapes of the fore part also influence k (Fig. 12).
|
| Figure 12 Grid shape on the fore part |
| k | Triangle k1 | Quadrangle k2 | k2–k1 |
| KVLCC2 | 0.197 | 0.201 | 0.004 |
| MVLCC1 | 0.231 | 0.271 | 0.04 |
| MVLCC2 | 0.227 | 0.228 | 0.001 |
For MVLCC1, a remarkable difference exists between different grid shapes; the triangle shape is more reasonable when comparing different VLCCs, and the quadrangle shape contains risk. The triangle shape performs better because it more accurately represents the dual curvature of the hull shape.
3.2 Turbulence modelThe turbulence model was studied to compare the influence of different speeds on k. Table 6 shows the influence of the turbulence model on k on a KVLCC2M.
| Model | Cp | Cf | k=Cp/Cf |
| SSTk-ω | 0.774 | 3.414 | 0.227 |
| Rk-ε | 0.7 | 3.433 | 0.204 |
| Rsm | 0.707 | 3.463 | 0.204 |
| Test | 0.71 | 3.55 | 0.200 |
Here, Cp and Cf are pressure and frictional resistance coefficient respectively. Model test value is from Gothenburg 2000 Workshop (Detailed info refers to Larsson et al., 2003).
Table 6 shows that the Rk-ε (realizable k-ε) model and the Rsm (Reynolds stress model) produce almost the same k; the k values were slightly larger than the k obtained from the double model test. However, the SSTk-ω (Sheer stress transport k-ω)model overestimates k by about 0.03, which corresponds to about 3% lower resistance.
3.3 Reynold numberFrom Table 7, it can be seen that k slightly increases with an increase of Fn(Re). However, the average k is very close to k at the design speed.
| Fn | Cp | Cf | k | k–ka |
| 0.13 | 0.51 | 3.226 | 0.158 | –0.002 |
| 0.15 | 0.499 | 3.126 | 0.160 | 0.000 |
| 0.17 | 0.49 | 3.045 | 0.161 | 0.001 |
| Ka (aver) | / | 0.160 | ||
Raven et al. (2008) also studied the model and ship scale on a Hamburg Test Case (HTC) with the following parameters: Lpp=157.70m; LOS=163.29m;B=27.50m; Tv=9.20m; Th=10.30m;▽=26578.0m; S=5454.0m; CB=0.645; CP=0.654; λ=24.0.
He concluded that the frictional line will significantly influence k. However, when both Cp and Cf are obtained from the CFD model, disregarding any frictional line, the result is quite different.
Table 8 shows that the k values obtained from both the model and ship scale are similar. In other words, a consistent k value can be obtained when both Cp and Cf are obtained using CFD.
| Item | Cf | Cp | k=Cp/Cf |
| model | 2.794 | 0.524 | 0.188 |
| ship | 1.546 | 0.282 | 0.182 |
| dk | / | 0.006 | |
To determine the influence of k on the total resistance, the following example is given.
According to the ITTC prediction method, the total resistance coefficient at full-scale is,
| $ {C_{ts}} = {C_{tm}} - (1 + k)({C_{fm}} - {C_{fs}}) + \Delta {C_f} + {C_{aa}} $ | (1) |
Indices m and s reference the model and full scale, respectively. Cf is the frictional resistance coefficient.ΔCf is the model-ship correlation allowance. Caa is the air resistance coefficient.
From Eq. (1), it can be seen that when Ctm is fixed, Cts decreases as k increases. If k is 0.03 larger than the“true value”(ie, Δk=0.03) and the total resistance coefficient is 2.010-3, CfmCfs is approximately 1.810-3. Then the relative error of Cts is,
| $ \begin{array}{c} {\rm{Err = }}\Delta {C_{ts}}/{C_{ts}} = - \Delta k \cdot ({C_{fm}} - {C_{fs}})/{C_{ts}} = \\ - 0.03 \times 0.8/2 = - 2.7\% \end{array} $ | (2) |
In summary, a larger k will lead to a smaller resistance and higher velocity prediction at the same delivered power. The ship will bear the risk of lower speed at sea. Thus, it is very important to use a suitable k.
5 ConclusionsIn this paper, a CFD-based method of deriving k was studied for different ship types with different drafts; these studies were compared with model tests. To ensure a consistent k from CFD, the grid generation method and turbulence model were introduced. A series of oil tankers and containers were studied and the following conclusions were drawn.
1) The CFD method has the following advantages: no wave; no need for a frictional line; and all ships can use the same grid generation method and the same turbulence model.
2) The wake field estimated from CFD is as good as the wake field obtained with a model test.
3) For oil tanks and container ships, the k obtained from CFD agreed with the PRO method for those ships with no bulbous bow (or far below waterline) and no immersed (or very small) transom.
4) When the PRO method doesn’t work with ships having a pronounced bulb or an immersed transom at certain drafts—especially seen in containerships—the CFD method still works.
5) The k obtained from CFD is stable and consistent with speed changes and scale changes. The k can also reflect the tendency of ship parameters’change(Cb, L/B), anddraft change.
In general, the CFD method is an important possible method for reliably determining k. This research will contribute to the reasonable prediction of full-scale resistance and speed at different drafts.
| Hollenbach U, 2009. Pro's and Con's of the form-factor using Prohaska's method when extrapolating the model resistance. STG Annual Meeting, Hamburg, 18–20. |
| Larsson L, Stern F, Bertram V, 2003. Benchmarking of computational fluid dynamics for ship flows:the Gothenburg 2000 Workshop. Journal of Ship Research, 47(1), 63–81. |
| MEPC 68/INF.14, 2015. Annex, page 20, https://edocs.imo.org/Final/Documents/English/MEPC 68-INF.14 (E). 2015.11.18 |
| Raven HC, van der Ploeg A, Starke AR, Eça L, 2008. Towards a CFD-based prediction of ship performance-Progress in predicting resistance and scale effects. International Journal of Maritime Engineering, Transactions of RINA, 150, A4. |
| The Resistance Committee, 2011. Final Report and Recommendations to the 26th ITTC. Proceedings of 26th International Towing Tank Conference, Rio de Janeiro, Brazil, 38. |
| Wang JB, Yu H, Zhang YF, Cai RQ, 2010. Numerical simulation of viscous wake field and resistance prediction around slow-full ships. Chinese Journal of Hydrodynamics, 25(5), 648–654. DOI:10.3969/j.issn1000-4874.2010.05.0010 |
| Wang JB, Yu H, Zhang YF, Xiong XQ, 2013. Study on the application of CFD method in predicting form factor of full ship. Naval Architect and Ocean Engineering, 4, 1–5. |


