2. ENSTA Bretagne, Brest 29200, France
1 Introduction
Secondgeneration intact stability criteria are currently being developed and evaluated by the International Maritime Organization (IMO) (Bassler et al., 2009, Francescutto and Umeda, 2010, Wandji and Corrignan, 2012). These criteria were presented in detail at the 13th International Ship Stability Workshop (Umeda, 2013). In this paper, we address this version, as amended in February 2015 and January 2016 by the Sub-Committee on Ship Design and Construction of the IMO (SDC 2/WP.4 and SDC 3/WP.5). The new criteria are structured in five failure modes: pure loss of stability in astern waves, parametric roll, broaching/surf-riding, dead ship condition, and excessive acceleration. Three assessment levels are defined for each failure mode. The first level is based on a simplified deterministic approach of the phenomena and ensures high safety margins. A ship that does not pass this first level is designated as“unconventional”by the new regulation (Fig. 1). The second assessment level is based on probabilistic approaches to the phenomena. It requires more complex computations based on hydrostatic considerations with regard to static waves, and ensures medium safety margins. The third assessment level consists of numerical simulations of the ship’s behavior on waves, as performed by specialized institutes. This last level ensures optimized safety margins. In order to comply with future rules, a ship must comply with current rules (IMO IS Code 2.2, 2009) and with at least one level of each failure mode (Fig. 1).

|
| Figure 1 Future intact stability regulation (Bulian and Francescutto, 2011) |
After a short presentation of the first and second level criteria of the pure loss of stability and parametric roll failure modes, in this paper, we show the curves of the maximum height of the center of gravity as a function of displacement (KGmax curves) with regard to the criteria of these two failure modes. We compute these curves for ships of five different types, chosen for their variety of behavior with regard to both failure modes: a naval ship, two container ships, a roll-on roll-off (Ro-Ro) vessel, and a tanker. KGmax curves allow a crew to assess their ship’s stability with regard to a specific criterion or several criteria (envelope curve) without the need to performa any complex computation. KGmax curves are included in each ship’s stability booklet. In this paper, the avoidance any assumption about the height of the center of gravity is permitted. This also enables a comparison of the results given by all levels and methods in order to determine the efficiency and relevance of the new criteria. We compare curves based on these new criteria with those based on the first-generation criteria. While not the main objective of this paper, the consideration of KGmax curves allows for the determination of the vulnerability of vessels to these two failure modes. Similar studies have been performed (Krueger et al., 2013, 2015 ) but were based on former versions of the new criteria (respectively SLF 54/19, 2012 and SDC 1/INF.8, 2013).
2 Presentation of shipsThe main particulars of the five ships in this study are given in Table 1. The superstructures of four of them have been modelled in order to compute the weather criterion (IS Code 2.3, IMO, 2009), without taking into account their flooding points. The bilge keels of all the ships have also been modelled.
| Particular | Symbol | Unit | Naval ship | Container ship C11 | Container ship 319 m | Ro-Ro | Tanker |
| Length overall | LOA | m | 152.9 | 275.8 | 335.5 | 147.9 | 236.5 |
| Length between perpendiculars | LPP | m | 142 | 262 | 319 | 135 | 227.5 |
| Breadth | B | m | 19.06 | 40 | 42.8 | 24.2 | 32.2 |
| Draft, full load | dfull | m | 6.15 | 12 | 13 | 5.50 | 11 |
| Freeboard, full load | f | m | 3.85 | 12.45 | 11.60 | 12.50 | 7.00 |
| Displacement, full load | D | t | 8 634 | 73 340 | 107 350 | 11 544 | 70 397 |
| Speed | Vs | kts | 30 | 20 | 25 | 20 | 15 |
| Froude number | Fn | - | 0.413 | 0.203 | 0.230 | 0.283 | 0.163 |
| Block coefficient | Cb | - | 0.507 | 0.569 | 0.590 | 0.625 | 0.852 |
| Bilge keels length | Lbk | m | 35.7 | 76.53 | 81 | 45 | 75 |
| Bilge keels breadth | Bbk | m | 0.55 | 0.40 | 0.50 | 0.30 | 0.30 |
| Bilge keels projected area | Ak | m2 | 34.009 | 58.023 | 57.276∙ | 19.092 | 31.82 |
| Added mass coefficient(*) | a | - | 0.1 | 0.1 | 0.1 | 0.094 | 0.1 |
| Radius of inertia coefficient(*) | k | - | 0.4 | 0.429 | 0.4 | 0.41 | 0.4 |
| Reference height of G | KGref | m | 7.998 | 18.239 | 18 | 12.215 | 12 |
| Metacentric height @ KGref | GMref | m | 1.5 | 1.973 | 2.174 | 1.638 | 1.7 |
| Roll period @ KGref | T0 | s | 14.12 | 25.7 | 24.43 | 16.27 | 20.78 |
| Starting value of KG(*) | KGstart | m | 7.00 | 14.00 | 15.00 | 9.00 | 10.00 |
| Pure loss limit angle(*) | RPL2 | - | 25 | 25 | 25 | 25 | 25 |
| GM variation limit(*) | RPR | - | 0.418 | 0.405 | 0.348 | 0.418 | 0.355 |
| Roll damping coefficient | B44 | N∙m∙s/rad | 4.018e7 | 1.027e9 | 1.099e9 | 1.721e8 | 2.463e8 |
| Superstructures | - | - | Yes | Yes | Yes | No | Yes |
| Data marked with (*) are defined later in this paper. | |||||||
The first ship is the David Taylor Model Basin hull number 5415, a naval ship presented by Moelgaard (2000). Included in her model are superstructure concepts inspired by those of the DDG51 Arleigh Burke.
The second ship is the C11 container ship, which is known to be vulnerable to parametric roll (France et al., 2001).
The third ship is a 319 m container ship. A fatal accident due to an extreme roll motion (not a parametric roll) occurred on a ship of this class in 2008. One of the causes determined by the experts was insufficient roll damping (Kaufmann, 2009). Numerical models of both container ships include the containers in full-load configuration.
The fourth ship is a Ro-Ro vessel presented by Garme (1997). Data for this ship have been provided by the KTH Royal Institute of Technology. Her superstructure has not been modelled. The KGmax curve associated with the first-generation criteria does not take weather criterion into account.
We chose the last ship from the DELFT ship database—a tanker that is wall-sided on 80% of her length—for her supposed non-vulnerability to both pure loss of stability and parametric roll. A simplified box-shaped superstructure was added to her model but has no influence on the KGmax curve associated with the current criteria.
We used the reference height of the center of gravity (KGref) to calculate the associated metacentric height in calm water (GMref) and natural roll period (T0) for each ship. The latter depends on the added mass coefficient and the radius of inertia coefficient (a and k, as defined in subsection 4.2.1). The roll period is given for the full-load displacement, except for the C11 container ship, whose associated draft is 12.339m (France et al., 2001). We calculated the roll damping coefficient B44 as described in subsection 4.2.2. Its value is given for the reference height of the center of gravity (KGref), the full load draft (12.339 m for the C11 container ship), the service speed (Vs), and a roll amplitude of 10 degrees.
3 Pure loss of stability failure mode 3.1 Presentation of criteriaHere, we briefly present the first-and second-level criteria for the pure loss of stability failure mode. These criteria are applied to ships having a service speed Froude number larger than 0.24. Although neither container ship nor the tanker fulfill this condition, we computed their KGmax curves that are associated with the levels 1 and 2 criteria.
3.1.1 First levelTo meet this criteria level, the minimum metacentric height in waves (GMmin) must be higher than 5 centimeters. The new regulation proposes two methods to calculate its value.
The first method considers a parallel water-plane area at the lowest draft dL:
| $ {d_L} = d - \left( {d - 0.25{d_{{\rm{full}}}};\frac{{L{S_W}}}{2}} \right) $ | (1) |
with:
d (m) draft corresponding to the loading condition in calm water (black line in Fig. 2);
dfull (m) draft, full load;
L (m) ship’s length;
SW 0.0334 wave steepness.
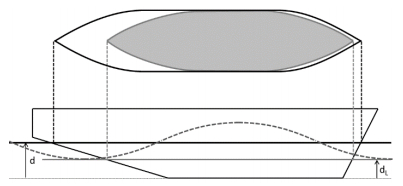
|
| Figure 2 Parallel water-plane at the lowest draft dL |
In most cases, the lowest draft can be simplified as follows:
| $ {d_L} = d - \frac{{L{S_W}}}{2} $ | (2) |
The minimum metacentric height is calculated as follows:
| $ {\rm{G}}{{\rm{M}}_{{\rm{min}}}} = {\rm{KB}} + \frac{{{I_L}}}{\nabla } - {\rm{KG}} $ | (3) |
with:
KB (m) height of the vertical center of buoyancy in calm water;
IL (m4) moment of inertia of the water-plane area at lowest draft dL (gray area in Fig. 2);
▽ (m3) volume of displacement;
KG (m) height of the vertical center of gravity.
This method considers that the moment of inertia of the water-plane area in waves is similar to that of the parallel water-plane area at the lowest draft dL (gray area in Fig. 2).
In the second method, the minimum metacentric height is computed for the ship balanced in trim and sinkage on sinusoidal waves. The wave length is equal to the ship’s length L and the height is h=SWL. The wave crest is centered at the longitudinal center of gravity and at each L/10 forward and aft.
3.1.2 Second LevelDetermination of the second-level criterion consists of a probabilistic approach to the phenomenon, associated with a wave scattering table. For an unrestricted sailing area, the new regulation imposes that found in the IACS Recommendation No. 34 (2001), which corresponds with the Northern Atlantic Table 2. This table lists 16 wave periods and 17 wave heights, and 197 waves have a non-zero number of occurrence. The new regulation allows for the use of another wave scattering table if the ship is sailing in a restricted area.
| HS/m | Number of occurrences: 100000 / TZ(s)=average zero up-crossing wave period | |||||||||||||||
| 3.5 | 4.5 | 5.5 | 6.5 | 7.5 | 8.5 | 9.5 | 10.5 | 11.5 | 12.5 | 13.5 | 14.5 | 15.5 | 16.5 | 17.5 | 18.5 | |
| 0.5 | 1.3 | 133.7 | 865.6 | 1186 | 634.2 | 186.3 | 36.9 | 5.6 | 0.7 | 0.1 | 0 | 0 | 0 | 0 | 0 | 0 |
| 1.5 | 0 | 29.3 | 986 | 4976 | 7738 | 5569.7 | 2375.7 | 703.5 | 160.7 | 30.5 | 5.1 | 0.8 | 0.1 | 0 | 0 | 0 |
| 2.5 | 0 | 2.2 | 197.5 | 2158.8 | 6230 | 7449.5 | 4860.4 | 2066 | 644.5 | 160.2 | 33.7 | 6.3 | 1.1 | 0.2 | 0 | 0 |
| 3.5 | 0 | 0.2 | 34.9 | 695.5 | 3226.5 | 5675 | 5099.1 | 2838 | 1114.1 | 337.7 | 84.3 | 18.2 | 3.5 | 0.6 | 0.1 | 0 |
| 4.5 | 0 | 0 | 6 | 196.1 | 1354.3 | 3288.5 | 3857.5 | 2685.5 | 1275.2 | 455.1 | 130.9 | 31.9 | 6.9 | 1.3 | 0.2 | 0 |
| 5.5 | 0 | 0 | 1 | 51 | 498.4 | 1602.9 | 2372.7 | 2008.3 | 1126 | 463.6 | 150.9 | 41 | 9.7 | 2.1 | 0.4 | 0.1 |
| 6.5 | 0 | 0 | 0.2 | 12.6 | 167 | 690.3 | 1257.9 | 1268.6 | 825.9 | 386.8 | 140.8 | 42.2 | 10.9 | 2.5 | 0.5 | 0.1 |
| 7.5 | 0 | 0 | 0 | 3 | 52.1 | 270.1 | 594.4 | 703.2 | 524.9 | 276.7 | 111.7 | 36.7 | 10.2 | 2.5 | 0.6 | 0.1 |
| 8.5 | 0 | 0 | 0 | 0.7 | 15.4 | 97.9 | 255.9 | 350.6 | 296.9 | 174.6 | 77.6 | 27.7 | 8.4 | 2.2 | 0.5 | 0.1 |
| 9.5 | 0 | 0 | 0 | 0.2 | 4.3 | 33.2 | 101.9 | 159.9 | 152.2 | 99.2 | 48.3 | 18.7 | 6.1 | 1.7 | 0.4 | 0.1 |
| 10.5 | 0 | 0 | 0 | 0 | 1.2 | 10.7 | 37.9 | 67.5 | 71.7 | 51.5 | 27.3 | 11.4 | 4 | 1.2 | 0.3 | 0.1 |
| 11.5 | 0 | 0 | 0 | 0 | 0.3 | 3.3 | 13.3 | 26.6 | 31.4 | 24.7 | 14.2 | 6.4 | 2.4 | 0.7 | 0.2 | 0.1 |
| 12.5 | 0 | 0 | 0 | 0 | 0.1 | 1 | 4.4 | 9.9 | 12.8 | 11 | 6.8 | 3.3 | 1.3 | 0.4 | 0.1 | 0 |
| 13.5 | 0 | 0 | 0 | 0 | 0 | 0.3 | 1.4 | 3.5 | 5 | 4.6 | 3.1 | 1.6 | 0.7 | 0.2 | 0.1 | 0 |
| 14.5 | 0 | 0 | 0 | 0 | 0 | 0.1 | 0.4 | 1.2 | 1.8 | 1.8 | 1.3 | 0.7 | 0.3 | 0.1 | 0 | 0 |
| 15.5 | 0 | 0 | 0 | 0 | 0 | 0 | 0.1 | 0.4 | 0.6 | 0.7 | 0.5 | 0.3 | 0.1 | 0.1 | 0 | 0 |
| 16.5 | 0 | 0 | 0 | 0 | 0 | 0 | 0 | 0.1 | 0.2 | 0.2 | 0.2 | 0.1 | 0.1 | 0 | 0 | 0 |
A ship is found to be not vulnerable to pure loss of stability if both CR1 and CR2 values are lower than RPL0=0.06. CR1 and CR2 are computed as follows:
| $ {\rm{CR}}1 = \mathop \sum \limits_{i = 1}^{197} {W_i}{\rm{C}}{1_i}\;\;\;\;\;\;\;\;\;\;\;\;\;{\rm{CR}}2 = \mathop \sum \limits_{i = 1}^{197} {W_i}{\rm{C}}{2_i} $ | (4) |
with:
Wi weighting factor of the wave number i taken from Table 2 (number of occurrences divided by 100, 000);
C1i coefficient for the wave number i regarding the minimum angle of vanishing stability ΦV.min (Fig. 3);
C2i coefficient for the wave number i regarding the maximum angle of stable equilibrium ΦS.max under action of a heeling lever RPL3 (Fig. 3).

|
| Figure 3 Righting arm curve on static wave with angle of stable equilibrium under heeling lever RPL3 (ΦS) and angle of vanishing stability (ΦV)B |
Waves are assumed to be sinusoidal. Their heights are taken from Table 2 (HS is twice the wave amplitude), and their lengths λ are linked to their zero-crossing periods TZ (Table 2) by the infinite depth relation given by:
| $ \lambda = \frac{{gT_Z^2}}{{2{\rm{\pi }}}} $ | (5) |
For each wave, the heeling lever RPL3 is defined as follows:
| $ {R_{PL3}} = 8\frac{{{H_s}}}{\lambda }dF_n^2 $ | (6) |
Then the minimum angle of vanishing stability (ΦV.min) and the maximum angle of stable equilibrium (ΦS.max) are computed for the 197 non-zero-weighted waves of the wave scatter diagram, and used these values to calculate C1i and C2i as follows:
| $ {\rm{C}}{1_i} = \left\{ {\begin{array}{*{20}{c}} {\rm{1}}&{{\rm{if }}{\Phi _{V.{\rm{min}}}}{\rm{ < }}{R_{PL{\rm{1}}}}}\\ {\rm{0}}&{{\rm{otherwise}}} \end{array}} \right. $ | (7) |
| $ {\rm{C}}{2_i} = \left\{ {\begin{array}{*{20}{c}} {\rm{1}}&{{\rm{if }}{\Phi _{S.{\rm{min}}}}{\rm{ < }}{R_{PL{\rm{2}}}}}\\ {\rm{0}}&{{\rm{otherwise}}} \end{array}} \right. $ | (8) |
with:
RPL1 30 degrees;
RPL2 25 degrees (15 degrees for passenger ships).
Since there are a large number of non-zero-weighted waves, the new regulation proposes a method to make the computation faster, based on Grim’s effective wave height concept (1961). For each wave of Table 2 defined by its zero-crossing period (TZ) and significant height (HS), an effective height for the top 3% highest waves H3%eff is computed. It corresponds to an equivalent wave whose length λ is equal to the ship’s length L. The effective wave height is computed using the following formulae:
| $ H_{3\% }^{{\rm{eff}}} = 5.9725\sqrt {{m_0}} $ | (9) |
| $ {m_0} = \mathop \smallint \limits_{0.01{\omega _L}}^{3{\omega _L}} {\left\{ {\frac{{\frac{{{\omega ^2}L}}{g}\sin \left( {\frac{{{\omega ^2}L}}{{2g}}} \right)}}{{{{\rm{\pi }}^2} - {{\left( {\frac{{{\omega ^2}L}}{{2g}}} \right)}^2}}}} \right\}^2}A{\omega ^5}{\rm{exp}}\left( { - B{\omega ^{ - 4}}} \right){\rm{d}}\omega $ | (10) |
| $ A = 173H_S^2T_{01}^{ - 4} $ | (11) |
| $ B = 691T_{01}^{ - 4} $ | (12) |
| $ {T_{01}} = 1.086{T_Z} $ | (13) |
| $ {\omega _L} = \sqrt {\frac{{2g{\rm{\pi }}}}{L}} $ | (14) |
The minimum angle of vanishing stability (ΦV.min) and the maximum angle of stable equilibrium (ΦS.max) are calculated for 11 effective waves with heights from zero to the maximum effective wave height corresponding to the ship’s length and the IACS wave scatter diagram (Table 2). For each effective wave, 10 GZ curves are computed, considering the ship balanced in trim and sinkage, and for the wave crest centered at the longitudinal center of gravity and at each λ/10 forward and aft. Only one GZ curve is needed for the first wave, which corresponds to calm water.
The values of ΦV.min and ΦS.max associated with any effective wave height are calculated using linear interpolation in the interval between two successive values of these 11 heights. Table 3 gives the effective wave heights (in meters) computed according to the Grim method for all the ships in this study, as associated with the waves of Table 2 having a zero-crossing period (TZ) equal to 10.5 seconds.
| HS / m | Naval L=142m |
Container L=262m |
Container L=319m |
Ro-Ro L=135m |
Tanker L=227.5m |
| 0.5 | 0.430 | 0.539 | 0.538 | 0.417 | 0.526 |
| 1.5 | 1.289 | 1.618 | 1.614 | 1.251 | 1.579 |
| 2.5 | 2.149 | 2.697 | 2.691 | 2.085 | 2.631 |
| 3.5 | 3.008 | 3.776 | 3.767 | 2.919 | 3.683 |
| 4.5 | 3.868 | 4.855 | 4.843 | 3.753 | 4.736 |
| 5.5 | 4.727 | 5.934 | 5.919 | 4.587 | 5.788 |
| 6.5 | 5.587 | 7.013 | 6.996 | 5.421 | 6.841 |
| 7.5 | 6.446 | 8.092 | 8.072 | 6.255 | 7.893 |
| 8.5 | 7.306 | 9.171 | 9.148 | 7.089 | 8.945 |
| 9.5 | 8.165 | 10.250 | 10.225 | 7.923 | 9.998 |
| 10.5 | 9.025 | 11.329 | 11.301 | 8.757 | 11.050 |
| 11.5 | 9.884 | 12.408 | 12.377 | 9.591 | 12.103 |
| 12.5 | 10.744 | 13.487 | 13.453 | 10.425 | 13.155 |
| 13.5 | 11.603 | 14.566 | 14.530 | 11.258 | 14.207 |
| 14.5 | 12.463 | 15.645 | 15.60 | 12.092 | 15.260 |
| 15.5 | 13.322 | 16.724 | 16.682 | 12.926 | 16.312 |
| 16.5 | 14.182 | 17.803 | 17.758 | 13.760 | 17.365 |
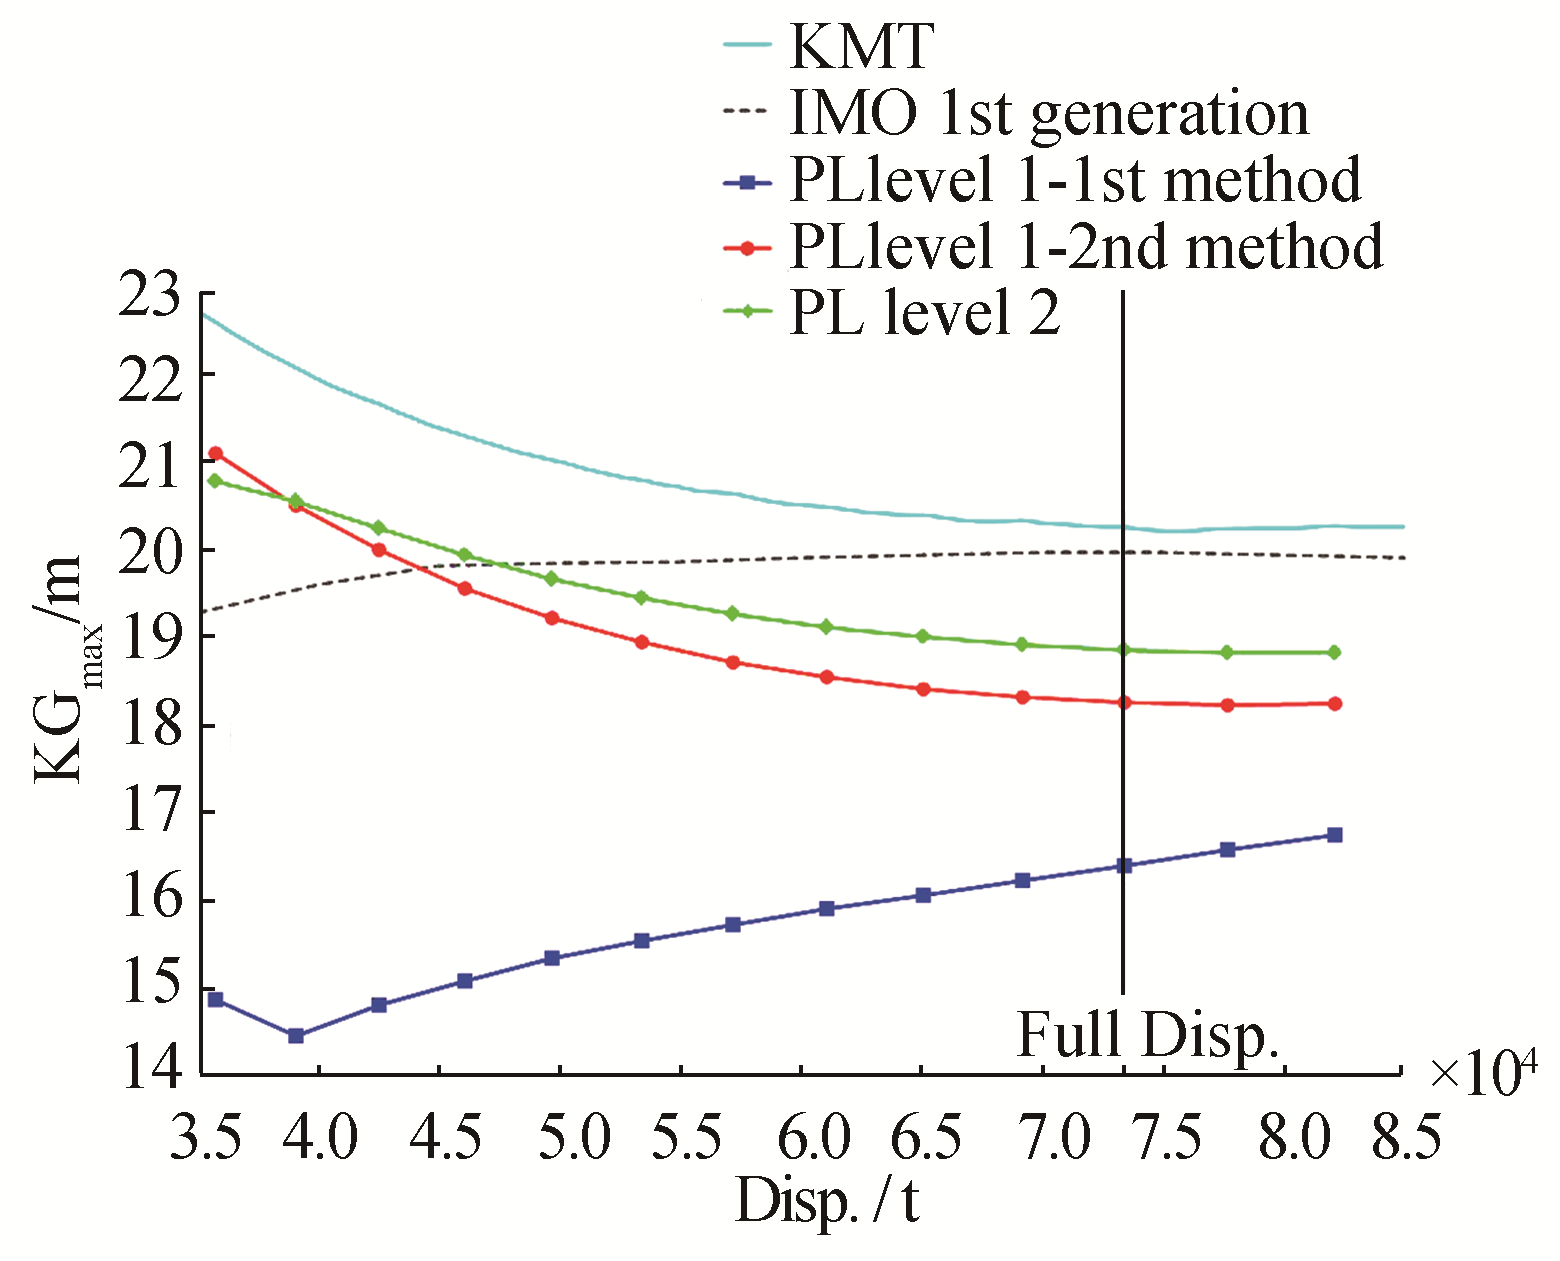
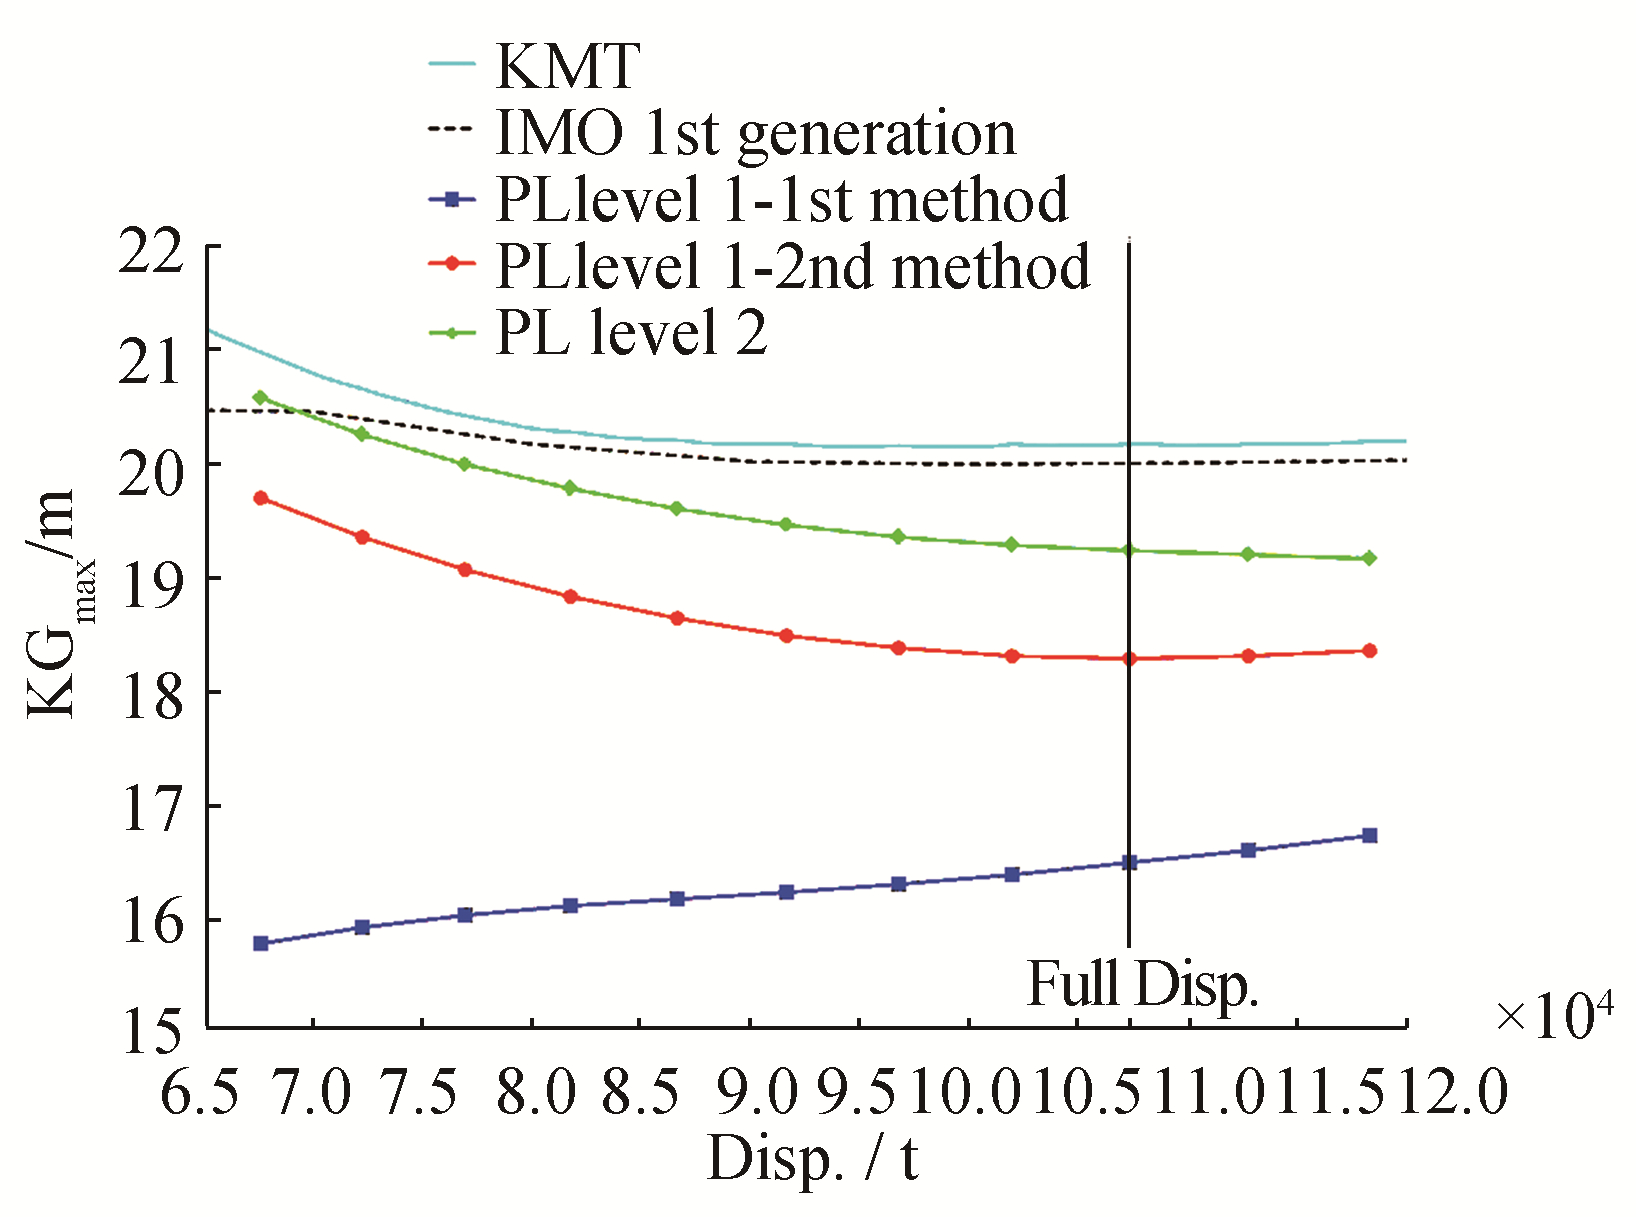
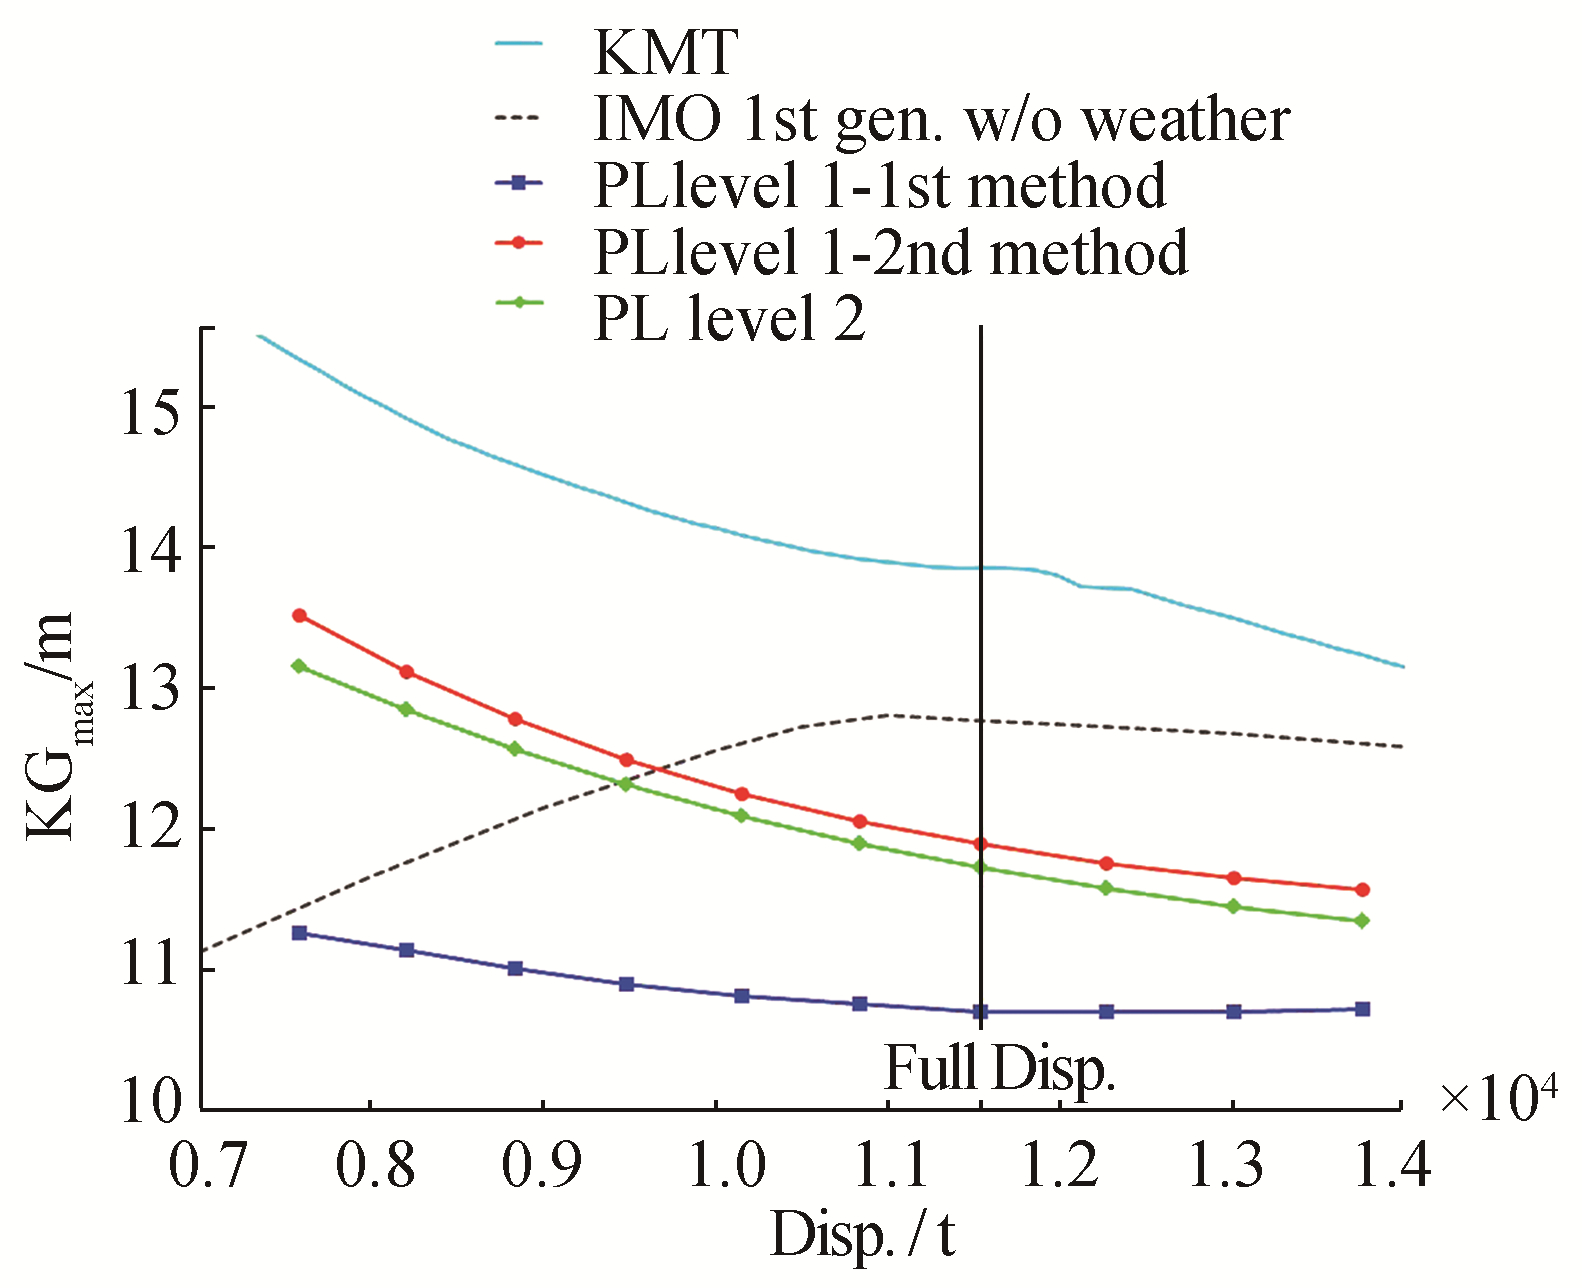
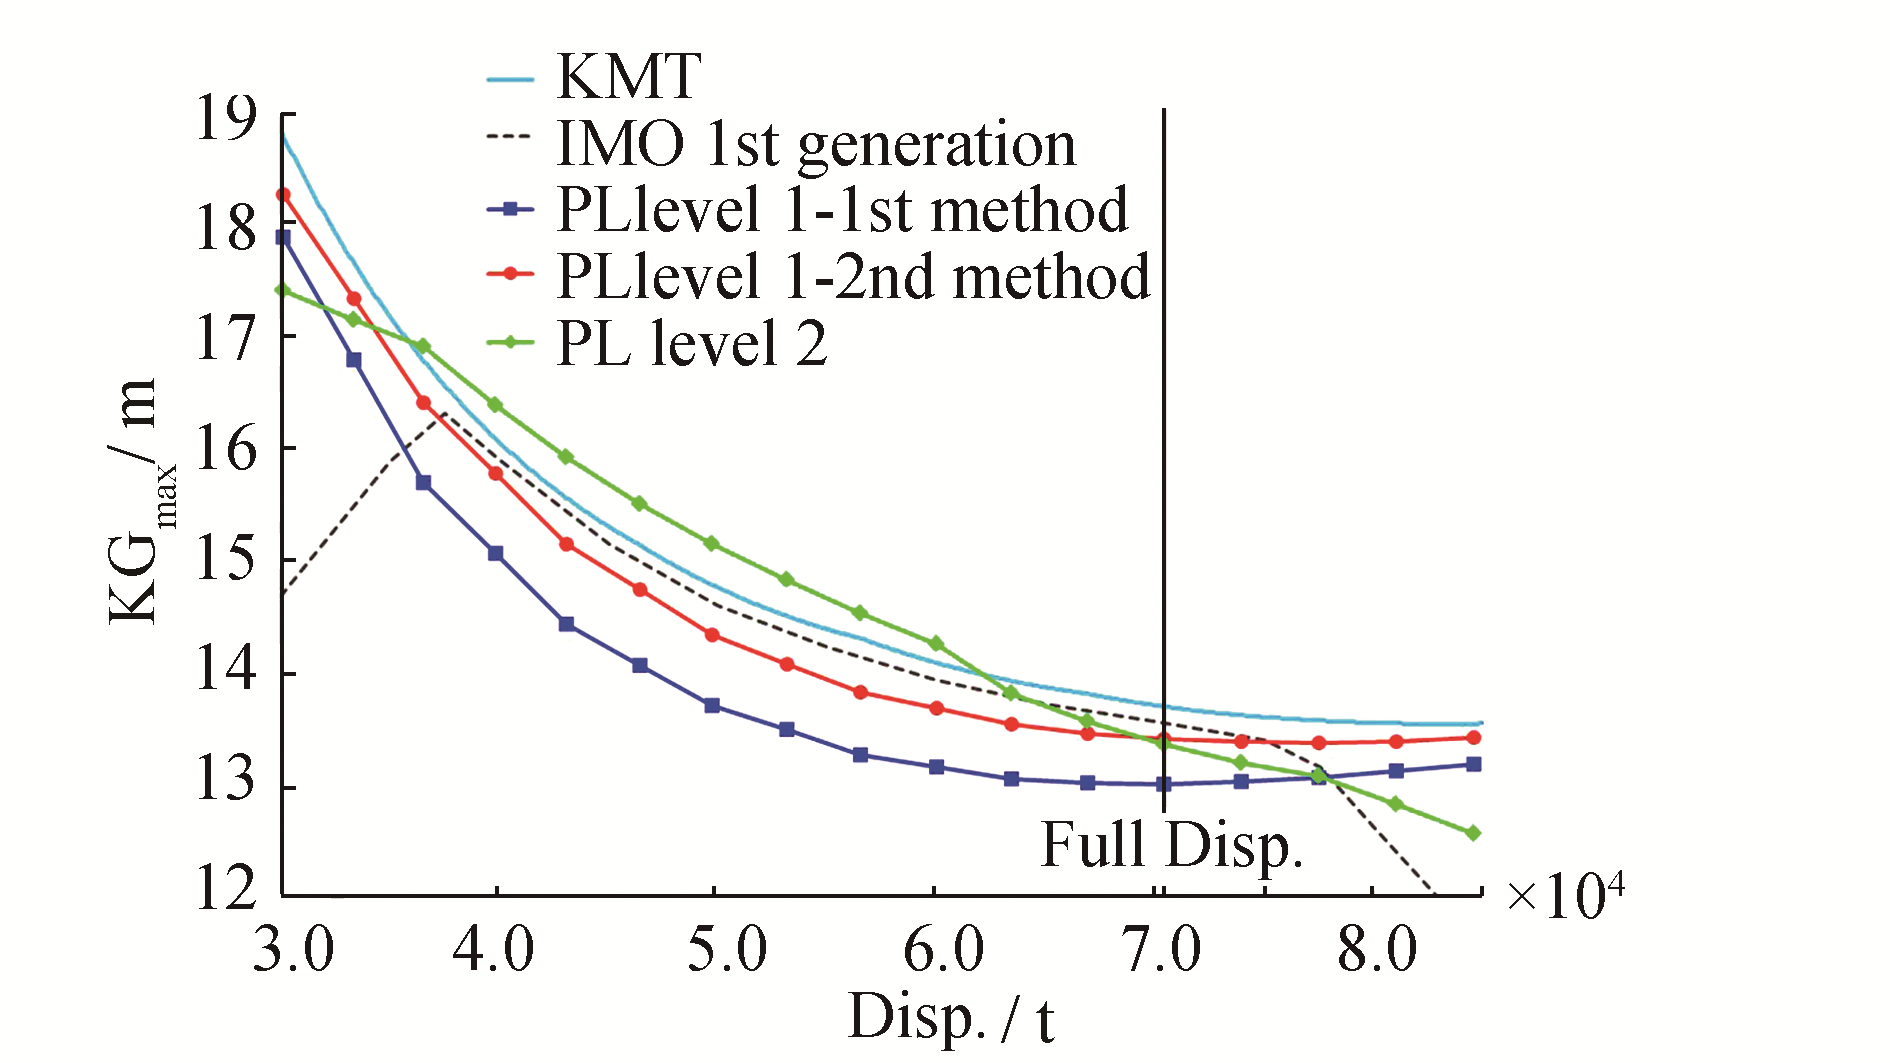
We computed the KGmax curves associated with the pure loss of stability levels 1 and 2 criteria for the five ships in this study. Hydrostatic computations in calm water and static waves were made using Calcoque software, which is published in a handbook (Grinnaert and Laurens, 2013) and was presented at the 12th International Conference on the Stability of Ships and Ocean Vehicles (Grinnaert et al., 2015). All computations were performed assuming a water density of 1.025 t/m3 and zero trim (the sinkage and trim remain free while the ships are balanced on waves). The KGmax curves are shown in Fig. 4 to Fig. 8.

|
| Figure 4 KGmax curves associated with the pure loss of stability criteria for the naval ship |
|
| Figure 5 KGmax curves associated with the pure loss of stability criteria for the C11 container ship |
|
| Figure 6 KGmax curves associated with the pure loss of stability criteria for the 319 m container ship |
|
| Figure 7 KGmax curves associated with the pure loss of stability criteria for the Ro-Ro vessel |
|
| Figure 8 KGmax curves associated with the pure loss of stability criteria for the tanker |
Those associated with the first generation regulation (IMO, 2009) are given for all ships and are drawn as dashed lines. That associated with the French military regulation (IG 6018A, DGA, 1999) is given for the naval ship only (dotted line). Depending on the displacement, the vertical coordinate of the metacenter (KMT) is shown in all figures as a solid line to allow for the determination of the minimum GM required by all criteria. The vertical lines indicate full load displacement and, when known, the light displacement. The KGmax curve determined by the first level-1 method (parallel water-plane) is marked“PL Level 1-1st method”in the figures (square markers). The KGmax curve determined by the second level-1 method (ship balanced in trim and sinkage on a wave of the same length) is marked“PL Level 1-2nd method” (round markers). The KGmax curve determined by the level-2 criterion is marked "PL Level 2" (diamond markers). A ship may be considered to be vulnerable to pure loss of stability if her KGmax curve associated with the current regulation (civilian or military) is located above the highest curve associated with the pure loss of stability criteria (we formulated this consideration in this paper, for both pure loss of stability and parametric roll failure modes). From these figures, we can observe the following:
1) The two level-1 methods yield significantly different results for all vessels, except the tanker.
2) The KGmax value given by the second level-1 method is relatively close to that given by the level-2 method for the C11 container ship and the Ro-Ro vessel.
3) The level-2 method can yield more conservative results than the second level-1 method (by one point for the C11 container ship and more markedly for the naval ship and the Ro-Ro vessel). This is contrary to our understanding of the intent regarding future regulation.
4) The level-2 method allows for a negative GM for the tanker. This is due to the consideration of the GZ curve instead of GM in this criterion. Fig. 3 shows a GZ curve with a negative GM, which has a positive contribution to the criterion (C1i and C2i are not increased): ΦV is larger than RPL1 (30 degrees) and ΦS is lower than RPL2 (25 degrees).
5) According to these criteria, the naval ship and the tanker are not vulnerable to pure loss of stability, but both container ships are vulnerable, irrespective of the Froude number. No conclusions can be drawn with regard to the Ro-Ro vessel, since her superstructure has not been modelled and the weather criterion is not taken into account.
4 Parametric roll failure mode 4.1 Presentation of criteriaNext, we briefly present the first-and second-level criteria for the parametric roll failure mode. For more details please refer to SDC 2/WP.4 and SDC 3/WP.5.
4.1.1 First levelThe first-level criteria of the parametric roll requires that the amplitude of the variation of the metacentric height in waves (ΔGM) be less than RPR, whose value is between 0.17 (ship without a bilge keel) and 1.87 (ships with a large bilge keel). The new regulation proposes two methods for calculating ΔGM.
In the first method, two parallel water-planes are considered. The first is a low draft (dL) water-plane, and its moment of inertia is IL. The second is a high draft (dH) water-plane, and its moment of inertia is IH, with:
| $ {d_L} = d - {\rm{min}}\left( {d - 0.25{d_{{\rm{full}}}};\frac{{L{S_W}}}{2}} \right) $ | (15) |
| $ {d_H} = d + {\rm{min}}\left( {D - d;\frac{{L{S_W}}}{2}} \right) $ | (16) |
d (m) draft corresponding to the loading condition;
dfull (m) draft, full load;
D (m) ship’s depth;
L (m) ship’s length;
SW 0.0167 wave steepness.
In most cases, both drafts can be simplified as follows:
| $ {d_L} = d - \frac{{L{S_W}}}{2} $ | (17) |
| $ {d_H} = d + \frac{{L{S_W}}}{2} $ | (18) |
The amplitude of the variation of the metacentric height is calculated as follows:
| $ \Delta {\rm{GM}} = \frac{{{I_H} - {I_L}}}{{2\nabla }} $ | (19) |
In the second method, 10 metacentric heights are computed for the ship balanced in trim and sinkage in sinusoidal waves. The wave length is equal to the ship’s length L and the height is h=SWL. The wave crest is centered at the longitudinal center of gravity and at each L/10 forward and aft. We use the minimum and maximum values of GM to calculate ΔGM, as follows:
| $ \Delta {\rm{GM}} = \frac{{{\rm{G}}{{\rm{M}}_{{\rm{max}}}} - {\rm{G}}{{\rm{M}}_{{\rm{min}}}}}}{2} $ | (20) |
For the second level criterion, a probabilistic approach to the phenomenon is considered, by which a ship is found to be not vulnerable to parametric roll if the values of C1 and C2 are lower than RPR0=0.06.
The value of C1 is computed as follows, based on a table that lists 16 weighted waves (Table 4, calculated from the wave scatter diagram using the method described in SDC 3/WP.5):
| $ {\rm{C}}1 = \mathop \sum \limits_{i = 1}^{16} {W_i} \cdot {{\rm{C}}_i} $ | (21) |
| Wave number i | Weight Wi | Wave length λi / m | Wave height Hi / m |
| 1 | 0.000013 | 22.574 | 0.350 |
| 2 | 0.001654 | 37.316 | 0.495 |
| 3 | 0.020912 | 55.743 | 0.857 |
| 4 | 0.092799 | 77.857 | 1.295 |
| 5 | 0.199218 | 103.655 | 1.732 |
| 6 | 0.248788 | 133.139 | 2.205 |
| 7 | 0.208699 | 166.309 | 2.697 |
| 8 | 0.128984 | 203.164 | 3.176 |
| 9 | 0.062446 | 243.705 | 3.625 |
| 10 | 0.024790 | 287.931 | 4.040 |
| 11 | 0.008367 | 335.843 | 4.421 |
| 12 | 0.002473 | 387.440 | 4.769 |
| 13 | 0.000658 | 442.723 | 5.097 |
| 14 | 0.000158 | 501.691 | 5.370 |
| 15 | 0.000034 | 564.345 | 5.621 |
| 16 | 0.000007 | 630.684 | 5.950 |
where Wi is the wave weighting factor from Table 4, and Ci is equal to 0 if condition A or B is satisfied, and is equal to 1 otherwise.
Condition A is as follows:
| $ {\rm{G}}{{\rm{M}}_i} > 0\;\;\;\;\;\;\;\;{\rm{and}}\;\;\;\;\;\;\;\;\frac{{\Delta {\rm{G}}{{\rm{M}}_i}}}{{{\rm{G}}{{\rm{M}}_i}}} < {R_{{\rm{PR}}}} $ | (22) |
with:
GMi (m) average value of 10 metacentric heights computed for the wave number i, with the wave crest centered at the longitudinal center of gravity and at each λi/10 forward and aft;
ΔGMi (m) one-half of the difference between the maximum and minimum values of the 10 metacentric heights.
Condition B is as follows:
| $ {V_{PR.i}} > {V_S} $ | (23) |
with:
VS (m/s) ship’s speed;
VPR.i (m/s) reference speed corresponding to the parametric resonance conditions, calculated as follows:
| $ {V_{PR.i}} = \left| {\frac{{2{\lambda _i}}}{{{T_0}}}\sqrt {\frac{{G{M_i}}}{{G{M_c}}}} - \sqrt {g\frac{{{\lambda _i}}}{{2{\rm{\pi }}}}} } \right| $ | (24) |
with:
λi (m) wave length (from Table 4);
T0 (s) natural roll period of the ship in calm water;
GMi (m) as defined above;
GMc (m) metacentric height in calm water.
The C2 coefficient is calculated from the maximum roll angle of the ship on each of the 197 non-zero-weighted waves of the wave scatter diagram (Table 2, or another table if the ship is sailing in a restricted area), considering seven speeds. For a given wave and a given speed, the maximum roll angle is the maximum absolute value of the solution Φ(t) of the differential equation of the parametric roll, which can be established as follows:
| $ {J_{44}}\ddot \Phi + {B_{44}}\dot \Phi + W \cdot {\rm{GZ}}\left( {\Phi ,t} \right) = 0 $ | (25) |
with:
Φ (rad) roll angle;
J44 (kg∙m2) oll moment of inertia, including added mass;
B44 (N∙m∙s/rad) damping coefficient;
W (N) ship’s weight;
GZ(Φ, t) (m) righting arm, function of roll angle F and time t, varying with the wave encounter frequency;
The C2 coefficient is calculated as follows:
| $ {\rm{C}}2 = \frac{1}{7}\mathop \sum \limits_{i = 1}^{197} \mathop \sum \limits_{j = 1}^7 {W_i}.{\rm{C}}{2_{i,j}} $ | (26) |
The weighting factor Wi is extracted from the wave scattering table (Table 2). The coefficient C2i, j is equal to 1 if the maximum roll angle of the Φ(t) function solution of the differential equation for wave number i and the speed KjVS is higher than 25 degrees, and is 0 otherwise. The speed factors Kj are given in Table 5.
| Number j | Speed factor Kj |
| 1 | -1 |
| 2 | -0.866 |
| 3 | -0.5 |
| 4 | 0 |
| 5 | 0.5 |
| 6 | 0.866 |
| 7 | 1 |
Since there are a large number of non-zero-weighted waves in Table 2, the new regulation proposes the use of the Grim(1961) effective wave height concept to make the computation faster. This methodology is similar to that used for pure loss of stability. However, the effective height is considered to be one of the top 1/3 highest waves, and is calculated as follows:
| $ H_{1/3}^{{\rm{eff}}} = 4.0043\sqrt {{m_0}} $ | (27) |
The maximum roll angle Φmax is computed by solving the differential equation Eq. (25) for 10 effective waves whose heights are a fraction (from 0.1 to 1) of the maximum effective wave height, corresponding to the ship’s length and the wave scatter diagram (Table 2). Linear interpolation is used to calculate the maximum roll angle associated with any effective wave height. Table 6 gives the effective wave heights (in meters) computed using the Grim method for all ships and associated with the waves of Table 2 that have a zero-crossing period (TZ) equal to 10.5 seconds.
| HS /m | Naval L=142m |
Container L=262m |
Container L=319m |
Ro-Ro L=135m |
Tanker L=227.5m |
| 0.5 | 0.288 | 0.362 | 0.361 | 0.280 | 0.353 |
| 1.5 | 0.865 | 1.085 | 1.082 | 0.839 | 1.059 |
| 2.5 | 1.442 | 1.809 | 1.804 | 1.399 | 1.764 |
| 3.5 | 2.018 | 2.532 | 2.525 | 1.958 | 2.470 |
| 4.5 | 2.595 | 3.256 | 3.247 | 2.518 | 3.176 |
| 5.5 | 3.171 | 3.979 | 3.968 | 3.077 | 3.882 |
| 6.5 | 3.748 | 4.703 | 4.690 | 3.637 | 4.587 |
| 7.5 | 4.325 | 5.426 | 5.411 | 4.196 | 5.293 |
| 8.5 | 4.901 | 6.149 | 6.133 | 4.756 | 5.999 |
| 9.5 | 5.478 | 6.873 | 6.854 | 5.315 | 6.705 |
| 10.5 | 6.054 | 7.596 | 7.576 | 5.875 | 7.410 |
| 11.5 | 6.631 | 8.320 | 8.297 | 6.434 | 8.116 |
| 12.5 | 7.208 | 9.043 | 9.019 | 6.993 | 8.822 |
| 13.5 | 7.784 | 9.767 | 9.740 | 7.553 | 9.528 |
| 14.5 | 8.361 | 10.490 | 10.462 | 8.112 | 10.234 |
| 15.5 | 8.937 | 11.214 | 11.183 | 8.672 | 10.939 |
| 16.5 | 9.514 | 11.937 | 11.905 | 9.231 | 11.645 |
The future regulation proposes to calculate the maximum roll angle by analytically solving the differential equation. It also allows for a one-degree-of-freedom time domain simulation to solve the differential equation. Some solving conditions have recently been specified (initial roll angle, initial roll speed, time step, simulation duration, see SDC 3/WP.5). In this study, we used this second method, and specify below the methods used and the conditions for solving the differential equation and computing the value of KGmax.
4.2 Maximum roll angle and KGmax computation methodsWe have already presented the differential equation to be solved as Eq. (25) above.
4.2.1 Moment of inertiaWe calculate the moment of inertia J44 as follows:
| $ {J_{44}} = {\rm{\Delta }}\left( {1 + a} \right){\left( {kB} \right)^2} $ | (28) |
with:
Δ (kg) ship’s displacement;
a - added mass coefficient;
k - radius of inertia coefficient;
B (m) ship’s breadth.
The ship’s natural roll period in calm water (T0) is linked to her moment of inertia, as follows:
| $ {T_0} = 2{\rm{\pi }}\sqrt {\frac{{{J_{44}}}}{{g{\rm{\Delta GM}}}}} = 2{\rm{\pi }}kB\sqrt {\frac{{1 + a}}{{g{\rm{GM}}}}} $ | (29) |
with:
g 9.81 m/s2 gravitational acceleration;
GM (m) metacentric height in calm water.
When the ship’s roll period is known, we then choose the coefficients a and k. If it is not known, we set coefficient a to 0.1 and k to 0.4. The values of both a and k are given in Table 1 for all ships.
4.2.2 Roll dampingWe calculate the roll damping coefficient B44 using the method proposed by Kawahara et al. (2009), and take into account the ship’s speed using the method proposed by Ikeda et al. (1978). The roll damping coefficient B44 depends on the roll amplitude (φa in Kawahara et al., 2009). In this study, we pre-computed B44 for 11 roll amplitude values from 1 to 50 degrees and used linear interpolation using the value of the current roll amplitude during the solving of the differential equation. The roll damping coefficient B44 also depends on the distance between the center of gravity and the calm water surface (OG in Kawahara et al., 2009) and on the ship’s roll period (T0). Both are linked to the KG. Thus, pre-computation of B44 is required for all roll amplitudes in all iterations of the search for KGmax.
4.2.3 Righting armWe calculate the righting arm using a simplified method proposed by Peters et al. (2015) and the new regulation (SDC 3/WP.5, IMO, 2016), as follows:
| $ {\rm{GZ}}\left( \Phi \right) = {\rm{G}}{{\rm{Z}}_0}\left( \Phi \right) - \left( {{\rm{G}}{{\rm{M}}_0} - {\rm{G}}{{\rm{M}}_{{\rm{moy}}}} - {\rm{\Delta GM}} \cdot \sin \left( {{\omega _e}t} \right)} \right)\sin \Phi $ | (30) |
with:
GZ0(Φ) (m) righting arm in calm water associated with a user-fixed height of the center of gravity (KG0);
GM0 (m) metacentric height in calm water associated with KG0.
GMmoy (m) average value of the metacentric height in waves, associated with the considered KG, which may differ from KG0;
ΔGM (m) amplitude of the variation of the metacentric height in waves;
ωe (rad/s) wave encounter frequency.
Belenky et al., (2011) demonstrated that this simplified method yields acceptable GZ values up to an angle of 30 degrees. Since the C2 coefficient is increased if the maximum roll angle exceeds 25 degrees, we can used this method in this study and it speeds up the computation of the maximum roll angle and KGmax. We pre-computed the righting arm in calm water (GZ0) for heel angles from 0 to 50 degrees with a step of 5 degrees. During the simulation, we used linear interpolation to calculate its value for any roll angle Φ. We computed GMmoy and ΔGM before the simulation by computing the GM of the considered sinusoidal wave for 10 ship positions on the wave. GMmoy is the average value of the 10 metacentric heights. ΔGM is half the difference between the maximum and minimum values. During the search for KGmax, we updated the value of GMmoy with the considered value of KG.
We used GMmoy to calculate the ship’s natural roll period T0, which is needed to calculate the damping coefficient B44. Thus, if GMmoy is negative, simulation is not possible and the C2 coefficient value is forced to 1.
We calculated the wave encounter frequency ωe as follows:
| $ {\omega _e} = {\omega _w}\left( {1 + {\omega _w}\frac{{{K_j}{V_s}}}{g}} \right) $ | (31) |
with:
ωw (rad/s) wave frequency.
The positive values of the speed factors Kj (from Table 5) correspond to head seas, and negative values correspond to following seas.
4.2.4 Solving methodTo solve the differential equation, we used the Runge-Kutta 4th-order method.
4.2.5 Initial conditionsAs proposed by Peters et al. (2015) and the new regulation (SDC 3/WP.5), the initial roll angle is equal to 5 degrees, and the initial roll speed is null.
4.2.6 Simulation timeThe time duration of the simulation is equal to 15 times the ship’s natural roll period, as also proposed by Peters et al. (2015) and the new regulation (SDC 3/WP.5). Computations performed with 10 and 20 roll periods give exactly the same value of KGmax, which proves that a time duration of 15 roll periods is long enough to attain a steady-state roll amplitude. The simulation is interrupted if the roll angle exceeds 50 degrees.
4.2.7 Time stepWe set the time step to one 40th of the ship’s natural roll period, and validated this value by removing the damping and GM variation from the differential equation to simulate an undamped roll on calm water. The roll amplitude remained equal to the initial roll angle. This test fails if the Euler method, rather than the Runge-Kutta method, is used to solve the differential equation (the roll amplitude increases). Peters et al. (2015) and SDC 3/WP.5 propose a time step equal to one 30th of the ship’s natural roll period.
4.2.8 Simulation implementationWe performed the hydrostatic computations using Calcoque software (Grinnaert et al., 2015), with the water density equal to 1.025 t/m3. We also solved the differential equation and calculated the damping coefficient with this software to make a user-friendly computation of the C2 coefficient and the associated KGmax curves.
4.2.9 KGmax computationWe determined the KGmax associated with the C2 coefficient in two steps.
In the first step, we found the first value of KG for which the C2 coefficient is lower than RPR0 and a second value of KG for which C2 is larger than RPR0. To find this interval, we began with a low value of KG for which C2 is lower than RPR0, near zero. We called this KG value the“KG starting value, ”denoted as“KGstart”. We then increased the value of KG by 10 centimeters in each iteration until C2 became higher than RPR0.
The second step is based on a classical dichotomy to find the highest value of KG that corresponds to a C2 value lower than RPR0, at the required precision of 0.1 mm. Since C2 is the sum of the weighting coefficients drawn from the IACS wave scatter diagram (number of occurrences of each wave in Table 2 divided by 100 000), it is not possible to let the value of C2 be equal to RPR0. Table 7 shows the values of KG and C2 while finding the KGmax for the naval ship in this study, at a draft of 6.125 m. The associated KGmax is 9.2236 m (in gray in).
| First step: finding the interval | |||
| Iteration | KG (m) | C2 | C2 < R PR0 |
| 1 | KG start=7 | 0 | Y |
| 2 | 7.1 | 0 | Y |
| 3 | 7.2 | 0 | Y |
| 4 | 7.3 | 0 | Y |
| 5 | 7.4 | 0 | Y |
| 6 | 7.5 | 0 | Y |
| 7 | 7.6 | 0 | Y |
| 8 | 7.7 | 0 | Y |
| 9 | 7.8 | 2.86E-07 | Y |
| 10 | 7.9 | 1.57E-06 | Y |
| 11 | 8.0 | 4.29E-07 | Y |
| 12 | 8.1 | 0 | Y |
| 13 | 8.2 | 0 | Y |
| 14 | 8.3 | 0 | Y |
| 15 | 8.4 | 0 | Y |
| 16 | 8.5 | 0 | Y |
| 17 | 8.6 | 2.49E-05 | Y |
| 18 | 8.7 | 0.0293483 | Y |
| 19 | 8.8 | 0.017636 | Y |
| 20 | 8.9 | 0.00266057 | Y |
| 21 | 9.0 | 0.000234857 | Y |
| 22 | 9.1 | 3.13E-05 | Y |
| 23 | 9.2 | 0.0219234 | Y |
| 24 | 9.3 | 0.154703 | N |
| Second step: dichotomy | |||
| Iteration | KG (m) | C2 | C2 < R PR0 |
| 25 | 9.25 | 0.0760626 | N |
| 26 | 9.225 | 0.0749527 | N |
| 27 | 9.2125 | 0.0371166 | Y |
| 28 | 9.21875 | 0.0449244 | Y |
| 29 | 9.22188 | 0.0462103 | Y |
| 30 | 9.22344 | 0.0464114 | Y |
| 31 | 9.22422 | 0.07403 | N |
| 32 | 9.22383 | 0.0740291 | N |
| 33 | 9.22363 | 0.0502479 | Y |
| 34 | 9.22373 | 0.0740291 | N |
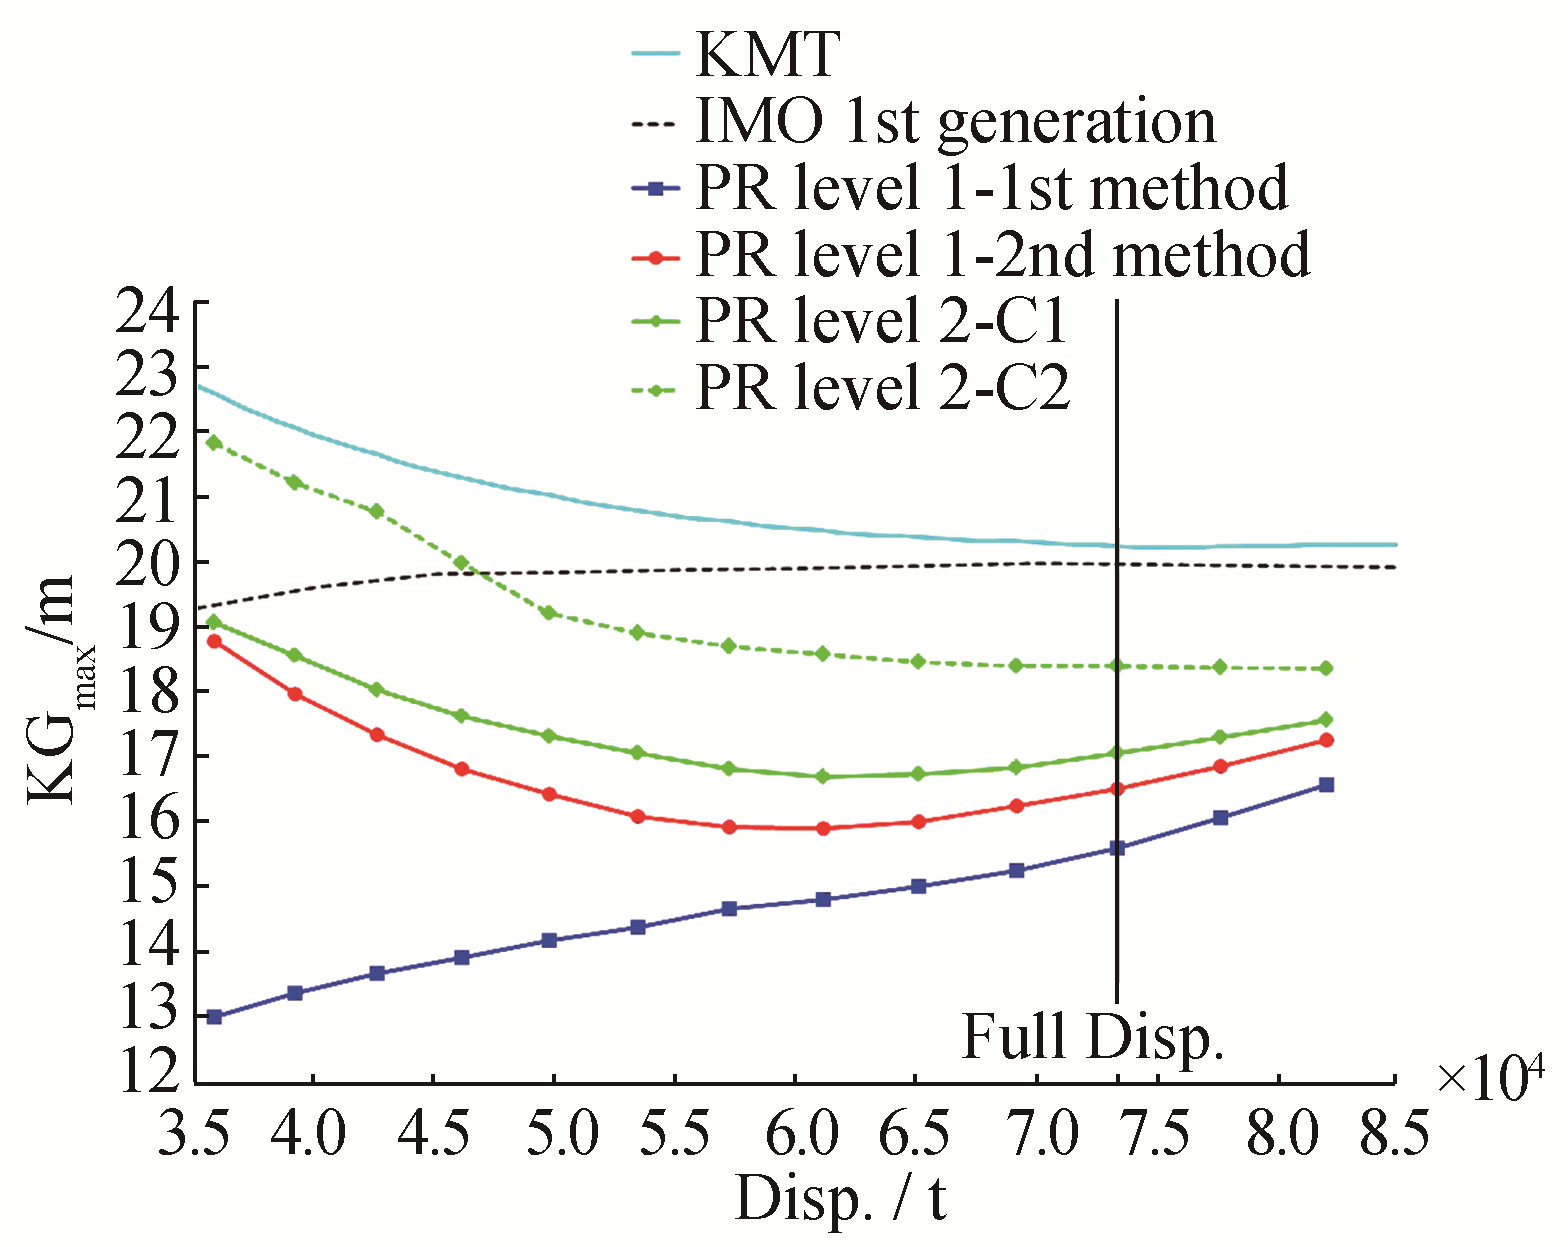
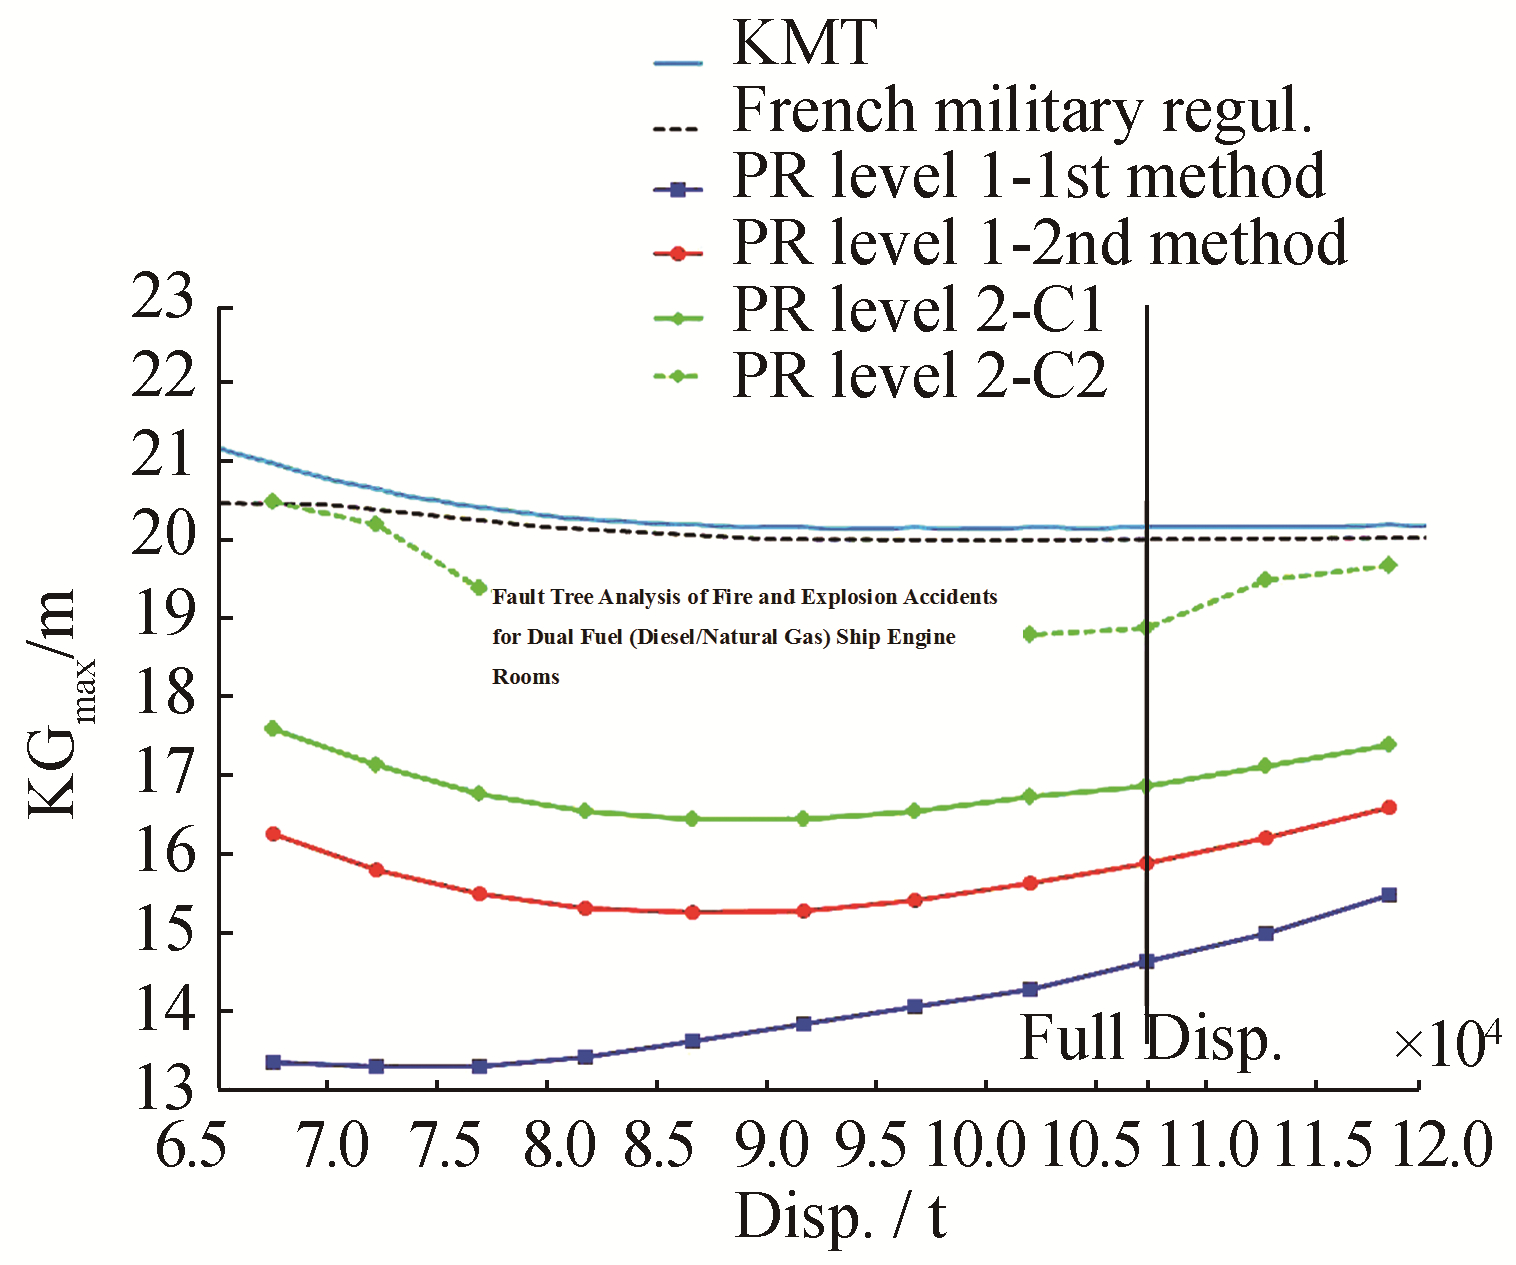
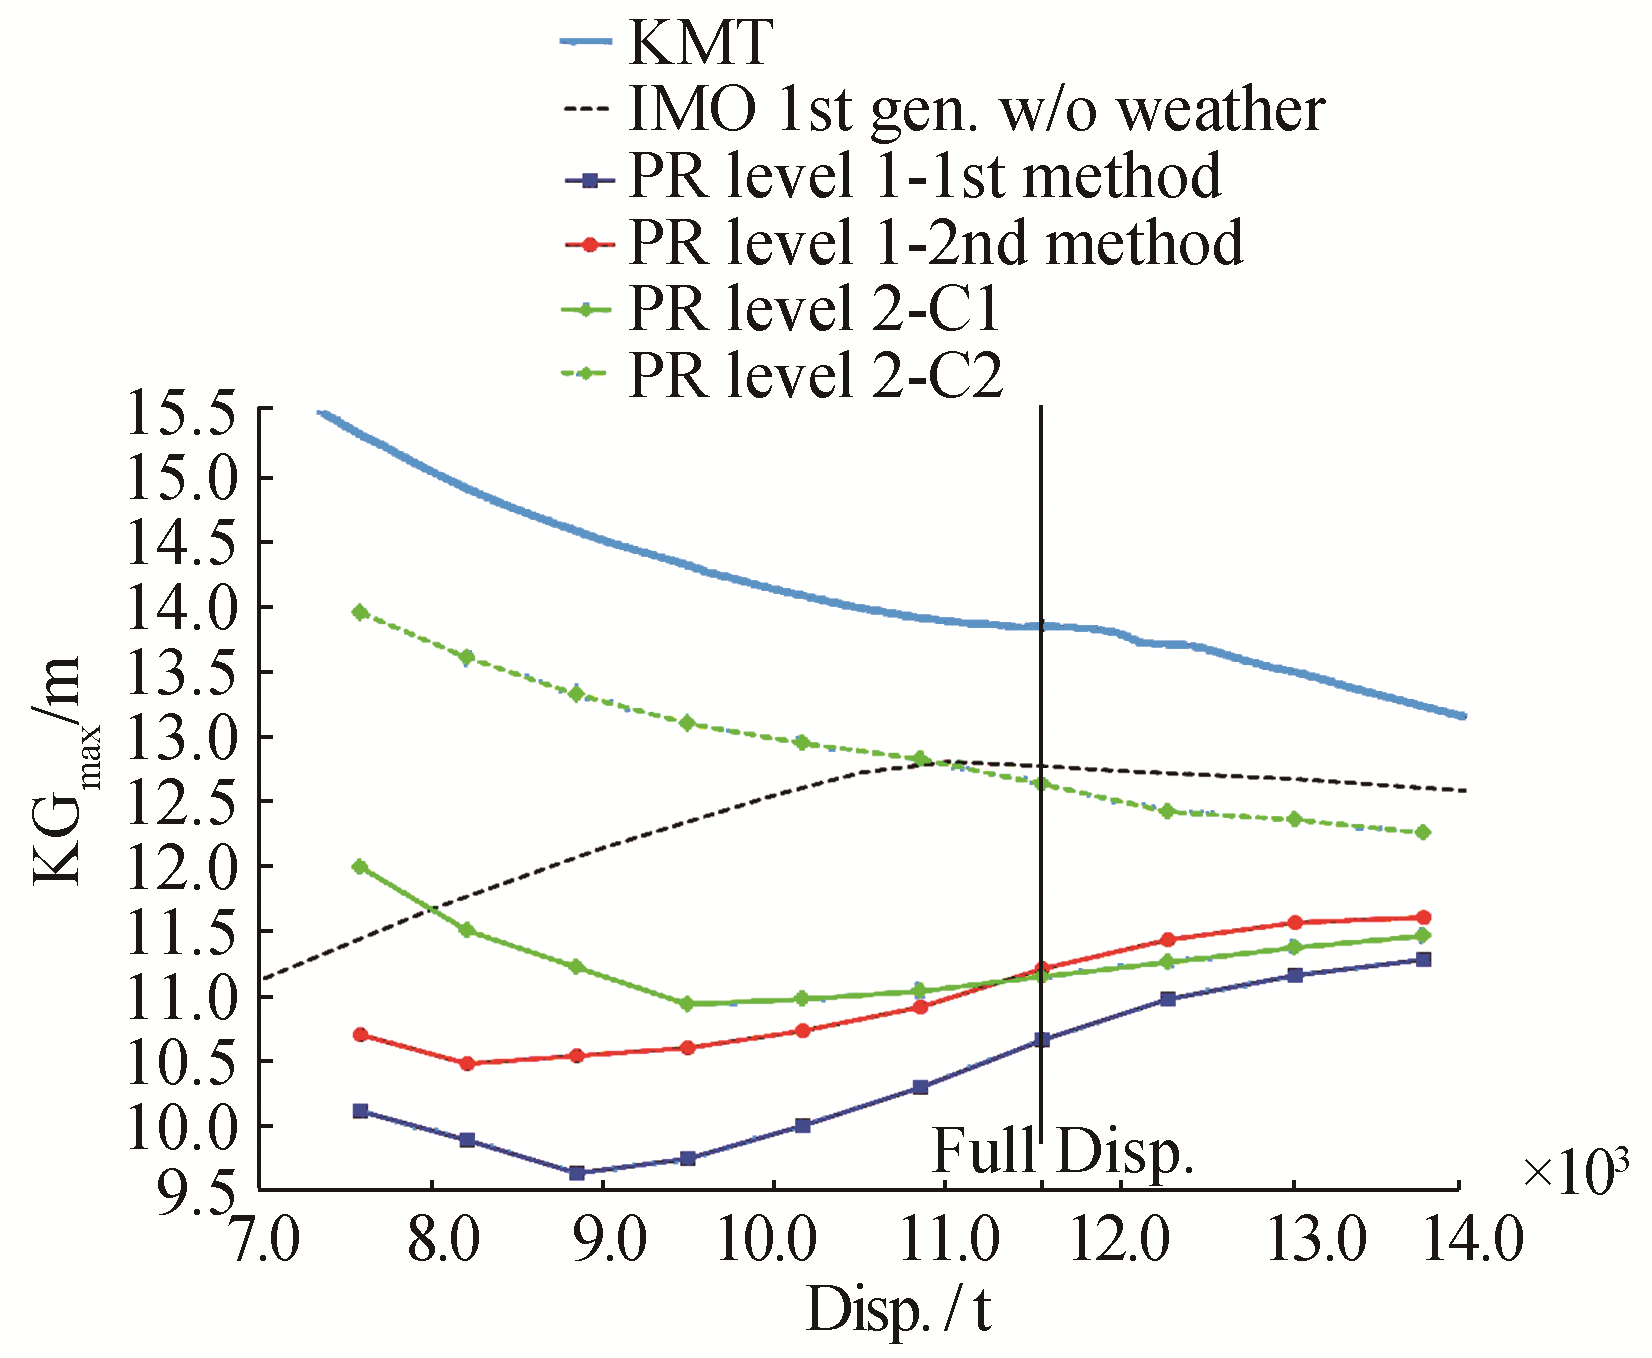
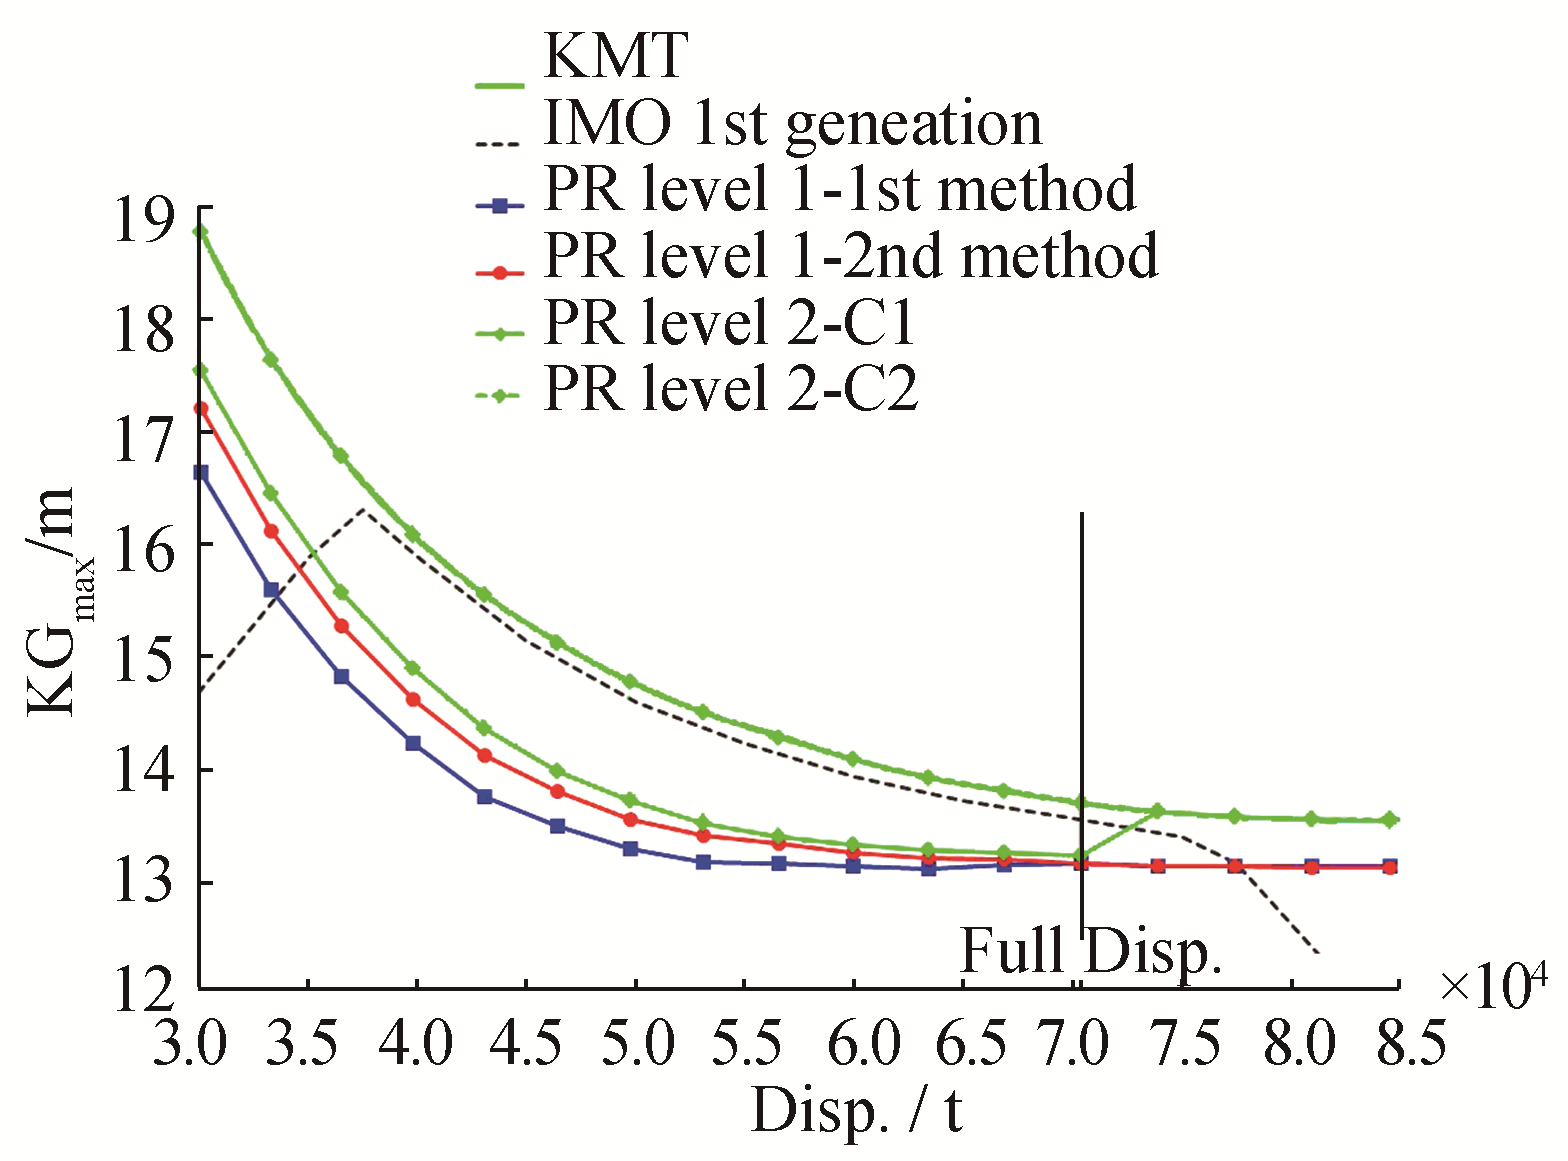
We computed the KGmax curves associated with the parametric roll levels 1 and 2 criteria for the five ships in this study, as shown in Fig. 9 to Fig. 13. The KGmax curve determined by the first level-1 method (parallel water-plane) is marked“PR Level 1-1st method” (square markers), and that by the second level-1 method (ship balanced in trim and sinkage on a wave with the same length) is marked“PR Level 1-2nd method” (round markers). The KGmax curve determined by the level-2 C1 criterion is marked“PR Level 2-C1” (solid line with diamond markers). The KGmax curve determined by the level-2 C2 criterion is marked“PR Level 2–C2” (dashed line with diamond markers). Although coefficients C1 and C2 use the same criterion, they are considered as separate criteria in this paper. Based on our results, we can make following observations, some of which are similar to those observed for the pure loss of stability failure mode:

|
| Figure 9 KGmax curves associated with the parametric roll criteria for the naval ship |
|
| Figure 10 KGmax curves associated with the parametric roll criteria for the C11 container ship |
|
| Figure 11 KGmax curves associated with the parametric roll criteria for the 319m container ship |
|
| Figure 12 KGmax curves associated with the parametric roll criteria for the Ro-Ro vessel |
|
| Figure 13 KGmax curves associated with the parametric roll criteria for the tanker (C2 and KMT curves are fully coincident) |
1) For the naval ship, the results of the two level-1 methods differ significantly.
2) The KGmax value determined by the second level-1 method is almost equal to that given by level-2 C1 for the naval ship and is close to that of the tanker.
3) For the Ro-Ro vessel, the level-2 C1 is somewhat more conservative than the second level-1 method.
4) Both first-level methods yield the same KGmax for the tanker at full load displacement and beyond. This result is as expected due to the cylindrical shape of the hull.
5) For the tanker, the criterion of the level-2 C1 is limited by the zero-GM at full load displacement and beyond (condition A, criterion C1).
6) The level-2 C2 curve of the tanker is fully coincident with that linked to KMT. This is due to the limit determined by the negative GMmoy (see subsection 4.2.3) and shows that the ship is not vulnerable to parametric roll.
7) Both curves given by the C1 and C2 criteria differ significantly for all ships (except for the tanker at full load displacement). The C2 criterion is always less conservative than C1.
8) The curve linked to the C2 criterion for the 319-m container ship has two peculiar jumps. A lesser jump occurs on the same curve for the C11 container ship (at full load displacement). This point is discussed in the next subsection.
9) According to these criteria, the naval ship and tanker are considered to be not vulnerable to parametric roll. The Ro-Ro vessel may also be considered to be not vulnerable because its highest KGmax curve (C2) has only one point below the curve given by the 1st-generation criteria, which may be lower if the weather criterion are taken into account. According to these criteria, both container ships are considered to be vulnerable. This confirms what is already known for the C11 (France et al., 2001).
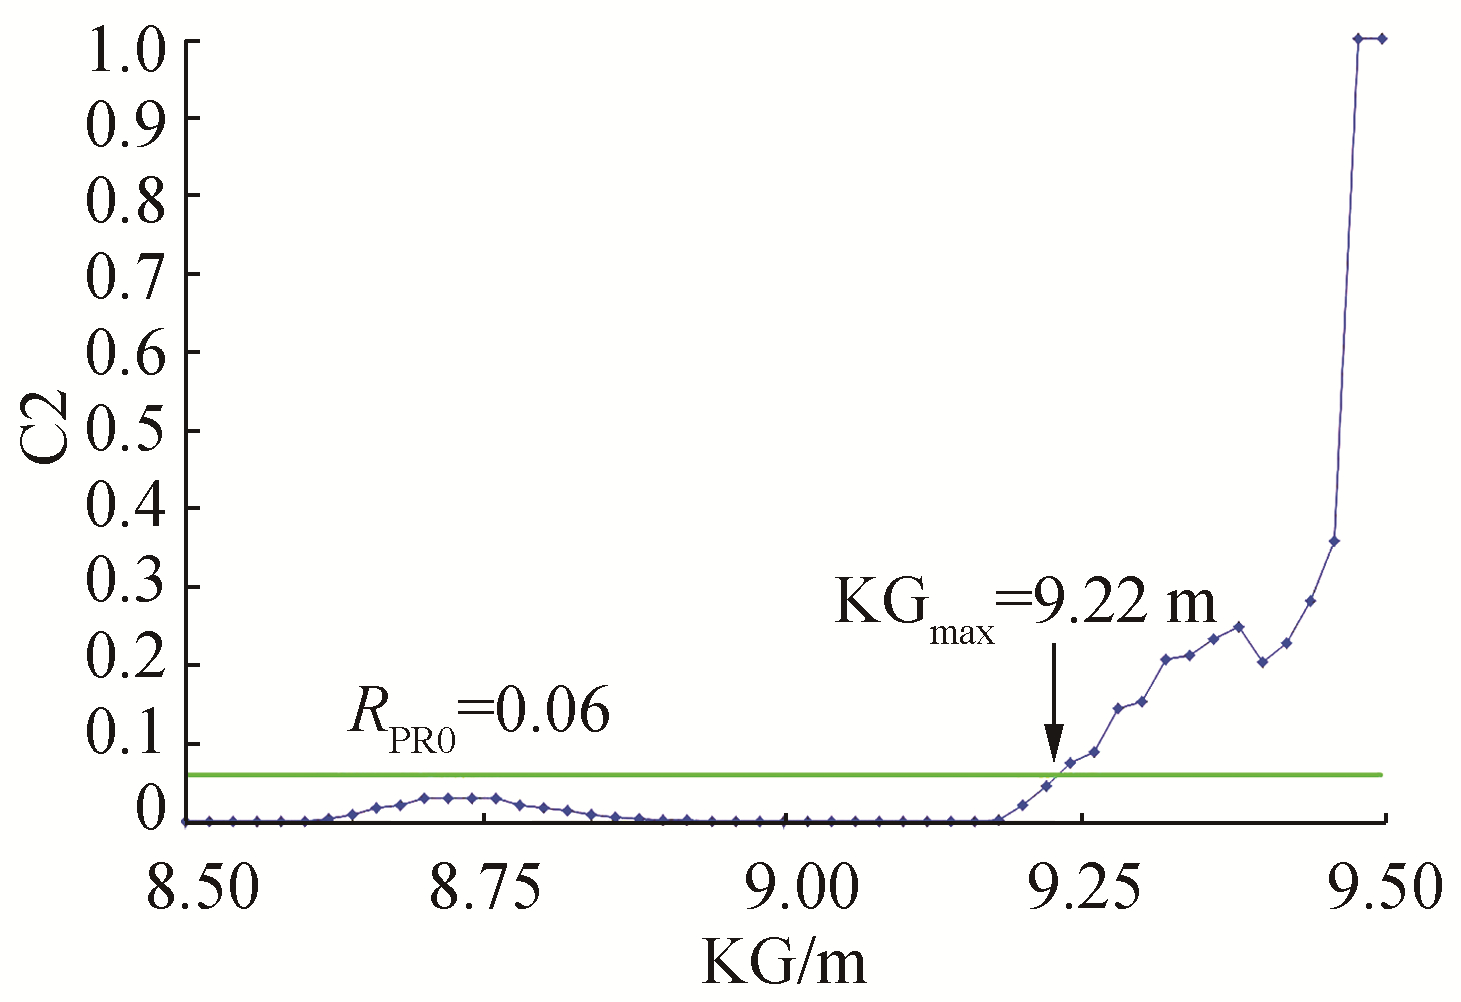
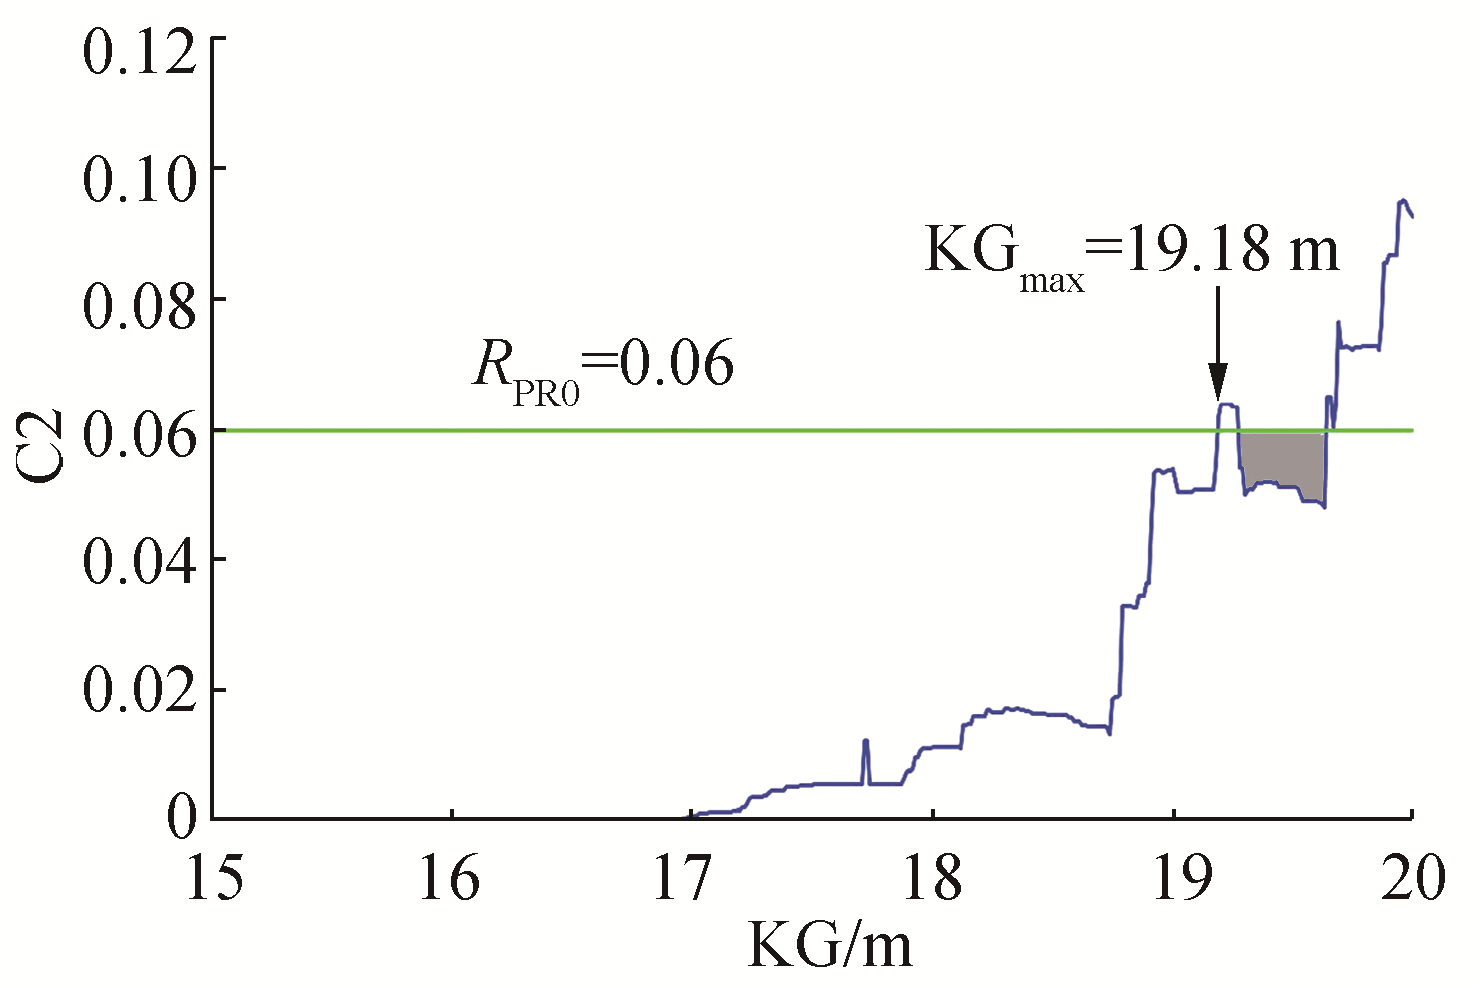
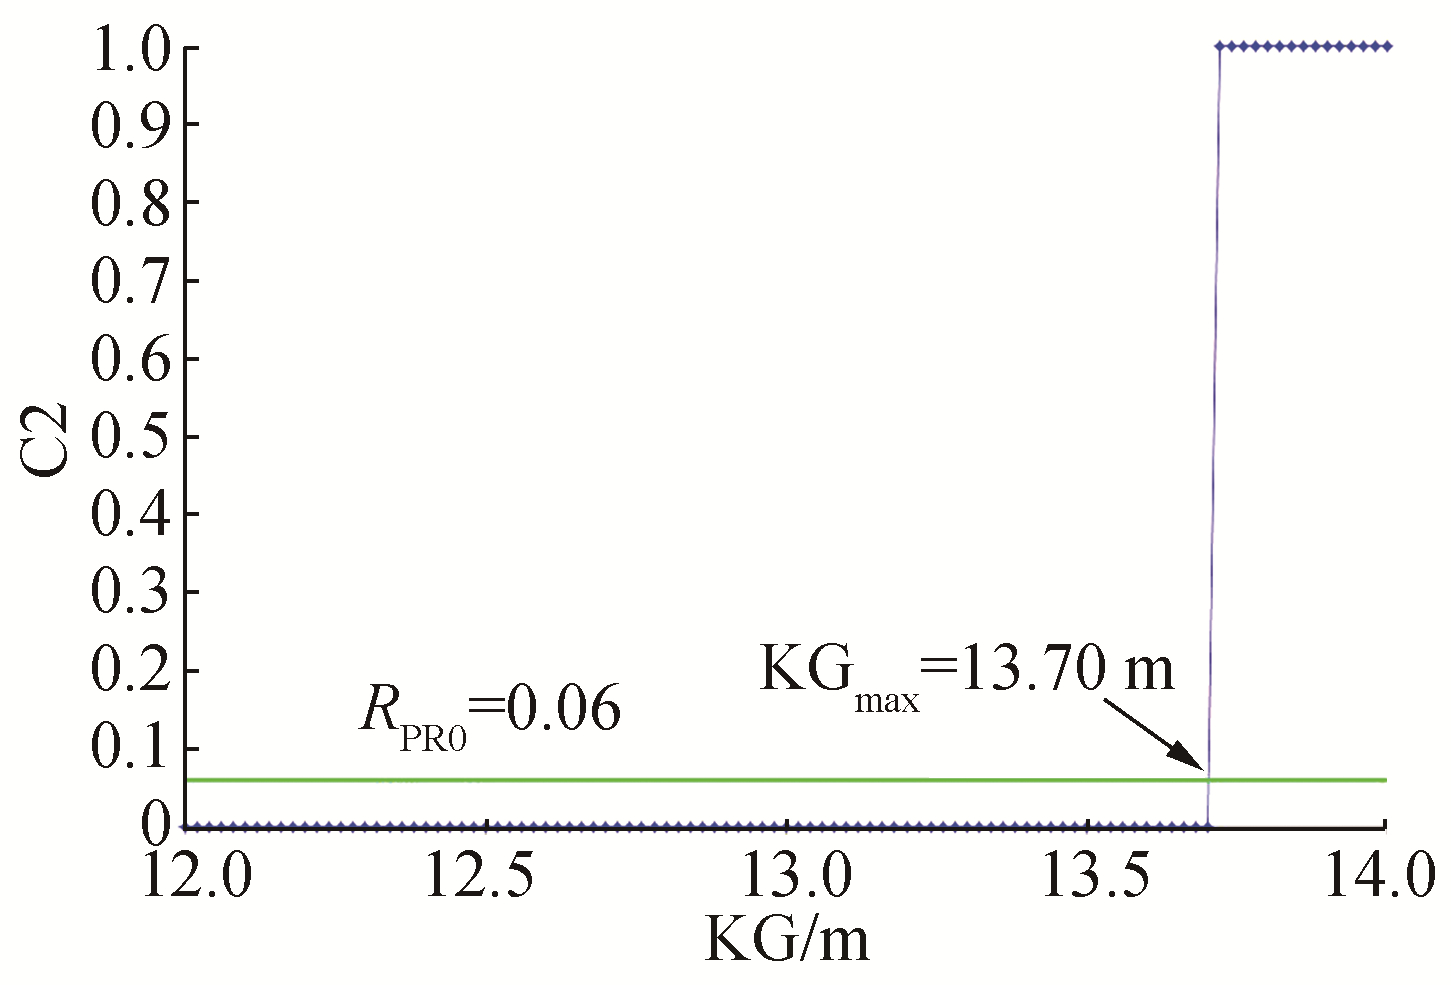
4.4 Focus on C2 criterionFor any ship at any draft, the KGmax linked to the C2 criterion is defined as the highest value of KG for which the value of C2 is lower than RPR0=0.06. Thus, it is interesting to check the C2-versus-KG curve. These curves are shown in Fig. 14 to Fig. 18. For the three non-vulnerable ships (naval, Ro-Ro, tanker), we made the computations assuming a full load draft for an interval containing KGmax with a step of 2 centimeters. For both container ships, we made the computations assuming a larger interval of KG with a step of 1 centimeter, at a draft of 9 m (C11 container ship, Fig. 15) and 12 m (319 m container ship, Fig. 16).
|
| Figure 14 Curve C2 versus KG for the naval ship (d=6.125 m) |
|
| Figure 15 Curve C2 versus KG for the C11 container ship (d=9.00 m) |

|
| Figure 16 Curve C2 versus KG for the 319m container ship (d=12.00 m) |

|
| Figure 17 Curve C2 versus KG for the Ro-Ro vessel (d=5.50 m) |
|
| Figure 18 Curve C2 versus KG for the tanker (d=11.00 m) |
Fig. 18 shows the curve of the tanker, for which C2 is equal to 0 for all values of KG lower than KGmax (13.70 m) and is equal to 1 for all higher values. This shows that a parametric roll never occurs on this ship. The value of C2 is forced to 1 when the average value of GM on waves becomes negative (see subsection 4.2.3).
Fig. 14 shows the curve for the naval ship, where we observe a small interval of KG (centered approximatively at 8.70 m) in which the C2 coefficient is not null. This shows that a parametric roll occurs for some lightly weighted waves that correspond with the ship’s natural roll period. For higher values of KG, C2 reduces to near zero and then rapidly increases to 1. While parametric roll occurs in these KG conditions, the average value of GM is near zero: the ship becomes statically unstable on waves.
Fig. 17 shows the C2-versus-KG curve for the Ro-Ro vessel, from which we observe that the increasing part of the curve is longer than both the tanker and naval ship. We also observe that two values of KG larger than KGmax (12.57 m) give values of C2 that are lower than RPR0 (KG=12.60 and 12.62 m, marked with * on Fig. 17).
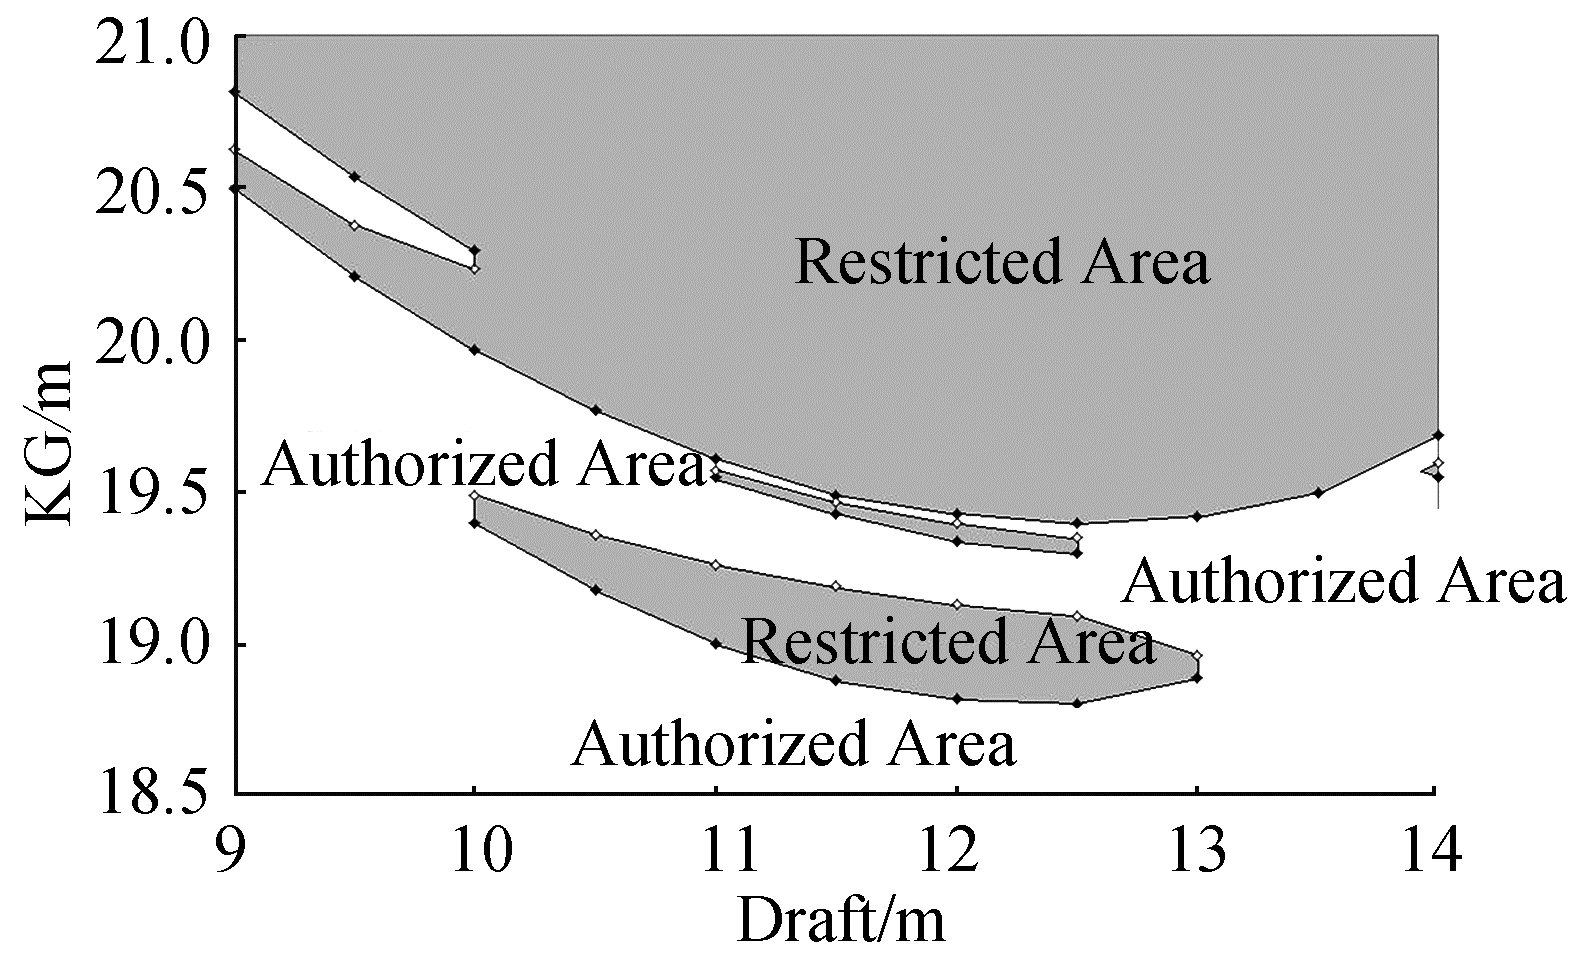
Fig. 15 and Fig. 16 show the same curves, respectively, for the C11 and 319 m container ships. On both, we observe many peaks and relatively large intervals of KG larger than KGmax, for which the value of C2 is lower than RPR0, thus fulfilling the associated criterion. These intervals are colored in gray on the corresponding figures. This non-monotonically increasing configuration of the C2 curve makes the starting value of KG (KGstart in this paper, 15 m for both container ships) very important in the search for KGmax. The value of the increment used in this search (10 centimeters in this study) is also very important. Both parameters must be chosen such that they avoid overlooking a small zone of KG for which C2 is larger than RPR0. The computation of the C2-versus-KG curves for all drafts makes it possible to define authorized and restricted areas according to the C2 criterion. Fig. 19 and Fig. 20 show these zones for both container ships (authorized areas in white, restricted areas in gray). The lower envelopes of the restricted areas give the KGmax curves linked to C2 that are shown in Fig. 10 and Fig. 11. The jumps observed on these curves correspond to the passage from the upper to the lower restricted area (at drafts equal to 10 and 13 m for the 319m container ship).

|
| Figure 19 Authorized and restricted areas according to the C2 criterion for the C11 container ship |
|
| Figure 20 Authorized and restricted areas according to the C2 criterion for the 319 m container ship |
In this study, we computed the KGmax curves associated with the level-1 and level-2 criteria of pure loss of stability and parametric roll failure modes for five ships of different types. The results reveal that level-2 criteria can be more conservative than the second level-1 method for both failure modes. This configuration is not anticipated in the future regulation. The results also show that the discrepancy between the level-1 methods can be very large, especially for the pure loss of stability failure mode. We argue that the safety margins ensured by the first level-1 method (parallel water-plane) seem to be excessive and may conflict with the future excessive acceleration criteria. Thus, if equipped to make hydrostatic computations on waves, naval architects and shipyards should not use the first level-1 method. However, this method could have real added value if it ensures an acceptable safety margin for small vessels, which are likely to be designed by architects of modest means.
The computation results of the second check of the parametric roll level-2 criterion (C2) for all possible values of KG shows that the more vulnerable the ship is to this failure mode, the more her C2-versus-KG curve is characterized by peaks and a long interval of C2 going from 0 to 1. This makes the surface formed by both the draft and KG foliated with both authorized and restricted zones. Consequently, it is not sufficient to check that C2 is lower than RPR0 for a given ship’s loading condition. It is necessary to check this condition for all lower values of KG. We recommend that the future regulation clearly specify the requirement for this additional check.
The KGmax curves associated with the parametric roll criteria confirm the well-known vulnerability of the C11 container ship to this failure mode.
Acknowledgements:The authors would like to acknowledge Clève Wandji (Bureau Veritas), Philippe Corrignan (Bureau Veritas), and Jean-François Leguen (DGA/TH) for their valuable discussions during the preparation of this paper.
| Bassler C, Belenky V, Bulian G, Francescutto A, Spyrou K, Umeda N, 2009. A review of available methods for application to second level vulnerability criteria. 10th International Conference on Stability of Ships and Ocean Vehicles, St Petersburg, 111–128. |
| Belenky V, Bassler C, Spyrou K, 2011. Development of second generation intact stability criteria. US Navy, Naval Surface Warfare Center Carderock Division, NSWCCD-50-TR-2011/065. |
| Bulian G, Francescutto A, 2011. Considerations on parametric roll and dead ship conditions for the development of second generation intact stability criteria, 12th International Ship Stability Workshop, Washington, 7-18. |
| Direction Générale de l'Armement, Instruction générale n 6018 A. (1999). Stabilité des batiments de surface de la marine nationale. (restricted diffusion, in French) |
| France WN, Levadou M, Treakle TW, Paulling JR, Michel RK, Moore C, 2001. An investigation of head-sea parametric rolling and its influence on container lashing systems. SNAME Annual Meeting. |
| Francescutto A, Umeda N, 2010. Current status of new generation intact stability criteria development. 11th International Ship Stability Workshop, Wageningen, 1-5. |
| Garme K, 1997. Model seakeeping experiments presented in the time-domain to facilitate validation of computational tool. Kungl Tekniska Högskolan, Stockolm. |
| Grim O, 1961. Beitrag zu dem problem der Sicherheit des Schiffes im seegang. Schiff und Hafen, Heft 6, S. 490-497. |
| Grinnaert F, Billard JY, Laurens JM, 2015. Calcoque: a fully 3D ship hydrostatic solver. 12th International Conference on the Stability of Ships and Ocean Vehicles, Glasgow. |
| Grinnaert F, Laurens JM, 2013. Stabilité du navire-Théorie, réglementation, méthodes de calcul-Cours et exercices corrigés. Ellipses, collection Technosup. (in French) |
| International Association of Classification Societies, 2001. Rec. No. 34. Standard Wave Data, Rev.1. |
| Ikeda Y, Himeno Y, Tanaka N, 1978. Components of roll damping of ship at forward speed. Department of Naval Architecture University of Osaka Prefecture, Report No 404. |
| International Maritime Organization, 2012. SLF ISCG 54/19. Proposal of revision of updated draft vulnerability criteria of levels 1 and 2 for the failure modes of pure loss of stability and parametric roll. Submitted by Japan 29 May 2012. |
| International Maritime Organization, 2013. SDC 1/INF.8. Information collected by the Correspondence Group on Intact Stability regarding the second generation intact stability criteria development. Submitted by Japan 13 November 2013. |
| International Maritime Organization, 2015. SDC 2/WP.4, 2nd session. Development of Second Generation Intact Stability Criteria, Development of Amendments to Part B of the 2008 IS Code on Towing and Anchor Handling Operations. |
| International Maritime Organization, 2016. SDC 3/WP.5, 3rd session. Finalization of Second Generation Intact Stability Criteria, Amendments to Part B of the 2008 IS Code on Towing, Lifting and Anchor Handling Operations. |
| International Maritime Organization, 2009. International code of intact stability, 2008. London. |
| Kaufmann J, 2009. Fatal Accident on Board the CMV Chicago Express During Typhoon "Hugupit" on September 24 2008 off the Coast of Hong Kong. Bundesstelle für Seeunfalluntersuchung. Investigation Report 510/08. |
| Kawahara Y, Maekawa K, Ikeda Y, 2009. A simple prediction formula of roll damping of conventional cargo ships on the basis of Ikeda's method and its limitation. 10th International Conference on Stability of Ships and Ocean Vehicles, St Petersburg. |
| Krueger S, Hatecke H, Billerbeck H, Bruns A, Kluwe F, 2013. Investigation of the 2nd generation of intact stability criteria for ships vulnerable to parametric rolling in following seas. 32nd International Conference on Ocean, Offshore and Arctic Engineering OMAE2013, Nantes. |
| Krueger S, Hatecke H, Gualeni P, Di Donato L, 2015. On the application of the 2nd generation intact stability criteria to Ro-Pax and container vessels. 12th International Conference on the Stability of Ships and Ocean Vehicles, Glasgow. |
| Moelgaard A, 2000. PMM-tests with a model of a frigate class DDG-51. Danish Maritime Institute 2000071, Report No. 1. |
| Peters W, Belenky V, Chouliaras S, Spyrou K, 2015. Requirements for computational methods to be used for the IMO second generation intact stability criteria. 12th International Conference on the Stability of Ships and Ocean Vehicles, Glasgow. |
| Umeda N, 2013. Current status of second generation intact stability criteria development and some recent efforts. 13th International Ship Stability Workshop, Brest, 138–157. |
| Wandji C, Corrignan P, 2012. Test application of second generation IMO intact stability criteria on a large sample of ships. 11th International Conference on the Stability of Ships and Ocean Vehicles, Athens, 129–139. |


