2.Department of Ocean Engineering, Ocean University of China, Qingdao 266100, China
Steel-jacket-type platforms are widely used in offshore oil and gas exploitation. Because of a harsh work environment,offshore structures continually accumulate damage during their service lives. Damage detection techniques are crucial for maintaining structural safety. Over the past decades,vibration-based damage detection techniques have attracted considerable attention,and a significant number of studies have been conducted(Nichols,2003; Alvandi and Cremona,2006; Mojtahedi et al.,2011; Hillis and Courtney,2011; Wang,2013). The basic idea of these studies is that the accumulated damage may change the rigidity patterns of the structure and consequently change its dynamic characteristics such as modal frequencies and mode shapes(Li et al.,2008; Titurus et al.,2003). Such changes in modal properties may be used for damage detection. A range of damage detection methods based on modal parameters has been developed(Doebling et al.,1998; Farrar et al.,2001; Alvandi and Cremona,2006). However,most of them have practical limitations. For example,some methods require spatially complete mode shapes,some require measured input forces,and some model-updating-based methods require an accurate baseline model(Simoen et al.,2015). It is difficult to satisfy these conditions in the maintenance of real offshore structures.
Modal-strain-energy-based methods have shown promise for locating damage(Wang et al. 2010,2014; Seyedpoor,2012; Wang and Li,2012; Yan et al.,2010,2012; Entezami and Shariatmadar,2014). The Stubbs damage index method(Stubbs et al.,1995; Kim and Stubbs,2002),which is based on the decrease in modal strain energy,is one of the more stable and reliable approaches. Only the mode shapes of damaged and undamaged structures are required,and spatially incomplete mode shapes do not need to be expanded. More specifically,this method has relatively lower dependence on the baseline Finite Element(FE)model because any error in this model has a negligible effect on damage detection,and model updating is not essential. This technique has been successfully applied to damage detection of a bridge(Stubbs et al.,1995). However,while it has numerous advantages over other methods,recent research has shown that its application to three-dimensional frame-type structures is limited(Li et al.,2006; Wang et al.,2014),especially when the measured mode shape data suffer from high levels of noise.
This study aims to improve the effectiveness of the Stubbs damage index method for offshore platforms by introducing a more robust indicator in which frequency information is added to the traditional Stubbs index. The approach takes advantage of the fact that modal frequencies can be obtained from any individual time response recorded anywhere on a platform(Wang,2013). By applying certain order determination methods,modal frequencies can be identified much more precisely than mode shapes.
2 Preliminaries: the traditional modal strain energy method(the Stubbs index method)The Stubbs index method is a traditional modal strain energy method developed by Stubbs et al.(1995).
For a linear,undamaged structure with ne elements and n nodes,the ith modal stiffness(modal strain energy)is given by
| $${S_i} = {\bf{\Phi }}_i^{\mathop{\rm T}\nolimits} {\bf{K}}{{\bf{\Phi }}_i}$$ | (1) |
where ${{\bf{\Phi }}_i}$ is the ith mode shape and K is the global system stiffness matrix. The contribution of the jth member to the ith modal stiffness Sij is given by
| $${S_{ij}} = {\bf{\Phi }}_i^{\mathop{\rm T}\nolimits} {{\bf{K}}_j}{{\bf{\Phi }}_i}$$ | (2) |
where Kj is the contribution of the jth member to the system stiffness matrix. The fraction of the ith modal energy(i.e. the modal sensitivity)that is concentrated in the jth member is defined as
| $${F_{ij}} = {S_{ij}}/{S_i}$$ | (3) |
For a damaged structure,the contribution of the jth member to the ith mode can also be written as
| $$F_{ij}^* = S_{ij}^*/S_i^*$$ | (4) |
in which the quantities Sij* and Si* are given by
| $$S_{ij}^* = {\bf{\Phi }}_i^{*{\mathop{\rm T}\nolimits} }{\bf{K}}_j^*{\bf{\Phi }}_i^*$$ | (5) |
| $$S_i^* = {\bf{\Phi }}_i^{*{\mathop{\rm T}\nolimits} }{{\bf{K}}^{\rm{*}}}{\bf{\Phi }}_i^*$$ | (6) |
Using the FEM,the quantities Kj and Kj* can be expressed in a standard form
| $$\begin{array}{l} {{\bf{K}}_j} = {E_j}{{\bf{K}}_{j0}}\\ {\bf{K}}_j^* = E_j^*{{\bf{K}}_{j0}} \end{array}$$ | (7) |
where the scalars Ej and Ej* are the material stiffness properties of the undamaged and damaged jth member,and the matrix Kj0 is associated only with the geometric quantities of the jth member.
Assuming that the modal sensitivity of the ith mode and the jth location is the same for both undamaged and damaged structures,the following relationship is obtained from Eqs.(3)and(4):
| $$1{\rm{ = }}\frac{{F_{ij}^ * }}{{{F_{ij}}}} = \frac{{F_{ij}^ * {\rm{ + }}1}}{{{F_{ij}} + 1}}{\rm{ = }}\frac{{\left( {S_{ij}^ * {\rm{ + }}S_i^ * } \right){S_i}}}{{({S_{ij}} + {S_i})S_i^ * }}$$ | (8) |
By substituting Eqs.(1),(2),(5),(6),and(7)into Eq.(8),a damage index βj for the jth member for m modes is obtained by
| $${\beta _j}{\rm{ = }}\frac{{{E_j}}}{{E_j^*}}{\rm{ = }}\frac{{\sum\limits_{i = 1}^m {({\bf{\Phi }}_i^{*{\mathop{\rm T}\nolimits} }{{\bf{K}}_{j0}}{\bf{\Phi }}_i^*{\rm{ + }}\sum\limits_{j = 1}^{ne} {{\bf{\Phi }}_i^{*{\mathop{\rm T}\nolimits} }{{\bf{K}}_{j0}}{\bf{\Phi }}_i^*} ){S_i}} }}{{\sum\limits_{i = 1}^m {({\bf{\Phi }}_i^{\mathop{\rm T}\nolimits} {{\bf{K}}_{j0}}{{\bf{\Phi }}_i}{\rm{ + }}\sum\limits_{j = 1}^{ne} {{\bf{\Phi }}_i^{\mathop{\rm T}\nolimits} {{\bf{K}}_{j0}}{{\bf{\Phi }}_i}} )S_i^*} }}$$ | (9) |
Damage is indicated at the jth member if βj>1 and at the same time βj is a local peak value.
3 Improved modal strain energy methodFrom the above derivation,it can be seen that the Stubbs index uses only mode shapes,and not modal frequencies. However,it is well known that modal frequencies can be identified much more precisely than mode shapes. In this research,we attempted to improve the Stubbs method by introducing frequency information into the damage index.
The Eigen analysis for undamaged and damaged structures can be written as
| $${\bf{K}}{{\bf{\Phi }}_i}{\rm{ = }}\omega _i^2{\bf{M}}{{\bf{\Phi }}_i}$$ | (10) |
| $${{\bf{K}}^*}{\bf{\Phi }}_i^*{\rm{ = }}\omega _i^{*2}{{\bf{M}}^*}{\bf{\Phi }}_i^*$$ | (11) |
where M and M* are the global system mass matrices for undamaged and damaged structures,and ${\omega _i}$ and $\omega _i^*$ denote the ith modal frequency for the undamaged and damaged structures,respectively.
Generally,local damage will cause loss of structural stiffness,rather than of mass. Therefore,the structural mass before and after damage should be the same,so that M=M*. Multiplying Eq.(10)by ${\bf{\Phi }}_i^{\mathop{\rm T}\nolimits} $ and Eq.(11)by ${\bf{\Phi }}_i^{{\rm{*}}{\mathop{\rm T}\nolimits} }$ gives
| $${S_i} = {\bf{\Phi }}_i^{\mathop{\rm T}\nolimits} {\bf{K}}{{\bf{\Phi }}_i}{\rm{ = }}\omega _i^2{\bf{\Phi }}_i^{\mathop{\rm T}\nolimits} {\bf{M}}{{\bf{\Phi }}_i}$$ | (12) |
| $$S_i^* = {\bf{\Phi }}_i^{*{\mathop{\rm T}\nolimits} }{{\bf{K}}^{\rm{*}}}{\bf{\Phi }}_i^*{\rm{ = }}\omega _i^{*2}{\bf{\Phi }}_i^{*{\mathop{\rm T}\nolimits} }{\bf{M\Phi }}_i^*$$ | (13) |
If the material is uniform,then all the members of the undamaged structure will have the same stiffness property Ej=E,for $j = 1,{\rm{ }}2,{\rm{ }}3, \cdots ,{\rm{ }}{n_e}$. Multiplying the numerator and denominator of Eq.(9)by E yields
| $${\beta _j}{\rm{ = }}\frac{{\sum\limits_{i = 1}^m {({\bf{\Phi }}_i^{*{\mathop{\rm T}\nolimits} }{{\bf{K}}_j}{\bf{\Phi }}_i^*{\rm{ + }}{\bf{\Phi }}_i^{*{\mathop{\rm T}\nolimits} }{\bf{K\Phi }}_i^*){S_i}} }}{{\sum\limits_{i = 1}^m {({\bf{\Phi }}_i^{\mathop{\rm T}\nolimits} {{\bf{K}}_j}{{\bf{\Phi }}_i}{\rm{ + }}{\bf{\Phi }}_i^{\mathop{\rm T}\nolimits} {{\bf{K}}_j}{{\bf{\Phi }}_i})S_i^*} }}$$ | (14) |
When only local damage occurs,an approximate relationship $S_i^* = {\bf{\Phi }}_i^{*{\mathop{\rm T}\nolimits} }{{\bf{K}}^{\rm{*}}}{\bf{\Phi }}_i^* \approx {\bf{\Phi }}_i^{*{\mathop{\rm T}\nolimits} }{\bf{K\Phi }}_i^*$ exists. The Stubbs damage index can then be approximately written as
| $${\beta _j}{\rm{ = }}\frac{{\sum\limits_{i = 1}^m {({\bf{\Phi }}_i^{*{\mathop{\rm T}\nolimits} }{{\bf{K}}_j}{\bf{\Phi }}_i^*{\rm{ + }}S_i^*){S_i}} }}{{\sum\limits_{i = 1}^m {({\bf{\Phi }}_i^{\mathop{\rm T}\nolimits} {{\bf{K}}_j}{{\bf{\Phi }}_i}{\rm{ + }}{S_i})S_i^*} }}$$ | (15) |
Substituting Eqs.(12)and(13)into Eq.(15)gives
| $${\beta _j}{\rm{ = }}\frac{{\sum\limits_{i = 1}^m {({\bf{\Phi }}_i^{*{\mathop{\rm T}\nolimits} }{{\bf{K}}_j}{\bf{\Phi }}_i^*{\rm{ + }}\omega _i^{*2}{\bf{\Phi }}_i^{*{\mathop{\rm T}\nolimits} }{\bf{M\Phi }}_i^*)\omega _i^2{\bf{\Phi }}_i^{\mathop{\rm T}\nolimits} {\bf{M}}{{\bf{\Phi }}_i}} }}{{\sum\limits_{i = 1}^m {({\bf{\Phi }}_i^{\mathop{\rm T}\nolimits} {{\bf{K}}_j}{{\bf{\Phi }}_i}{\rm{ + }}\omega _i^2{\bf{\Phi }}_i^{\mathop{\rm T}\nolimits} {\bf{M}}{{\bf{\Phi }}_i})\omega _i^{*2}{\bf{\Phi }}_i^{*{\mathop{\rm T}\nolimits} }{\bf{M\Phi }}_i^*} }}$$ | (16) |
Following Wang et al.(2014),normalization allows a more robust damage indicator to be defined:
| $${{Z}_{j}}=({{\beta }_{j}}-\bar{\beta })/{{\sigma }_{\beta }}$$ | (17) |
where $\bar \beta $ and ${\sigma _\beta }$ are the mean and the standard deviation of a collection of βj values.
4 Numerical studyIn this research,our proposed Improved Modal Strain Energy(IMSE)method was verified experimentally using a jacket-type offshore platform. Numerical simulations were first conducted.
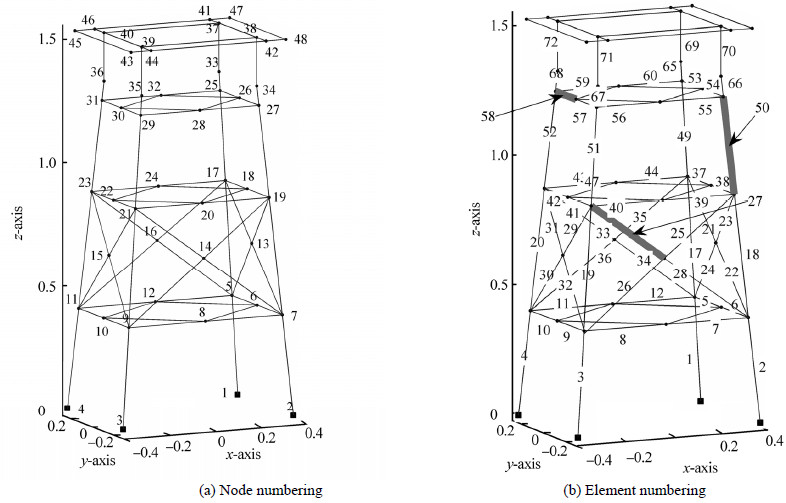
4.1 Description of the structureThe numerical study was used to verify the IMSE. The study object was an FE model of the physical structure to be experimentally tested. As shown in Fig. 1,this comprises 72 three-dimensional uniform beam elements and 5 four-node plate elements(for the deck). The geometrical dimensions and physical parameters are described further in Section 5.1.
|
| Fig. 1 Sketch of the offshore platform structure |
Modal analysis was carried out in MATLAB. The first three modal frequencies were 10.903 Hz,11.031 Hz,and 14.784 Hz,respectively. The first three mode shapes are shown in Fig. 2. The vibration in the first mode was mainly in the x-direction and that of the second mode was in the y-direction; the third mode was a torsion mode.

|
| Fig. 2 The first three modal shapes of the undamaged structure |
As shown in Table 1,three scenarios investigated damage to a leg,a horizontal brace,and a diagonal brace. In each case,structural damage was simulated by reducing the Young’s modulus appropriately. For example,a damage severity of 30% means that the elastic modulus of the member was reduced by 30%. The modal parameters of the damaged structure were obtained by iterating the modal analysis. Since only limited lower-order modes can be measured in practice,it was assumed that only the first three modes were available for study. The modal frequencies of the undamaged and the damaged structures are given in Table 1.
| Damage scenarios | Damage member | Damage severity/% | Modal frequency/Hz | ||
| 1st mode | 2nd mode | 3rd mode | |||
| Undamaged model | — | — | 10.903 | 11.031 | 14.784 |
| Damage scenario 1 | Leg 50 | 30 | 10.809 | 10.934 | 14.630 |
| Damage scenario 2 | Horizontal brace 58 | 30 | 10.898 | 10.979 | 14.743 |
| Damage scenario 3 | Diagonal brace 27 | 30 | 10.896 | 11.030 | 14.776 |
The other challenges that arise in practice are that the measured modal parameters are usually spatially incomplete and noise-polluted. Therefore,three cases were analyzed for each damage scenario: Case A,in which spatially complete and noise-free mode shapes were available,Case B in which spatially complete but noise-polluted mode shapes were used,and Case C in which spatially incomplete and noise-polluted mode shapes were used. Case A was used to verify the correctness of the IMSE index,Case B to investigate the robustness of the novel method against noise,and Case C to simulate real conditions,to verify the practicability of the IMSE method.
4.3 Damage detectionCase A: Damage scenarios with spatially-complete and noise-free mode shapes
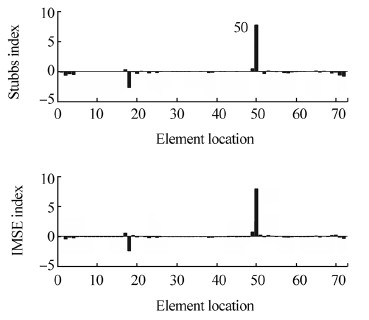
In Scenario 1,damage was suffered by a leg at element 50,resulting in a 30% stiffness loss. This produced a reduction in all the three modal frequencies listed in Table 1. These three measured modes were therefore employed in the calculation,and the resulting damage indicators are shown in Fig. 3. The bottom panel shows the damage index from the IMSE method for each element. The model correctly located the damage and produced index values exactly the same as those from the Stubbs index values(shown in the top panel of Fig. 3). This is because when there is no noise error in the modal shapes,Eq.(13)and Eq.(14)are satisfied completely,and the IMSE index and the Stubbs index are theoretically identical.
|
| Fig. 3 The damage indexes for damage Scenario 1 in case A |
In Scenario 2,a horizontal brace was damaged at element 58,resulting in a 30% stiffness reduction. As shown in Table 1,only the second modal frequency was changed in this scenario,and only the second mode was utilized. Fig. 4 shows the results. The damage was correctly located at element 58 by both the IMSE method and the Stubbs index method.

|
| Fig. 4 The damage indexes for damage Scenario 2 in case A |
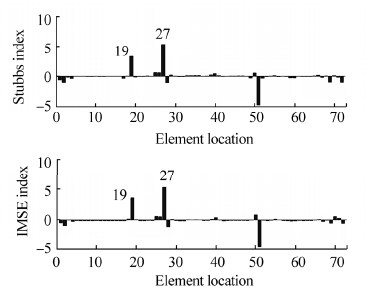
In Scenario 3,damage to diagonal brace 27 had only a small influence on the modal frequencies of the structure(see Table 1),suggesting that the sensitivity of the dynamic characteristics of the structure was lower to damage to the diagonal braces than to damage to the legs or horizontal braces. A 30% stiffness loss caused only a 0.064% reduction in the first modal frequency and an even smaller reduction in the other two modes. In this case,therefore,only the first mode was used to calculate the damage indicators. The results are given in Fig. 5. It can be seen that both the Stubbs index and the IMSE index were able to correctly locate the damage at element 27.
|
| Fig. 5 The damage indexes for damage Scenario 3 in case A |
However,it can be observed that these two methods also produced lower peaks at elements 71 and 72 in Scenario 2,and at element 19 in Scenario 3. Fig. 1 shows that elements 71 and 72 were the two leg members adjacent to the damaged brace 58,and element 19 was a leg member directly connected to the damaged brace 27. We therefore consider these to be subsidiary indicators rather than false locations,which could be used to confirm the location of damage to low-sensitivity members.
The results for Case A showed that the IMSE method proposed in Section 3 was effective for damage location when only lower-order modes were damaged. Since noise error was not introduced,the IMSE index produced exactly the same results as the Stubbs index,which validated the rationale behind the formulas presented in Section 3.
Case B: Damage scenarios with spatially-complete but noise-polluted mode shapes
In practice,measurement noise is unavoidable,so the mode shape data is always noisy to a greater or lesser extent,and robustness against noise is an important aspect of any damage assessment method. In Case B,we tested the proposed IMSE method when the measured modes were spatially complete but noise-polluted. The noisy measurement of an ith mode shape of a damaged structure at the jth DoF,denoted by ${\bf{\hat \Phi }}_{ij}^*$,was simulated by adding a Gaussian random error to the true value ${\bf{\Phi }}_{ij}^*$:
| $${\bf{\hat \Phi }}_{ij}^*{\rm{ = }}{\bf{\Phi }}_{ij}^*(1 + \sigma {\varepsilon _{ij}})$$ | (18) |
where $\sigma $ denotes the noise level and ${\varepsilon _{ij}}$ is a Gaussian random number with a zero mean and unit standard deviation.
As in Case A,only modes sensitive to damage were used. Of the first three modes used in Scenario 1,only the second mode was used in Scenario 2,and only the first mode in Scenario 3. Figs. 6-8 show the damage detection at different error levels for the three damage scenarios.
Fig. 6(a) shows that when the noise level was less than 0.1%,both the IMSE index and Stubbs index accurately identified the leg damage. However,when the noise level reached 0.2% the Stubbs index became inaccurate. In contrast,the novel IMSE method continued to perform well at noise levels up to 1%. As the noise level increased,however,subsidiary indicators appeared which masked the true location,as shown in Fig. 6(d).

|
| Fig. 6 The damage indexes for Scenario 1 in Case B using the first three noise-polluted modal shapes |
Similar results were obtained for Scenario 2 and Scenario 3. These comparisons demonstrated that the novel IMSE method was more noise robust than the traditional Stubbs index method.

|
| Fig. 7 The damage indexes for Scenario 2 in Case B using the second noise-polluted modal shape |

|
| Fig. 8 The damage indexes for Scenario 3 in Case B using the first noise-polluted modal shape |
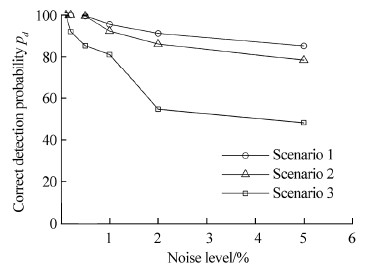
To investigate the robustness of the IMSE method,further numerical simulations were conducted at noise levels from 0.1% to 5%. To gain a statistical understanding of the detection results,1000 Monte Carlo simulation runs were conducted at each noise level. The correct detection probability(pd)was calculated to investigate the effect of noise on damage detection(Wang,2013),as follows:
| $${p_d} = \frac{{{n_d}}}{{{n_s}}} \times 100{\rm{\% }}$$ | (19) |
The effect of increasing the level of noise from 0.1% to 5% on the correct detection probability is illustrated in Fig. 9. In Scenario 1,when the noise level $\sigma \le 0.5{\rm{\% }}$,a 100% detection probability was achieved. As the noise level increased,the detection probability decreased slightly. For example,the detection probability was 95.6% at a 1% noise level,91.2% at a 2% noise level and 85.3% at a 5% noise level. The results for Scenario 2 were similar,but those for Scenario 3 showed different behavior,in which the correct detection probability decreased more rapidly than in Scenarios 1 and 2. At very low noise levels(0.1% for example),perfect damage detection could still be achieved,but when the noise level increased to 2%,the pd fell to 54.7%.
|
| Fig. 9 Damage detection probabilities for Case B |
From Fig. 9 it can be observed that a damaged leg member or horizontal brace member were more easily detected using the IMSE index,which is less influenced by noise. However,a damaged diagonal brace was more prone to influence by measurement error. This might reflect the smaller change in dynamic characteristics when a diagonal brace suffers 30% damage,compared with the same level of damage to a leg member or horizontal brace member. This is illustrated in Table 1.
Case C: Damage scenarios with spatially-incomplete and noise-polluted mode shapes
In practice,it is rarely possible to measure the mode shapes at all DoFs of the structure. We therefore investigated cases with spatially-incomplete mode shapes,assuming that only the translational DoFs in the x,y,and z directions at 20 selected nodal points(as shown in Fig. 10)could be measured. Spatially incomplete mode shapes with only 60 DoFs were used,with a noise level of 0.1%.

|
| Fig. 10 Sensor placement for Case C in numerical studies(Red dots indicate tri-axial accelerators) |
The damage indicators produced by the novel IMSE method and the Stubbs index method are shown in Figs. 11-13 for damage Scenarios 1,2,and 3,respectively.
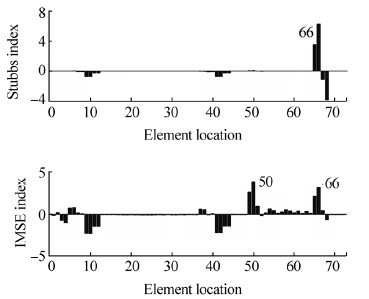
In Scenario 1,the IMSE index gave a correct damage location at leg element 50 with a subsidiary indicator at element 66(Fig. 11). As element 66 was a short leg member directly connected to element 50,identification of a subsidiary indicator peak at this member is to be expected. However,the Stubbs indexes showed only one peak indicator at element 66,which is a false location.
|
| Fig. 11 The damage indexes for damage scenario 1 in Case C using spatially incomplete and noise-polluted mode shapes |
The resulting damage indicators for Scenario 2 are shown in Fig. 12. It can be seen that the Stubbs index gave a false location at element 67. In contrast,the proposed IMSE method proved more robust,correctly locating the damage at element 58. Subsidiary indicator peaks also appeared in this Scenario,located at elements 51,52,67,and 68. Fig. 1 shows that these four elements are leg members near to horizontal brace 58 and on the same side of the structure,and therefore reconfirmed the damage location at element 58.

|
| Fig. 12 The damage indexes for damage scenario 2 in case C using spatially incomplete and noise-polluted mode shapes |
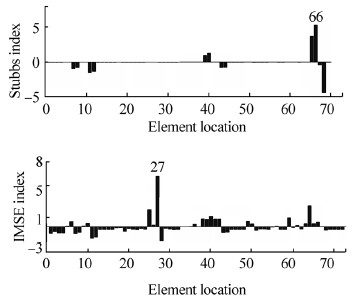
Similar results were obtained in Scenario 3,in which only the first mode shape was used,as shown in Fig. 13. The IMSE method accurately identified the damage location at element 27,whereas the Stubbs index again gave a false location.
|
| Fig. 13 The damage indexes for damage Scenario 3 in Case C using spatially incomplete and noise-polluted mode shapes |
These numerical results confirmed that the novel IMSE method yielded more accurate results for the simulated offshore jacket platform structure when only lower-order spatially incomplete and noise-polluted mode shapes were used.
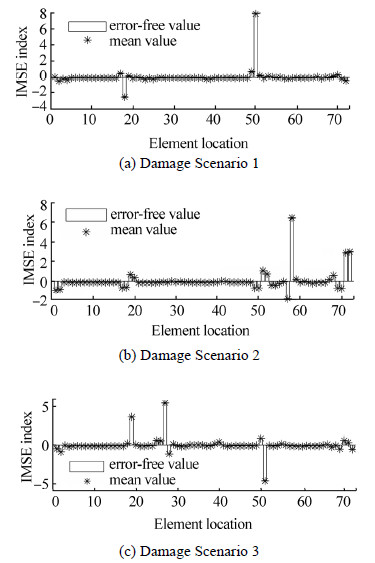
The most significant difference between the IMSE index and the Stubbs index was the application of modal frequencies. The studies referenced above all ignored measurement errors of modal frequencies,as is standard practice. The main reason for wanting to include modal frequencies is that they can be identified much more precisely than mode shapes when using certain order determination methods(Wang,2013). In order to verify the correctness of this approach,errors ranging from 0.1% to 5% were analyzed,alongside the modal frequencies. Assuming that the modal frequencies of structures before and after damage have the same error level,the three damage scenarios were investigated using IMSE method. To statistically verify the detection results,1000 Monte Carlo simulation runs were conducted at each noise level. Fig. 14 shows the mean index values from the 1000 simulations,where each simulation used a 1% error level. Compared with the error-free index values,the damage detection results were almost unaffected by the introduction of measurement errors in the modal frequencies. Similar results were obtained at other error levels. If the modal frequencies of structures before and after damage have the same measurement accuracy,the effect of measurement errors on detection results can be ameliorated.
|
| Fig. 14 Damage detection results using IMSE index with 1000 Monte Carlo simulations with 1% error level in modal frequencies |
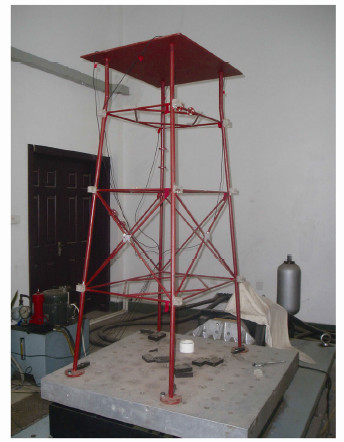
The jacket-type offshore platform model shown in Fig. 15 was used to study the accuracy of the proposed method. The model was a welded steel space frame braced with horizontal and diagonal members,and with four primary legs. All the members were welded from steel pipe and the deck was of steel plate. The four primary legs had a diameter of 20 mm and a wall thickness of 2 mm. All the other members had a diameter of 10 mm with a wall thickness of 2 mm. The dimensions of the deck were 0.7 m×0.545 m×0.01 m. The plane dimensions were 0.77 m×0.54 m(at seabed elevation),0.693 m×0.487 m(at the first floor),0.6 m×0.424 m(at the second floor),0.535 m×0.375 m(at the third floor),and 0.52m×0.365 m(above the working points). The Young’s modulus of all members was a constant of 2.1×10¹¹ Pa. The FE model of the structure is shown in Fig. 1 in Section 4.
|
| Fig. 15 Physical model under test |
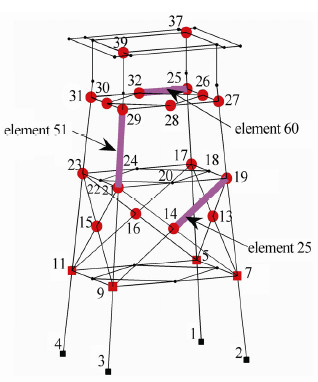
The platform model was fixed to the basin ground,equivalent to a fixed pile model with a depth of 0.406 m,and modal testing was excited by a hammer beating on the deck. The sensor placement is shown in Fig. 16. Totally 22 accelerometers were installed to monitor the vibration data in 62 DoFs. A dynamic data acquisition system(CRONOS PL 64-DCB8)was used to connect the sensors.
|
| Fig. 16 Damage presets and sensor placement. Red dots indicate tri-axial accelerators and red rectangular marks indicate two-axial accelerators |
Four test scenarios were explored in the experiment,including one with no damage and three with damage,as listed in Table 2. For simulation of damage,three flange replacement members were preset on a leg,a horizontal brace,and a diagonal brace,as shown in Figs. 16 and 17. Damage was simulated in two ways: by replacing the original flange member with a thinner member to simulate partial damage,or by removing all the four bolts from the flange,to simulate the member being comprehensively damaged.

|
| Fig. 17 Flange members replaced to simulate damage |
The Eigensystem Realization Algorithm applied with the Natural Excitation Technique(Wang et al.,2005; Wang and Liu,2010)was used for modal parameter identification. The first three modal frequencies of the undamaged and damaged structures are listed in Table 2.
5.3 Damage detectionIn the experimental study,the first three modes with only 62 measured DoFs for each mode shape were used to investigate damage localization.
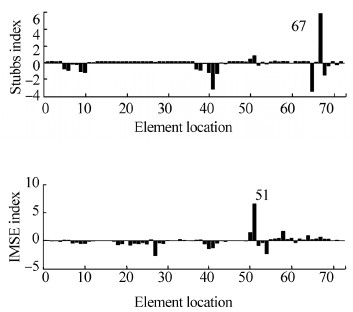
Damage Case 1: leg damaged at element 51
In Case 1,leg 51 was damaged by replacing the original member(Φ20×2)with a thinner flange member(Φ18×1.5). Table 2 clearly shows that the first three modal frequencies were all reduced,and the three modes were therefore used in the calculation. The resulting damage indexes are shown in Fig. 18,in which the bottom panel is the IMSE index. The IMSE index correctly located the damage,whereas the Stubbs index produced a false location at element 67.
|
| Fig. 18 Damage indexes for damage Case 1 |
Damage Case 2: a horizontal brace damaged at element 60
In the second case,a horizontal brace at element 60 was comprehensively damaged by removing all the four bolts in the flange. As shown in Table 2,this only affected the first mode. Fig. 19 shows the results of the damage indicators when only the first mode was used.

|
| Fig. 19 Damage indexes for damage Case 2 |
| Damage cases | Damage location | Modal frequency/Hz | ||
| 1st mode | 2nd mode | 3rd mode | ||
| Undamaged model | — | 10.903 | 11.032 | 14.783 |
| Damage Case 1 | Leg 51(replacement with Φ18×1.5 flange member) | 10.655 | 10.794 | 14.397 |
| Damage Case 2 | Horizontal brace 60(remove all the bolts in one flange) | 10.732 | 11.018 | 14.687 |
| Damage Case 3 | Diagonal brace 25(remove all the bolts in one flange) | 10.888 | 11.041 | 14.721 |
From the bottom panel it can be clearly seen that the IMSE index correctly located the damage at element 60,whilst producing lower peak values at elements 55,64,and 65. Elements 64 and 65 were directly connected with the damaged element 60,and element 55 was symmetric to it,which confirmed that the damage was located at element 60.
The Stubbs index(the top panel of Fig. 19)also correctly located the damage at element 60,with lower index values at the two associated elements 55 and 64. However,it also identified two false locations at elements 42 and 67.
Damage Case 3: damage to a diagonal brace at element 25
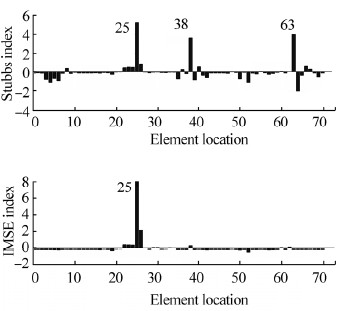
In damage Case 3,all the bolts of the flange on a diagonal brace at element 25 were removed to simulate comprehensive damage. Fig. 20 shows the damage indexes when all three modes were used Both the Stubbs method and the IMSE method correctly located the damage on the diagonal brace at element 25,but the Stubbs index again identified two false locations at elements 38 and 63.
|
| Fig. 20 Damage indexes for damage Case 3 |
In this experiment,damage to three different types of member was studied. From the results shown in Figs. 18-20,it can be clearly observed that the IMSE index proposed in this paper was able to correctly locate the damage to legs or braces,while the traditional MSE index also produced false locations because of its high sensitivity to measurement noise.
6 ConclusionsIn this research we developed an IMSE method for detecting damage to offshore platform structures. To improve the robustness of the traditional modal strain energy(the Stubbs index)method applied in offshore platform structure,we introduced frequency information. This proved successful in producing a more robust indicator.
Numerical studies were conducted of damage location under several simulated damage scenarios for an offshore jacket platform structure. The results demonstrated that when the mode shapes were spatially complete and noise-free,the estimated IMSE indexes were identical to the values produced by the Stubbs index,which validated the novel method. In the noise-polluted cases the IMSE method outperformed the Stubbs index method and showed stronger robustness. When the supplied mode shapes were both spatially incomplete and noise polluted,the advantages of the IMSE method became clear.
Experimental studies on a steel jacket platform structure model were then conducted and gave further evidence of the superiority of the novel method. The IMSE index proposed in this paper correctly located damage when the measured modal frequencies and mode shapes were limited,and significantly outperformed the traditional MSE method.
However,there were still some deficiencies in this approach. Only a general simulation of the stiffness degradation of the damaged members was used,unlike in real applications where cracks or corrosion may be present. Nor was the influence of the environment considered. Further studies are therefore needed to investigate these aspects.
| Al-Obaid YF, 1986. Numerical analysis of the laterally loaded piles in the Kuwait offshore environment. Ocean Engineering, 13(1), 85-92. DOI: 10.1016/0029-8018(86)90005-3 |
| Asgarian B, Lesani M, 2009. Pile-soil-structure in pushover analysis of jacket offshore platforms using fiber elements. Journal of Construction Steel Research, 65(1), 209-218. DOI: 10.1016/j.jcsr.2008.03.013 |
| ASTM A36, 2014. Standard specification for carbon structural steel. ASTM International, Conshohocken, USA, Designation A 36/A 36M-97a, 46 CFR 160.035-3(b) (2). DOI: 10.1520/A0036_A0036M-14 |
| Bao Q, Feng H, 2011. Finite element simplified fatigue analysis method for a non-tubular joint of an offshore jacket platform. Journal of Marine Science and Application, 10(3), 321-324. DOI: 10.1007/s11804-011-1075-0 |
| Chen Y, Gu M, Chen R, Kong L, Zhang Z, Bian X, 2015. Behavior of pile group with elevated cap subjected to cyclic lateral loads. China Ocean Engineering, 29(4), 565-578. DOI: 10.1007/s13344-015-0039-6 |
| Eicher JA, Guan H, Jeng DS, 2003. Stress and deformation of offshore piles under structural and wave loading. Ocean Engineering, 30(3), 369-385. DOI: 10.1016/S0029-8018(02)00031-8 |
| El-Din MN, Kim J, 2014. Sensitivity analysis of pile-founded fixed steel jacket platforms subjected to seismic loads. Ocean Engineering, 85(1), 1-11. DOI: 10.1016/j.oceaneng.2014.04.008 |
| Ferrante AJ, Valenzula EC, Ellwanger GB, 1980. An integrated computational procedure for the analysis of offshore structures supported by piles. Advanced Engineering Software, 2(4), 169-172. DOI: 10.1016/0141-1195(80)90050-9 |
| Helwany S, 2007. Applied soil mechanics with Abaqus applications. John Wiley & Sons, Hoboken Incorporation, Hoboken, USA, 60-64 . |
| Korzani MG, Aghakouchak AA, 2015. Soil-structure interaction analysis of jack-up platforms subjected to monochrome and irregular waves. China Ocean Engineering, 29(1), 65-80. DOI: 10.1007/s13344-015-0005-3 |
| Liang H, 2009. Review of research on interactions between deepwater steel catenary risers and soft clay seabeds. Journal of Marine Science and Application, 8(1), 163-167. DOI: 10.1007/s11804-009-8115-z |
| Mao D, Zhong C, Zhang L, Chu G, 2015. Dynamic response of offshore jacket platform including foundation degradation under cyclic loadings. Ocean Engineering, 100(1), 35-45. DOI: 10.1016/j.oceaneng.2015.03.012 |
| Memarpour MM, Kimiaei M, Shayanfar M, Khanzadi M, 2012. Cyclic lateral response of pile foundations in offshore platforms. Computers and Geotechnics, 42(1), 180-192. DOI: 10.1016/j.compgeo.2011.12.007 |
| Nazir A, Nasr A, 2013. Pullout capacity of batter pile in sand. Journal of Advanced Research, 4(2), 147-154. DOI: 10.1016/j.jare.2012.04.001 |
| Pan X, Zhang Z, 2009. Analyzing the safety of removal sequences for piles of an offshore jacket platform. Journal of Marine Science and Application, 8(4), 311-315. DOI: 10.1007/s11804-009-8050-z |
| Sangseom J, Donghee S, Youngho K, 2009. Numerical analysis of passive pile groups in offshore deposits. Computers and Geotechnics, 36(7), 1164-1175. DOI: 10.1016/j.compgeo.2009.05.003 |
| Sangseom J, Youngho K, Jaeyoung K, 2011. Influence on lateral rigidity of offshore piles using proposed p-y curves. Ocean Engineering, 38(2-3), 397-408. DOI: 10.1016/j.oceaneng.2010.11.007 |
| Ruiz SE, 1984. Reliability index for offshore piles subjected to bending. Structural Safety, 2(2), 83-90. DOI: 10.1016/0167-4730(84)90012-2 |
| Yu Hao, Li Xiaoyu, Yang Shuguang, 2012. Dynamic analysis method of offshore jack-up platforms in regular and random waves. Journal of Marine Science and Application, 11(1), 111-118. DOI: 10.1007/s11804-012-1112-7 |
| Zou X, Zhao M, 2013. Axial bearing behavior of super-long piles in deep soft clay over stiff layers. Journal of Central South University of Technology, 20(7), 2008-2016. DOI: 10.1007/s11771-013-1702-9 |
| Zou X, Zhao M, Liu G, 2007. Buckling analysis of super-long rock-socketed filling piles in soft soil area by element free Galerkin method. Journal of Central South University of Technology, 14(6), 858-863. DOI: 10.1007/s11771-007-0163-4 |


