2.China Ship Scientific Research Center, Wuxi 214082, China
International trade is an essential driving force for economic prosperity,and transport ships play a key role in the global trading system. In recent decades,owing to global warming,the extent and volume of Arctic sea ice has declined dramatically,which has allowed greater accessibility for shipping in Arctic waters. The effective utilization of Arctic shipping routes will generate significant economic interests in international trade as shipping distances between East Asia and Western Europe shrink substantially. Transport ships that are designed to navigate in Arctic regions should be able to break the ice cover without icebreaker assistance during their operational seasons. Because of the particular environmental conditions in polar regions,i.e.,being widely covered by sea ice,ice resistance is the major design consideration for this type of ship.
The ice resistance of ships has been widely studied by researchers,both experimentally and numerically. Kashteljan et al.(1968)are usually credited with the first detailed attempt to analyze level ice resistance by breaking it down into components. They provided an equation for the total ice resistance based on four terms,i.e.,resistances owing to breaking the ice,forces connected with weight,passage through broken ice,and water friction. This equation was developed using model-scale and full-scale icebreaker tests. Many later studies have followed the same strategy,and a variety of empirical formulas have been proposed(Lewis and Edwards, 1970; Enkvist,1972; Edwards and Major, 1976; Kotras et al., 1983; Keinonen et al., 1996; Riska et al., 1997; Spencer and Jones, 2001; Valanto,2001). Meanwhile,purely analytical methods for calculating ice resistance have also been derived. Milano(1973)provided a theoretical prediction of ship performance in ice based on a consideration of the energy needed for a ship to move through level ice and derived explicit analytical expressions for the total energy loss because of ship motion. Lindqvist(1989)considered the main parameters influencing ice resistance and developed a straightforward analytical method for calculating ship resistance in ice. Although these empirical and analytical formulas have been validated by corresponding full-scale or model-scale tests,the application of these formulas is unfortunately always restricted by the limitations of specific ship types,ship sizes,or sea conditions. To predict the resistance of a ship in ice,the most reliable way is to conduct ice model tests. Over the past decades,with the development of techniques for physically modeling ice-ship interaction,model testing has been the most popular method for determining ice resistance and optimizing the design of ice-breaking vessels. To accurately understand the regularity and characteristics of a ship’s ice resistance,we must fully observe the main phenomena occurring during ice-ship interactions and determine the corresponding relationship between the experimental phenomena and the test results. Although many model tests of ships in ice have been performed(Narita and Yamaguchi, 1981; Schwarz et al., 1981; Ettema et al., 1991; von Bock und Polach and Ehlers, 2011; Zhou et al., 2013),the description of the aforementioned corresponding relationship are rare.
In this study,we describe a series of model tests performed to investigate the resistance of a transport ship navigating in level ice. We conducted thorough analyses on the experimental phenomena,provided the measured results,and identified the corresponding relationships. Furthermore,we introduced the analytical method of Lindqvist(1989)and compared the calculated and test results.
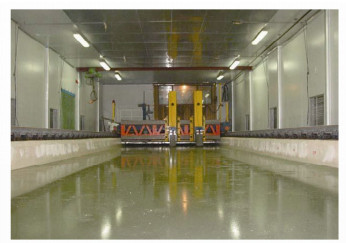
2 Experimental setup 2.1 Test facilityThe tests were performed in an ice tank at the Ice Engineering Laboratory of Tianjin University(Fig. 1). Over the past few decades,this laboratory has conducted a series of experimental studies on ice management,ice load determination,and ice-induced vibrations of offshore and coastal structures in cold regions,and good agreements have been achieved when compared with the results of full-scale observations(Shi et al., 2004; Huang,2010; Huang et al., 2013a,2013b). The ice tank,which is housed in an insulated room that can be cooled down to an air temperature of −22 °C,is 20 m long,5 m wide,and 1.5 m deep. The ice sheets are grown in the tank using an aqueous solution containing 1.5% urea,and the thickness of the ice sheets can be controlled within a range of 10 to 100 mm. By varying the room air temperature,ice sheets can be grown,tempered,or melted. The main carriage that spans the tank is designed for loads up to 5 t,and it can move a given distance at a constant speed,ranging from 0.001 to 0.5 m/s.
|
| Fig. 1 Ice Engineering Laboratory at Tianjin University |
This study aims to simulate and investigate the ice resistance of ships. Through ice model tests,we investigated the ice resistance of the model ship using physical modeling laws,where the critical forces experienced by a full-scale ship are maintained at the same ratio on the model but at a reduced scale. For ice-ship interactions,the flexural failure of ice dominates. As such,the similarity in the inertial,gravitational,and elastic forces,which contribute significantly to the bending forces in the flexural failure process,predominated in establishing the scaling law. Specifically,we used the Froude and Cauchy scaling laws; the law of Froude governs the relationship between inertia and gravity,whereas the law of Cauchy governs the relationship between inertia and elasticity. To satisfy both laws simultaneously,the Froude and Cauchy numbers in the model scale were maintained to be the same as those in the prototype. For the tests performed in this study,the geometric scale factor λ, by which the dimensions of the full-scale ship are reduced to model scale,was taken as 50. Then,we scaled the ice strength,ice thickness,and ice elastic modulus by λ,time and velocity by λ1/2,and mass and forces by λ3.
2.3 Model iceThe prototype ship was designed as a Polar Class 5,as established by the International Association of Classification Societies(IACS),and requires year-round operation in medium first-year ice. According to field observations from China’s fifth and sixth Arctic expedition,the main characteristics of medium first-year ice are a thickness of 1.6 m and a flexural strength of 500 kPa. Based on the scale factors mentioned above,the required ice conditions at the model scale are 32 mm in thickness and 10 kPa in flexural strength.
We used urea model ice in the test series,using a wet seeding process to initiate growth of the ice sheet when the water and air temperatures were 0 and −10 °C,respectively,by spraying a mist of urea aqueous solution with compressed air above the water surface. This process makes small and uniform crystal sizes in the ice sheet. After the nucleation of ice on the water surface,the room temperature was lowered to −22 °C until the desired ice thickness was achieved,and the strength of the model ice was controlled by tempering the ice sheet.
Fig. 2 shows a picture of a section of the model ice. We found the model ice to be composed of two layers:(a)an upper layer,also called the seeding controlled layer,characterized by the formation of fine-grained and randomly-oriented crystals; and(b)a lower columnar layer with a parallel and vertical growth pattern. The texture of the model ice was obviously dominated by the columnar structure,which is also the predominant characteristic of natural sea ice in Arctic regions. An ice sheet grown using a 1.5% ure a solution by the above process possesses the ideal behavior of high rigidity and low flexural strength,i.e.,it maintains a ratio of elastic modulus to flexural strength greater than 2 000 for strengths less than 15 kPa.

|
| Fig. 2 Photo of a section of model ice |
We measured the properties of the ice using the procedures recommended by the ITTC(2002). We made three ice sheets for testing,and the average values of the ice thickness,h,flexural strength,σb,compressive strength,σc,and elastic modulus,E are given in Table 1.
| Ice sheet No. | h/mm | σb/kPa | σc/kPa | E/MPa |
| I | 32 | 13 | 49 | 34 |
| II | 30 | 12 | 37 | 28 |
| III | 31 | 12 | 43 | 31 |
The flexural strength of the model ice was monitored by intermittently measuring the ice strength using the cantilever beam method. The variability of the measured flexural strengths did not exceed 10%. We measured the compressive strength by performing uniaxial compression tests on the model ice samples. For every generated ice sheet,several ice samples were tested for their compressive strength,and the results were compared with the flexural strength measurements that were carried out near the positions wherein the ice samples were cut. These comparisons showed that the ratio of compressive strength to flexural strength ranged between 3.1 and 3.8,which was reasonable,according to the typical σc/σb ratios of 0.5-5 presented by Timco and Weeks(2010). The modulus of elasticity of the ice sheets produced in above process was about 2 500 times the flexural strength. In addition,we measured the friction between the ice block and the painted model hull. The static coefficient of friction was 0.22 on average,while the average kinetic friction coefficient was 0.10 at a speed of 0.15 m/s.
2.4 Model shipThe full-scale ship discussed in this study is a transport ship navigating in Arctic waters with a bow area specially designed and reinforced to break ice cover. The primary dimensions of the ship are listed in Table 2. The dimensions of the model ship were determined based on the scaling factor λ,as shown in Table 2.
| Item | Full scale | Model scale |
| Waterline length/m | 274 | 5.480 |
| Breadth/m | 44 | 0.880 |
| Draft/m | 15.8 | 0.316 |
| Stem angle/(°) | 26 | 26 |
| Waterline angle/(°) | 29 | 29 |
| Flare angle/(°) | 48 | 48 |
The model ship was mounted on the rigid towing beam of the laboratory’s main carriage through a one-directional load cell,as shown in Figs. 3 and 4. The load cell was fixed vertically at the same level as the waterline and horizontally in the center of the ship. The signals from the load cell were recorded by the data acquisition system and sampled at a rate of 100 Hz. Before each test,the load cell was taken as zero.

|
| Fig. 3 Side view illustration of the test system |

|
| Fig. 4 Photo of the towing beam and model ship |
The target navigating speeds for the study tests were 0.100,0.146,and 0.190 m/s,which represented 1.5,2,and 2.5 kn at full scale,respectively. We performed a total of three tests. Each test run was initiated when the measured flexural strength reached the target value. During each test,the model ship was first lowered to the correct water level by arranging additional weights inside the hull. Then the model ship was towed through the ice sheet at the desired speed. To ensure the sufficiency of the test data,the towing distance in each test run was set as two times the model ship length. The test conditions and parameters are listed in Table 3.
| Test No. | Speed/(m·s−1) | Ice sheet No. | Ice condition |
| 1 | 0.100 | Ⅰ | Level ice |
| 2 | 0.146 | Ⅱ | Level ice |
| 3 | 0.190 | Ⅲ | Level ice |
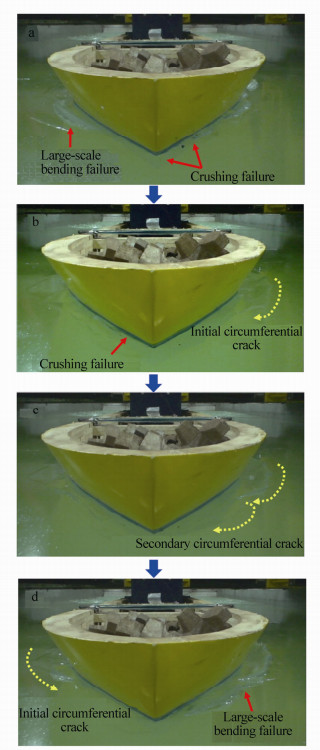
Using test videos,we made detailed observations of the ice-breaking process at different parts of the ship. First,several ice failure modes were observed in the area close to the bow. As shown in Fig. 5,the ice-breaking process in the bow area can be divided into the following phases:
|
| Fig. 5 Continuously captured screenshots from the test video in test No. 1 |
a)A large-scale bending failure of the ice sheet occurred at one side of the bow. At the other side,local crushing failure simultaneously occurred near the bow stem,which induced the growth of several radial cracks in the ice sheet.
b)After the large-scale broken ice submerged in the water,the crushing failure of the ice subsequently started on the same side. Meanwhile,a circumferential crack(the initial circumferential crack)formed at the shoulder area and propagated toward the bow stem on the other side.
c)The propagation of the initial circumferential crack was blocked by the radial crack,subsequently generating a new circumferential crack(the secondary circumferential crack)that kept propagating toward the bow stem.
d)The initial and secondary circumferential cracks together caused a large-scale bending failure of the ice sheet from the shoulder to bow stem. Meanwhile,on the other side,the propagation of the circumferential crack followed the same process from phases a to d,as shown in Fig. 5.
When the ship moved forward,the broken ice floes at the bow area rotated,submerged,and then slid into the water. Along with the rotating motion,a further breaking process of the ice sheet occurred at the mid-ship area. This process generally started with the backward propagation of the circumferential crack formed at the shoulder area,and the propagating trail was similar to a circular arc. After the first circular crack formed near the shoulder area,two or more circular cracks followed the same propagating pattern,as shown in Fig. 6. The propagation of these circular cracks generally ended at the mid-hull area. The main characteristic of the interaction between the ice and rear part of the ship was the friction between the edges of the ice channel and both sides of the hull.

|
| Fig. 6 Circular cracks at the side of the ship |
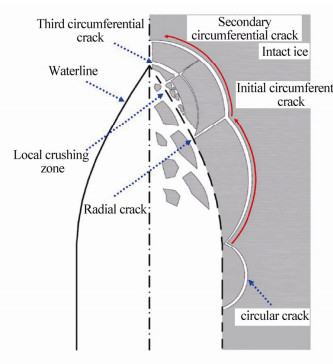
In addition,we found a third set of circumferential cracks after further observation of the test videos. These were circumferential cracks that divided the broken ice floes around the crushing failure area into smaller pieces. On these grounds,the ice-breaking pattern described above can be illustrated as the series of processes shown in Fig. 7. We found that,unlike the common understanding of the ice-breaking process,the large-scale bending failure of the ice sheet was always initiated from the shoulder area,which would result in the ship possessing a larger ice resistance value.
|
| Fig. 7 Illustration of ice-breaking process along the ship |
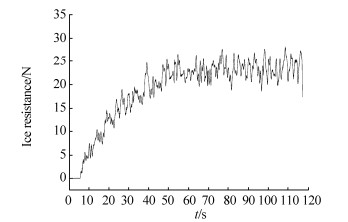
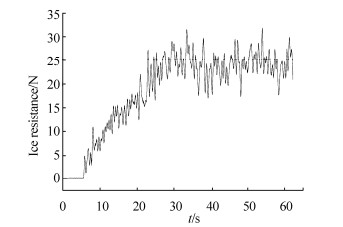
Figs. 8-10 show the time histories of the resistance of the model ship in level ice at navigating speeds of 0.100,0.146 and 0.190 m/s,respectively. The mean and maximum values of the ice resistance under different speeds are listed in Table 4.
|
| Fig. 8 Ice resistance time history (v=0.100 m/s) |

|
| Fig. 9 Ice resistance time history (v=0.146 m/s) |
|
| Fig. 10 Ice resistance time history (v=0.190 m/s) |
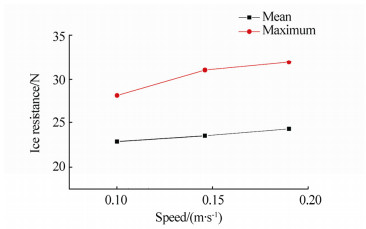
| Speed/(m·s−1) | RMean/N | RMax/N |
| 0.100 | 22.850 | 28.195 |
| 0.146 | 23.494 | 31.031 |
| 0.190 | 24.262 | 31.928 |
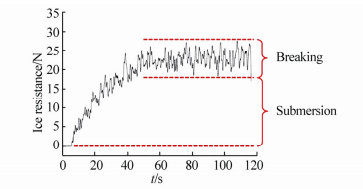
From Figs. 8-10,we can observe specific fluctuations in the time-history curves that correspond with the different phases of the ice-breaking process described above. Taking the time histories of the resistance at 0.100 m/s,for example(Fig. 11),the corresponding relationship can be described as follows:

|
| Fig. 11 Illustration of the corresponding relationship between ice-breaking process and ice resistance |
a)During the local crushing failure process,the ice resistance fluctuated rapidly and continuously at a relatively high level.
b)During the propagation of the initial circumferential crack,the ice resistance reached a peak value quickly but soon dropped owing to the blocking of the radial crack.
c)Corresponding with the propagation of the secondary circumferential crack,another peak resistance value was reached.
d)The collapse of the ice sheet at a large scale eventually led to a rapid and precipitous drop in the resistance. However,the circumferential crack at the other side of the bow caused a new rise in the resistance curve.
We found that among the different phases of the individual ice-breaking process,the propagation of the initial circumferential crack at the shoulder area resulted in the maximum ice resistance value.
4.3 DiscussionFig. 12 presents the variances in the ice resistance with navigating speed in the model scale. We found that the mean and maximum resistances of the ship in level ice increased with the navigating speed.
|
| Fig. 12 Plotted results of RMean and RMax against speed |
As mentioned above,many researchers have studied the ice resistance of ships by breaking the process down into components. We took a similar approach in this study by dividing the measured ice resistance of the model ship into two components,which included terms such as breaking resistance and resistance owing to submersion(including friction),as shown in Fig. 13. Based on the scaling laws mentioned above,we derived the measured ice resistances and their components under different speeds at full scale,and these are listed in Table 5.
|
| Fig. 13 Illustration of the two resistance components |
| Speed/kn | Ice resistance/MN | ||
| Breaking | Submersion | Total | |
| 1.5 | 1.194 | 2.330 | 3.524 |
| 2 | 1.662 | 2.217 | 3.879 |
| 2.5 | 1.917 | 2.074 | 3.991 |
We can determine from Table 5 that the breaking component accounted for 34%-48% of the total,with a larger value applying at higher speed. According to the full-scale tests presented by Enkvist(1983),the percentage of breaking resistance in total ice resistance varies between 40% and 80%,with the higher figure associated with smallest ships. Given the large dimensions of the transport ship discussed in this study,the measured percentages of 34%-48% are quite accurate.
Next,we introduced the analytical method of Lindqvist(1989)to make a comparison. Lindqvist’s approach is an uncomplicated method for estimating ice resistance levels. The parameters included in this method are the main dimensions,hull form,ice thickness,friction,and ice strength. The main resistance components used are breaking(crushing and bending),submersion,and speed dependence. The calculated results of the ice resistance with navigating speeds of 1.5,2,and 2.5 kn are listed in Table 6.
| Speed/kn | Ice resistance/MN | ||
| Breaking | Submersion | Total | |
| 1.5 | 1.155 | 2.645 | 3.800 |
| 2 | 1.228 | 2.765 | 3.993 |
| 2.5 | 1.320 | 2.863 | 4.183 |
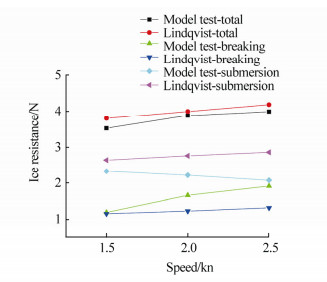
From Fig. 14,we can compare the test results with the calculated results. We found that Lindqvist’s calculated total resistances were higher than the test results,although they were in the same order of magnitude. In addition,the breaking components from Lindqvist’s calculated results were lower than those from the model tests,whereas the submersion components were higher. The explanations for these comparison results are discussed below:
|
| Fig. 14 Comparisons between test and calculated results |
1)In Lindqvist’s analytical method,the bending failure that occurred in the shoulder area,which would cause the underestimation of the breaking resistance,is not considered.
2)The formulation of the speed dependence component in Lindqvist’s approach was approximated using empirical constants,and the validation of this method was conducted against the results obtained with small icebreakers in Baltic conditions,where the ice thickness was less than 0.65 m. For the transport ship discussed in this study,which is of a larger dimension and designed for operation in the Arctic region,Lindqvist’s method may not be fully applicable.
5 ConclusionsThis study presents a series of model tests to investigate the resistance of a transport ship navigating in level ice. We observed the ice-breaking process at different parts of the ship,measured the ice resistances under different speeds,and determined the corresponding relationship between the ice-breaking process and the ice resistance. In addition,we introduced the analytical method of Lindqvist(1989)and compared the calculated results with the test results of this study. The following conclusions can be drawn.
| Edwards RY Jr, Major RA, 1976. Influence of major characteristics of icebreaker hulls on their powering requirements and maneuverability in ice. Transactions of the Society of Naval Architects and Marine Engineers, 84, 364-407. |
| Enkvist E, 1972. On the ice resistance encountered by ships operating in the continuous mode of icebreaking. The Swedish Academy of Engineering Sciences in Finland, Helsinki, Report No. 24, 181. |
| Enkvist E, 1983. A survey of experimental indications of the relation between the submersion and breaking components of level ice resistance to ships. Proceedings of the International Conference on Port and Ocean Engineering under Arctic Conditions, Helsinki, Finland, 484-493. |
| Ettema R, Sharifi MB, Georgakakos KP, Stern F, 1991. Chaos in continuous-mode icebreaking. Cold Regions Science and Technology, 19, 131-144. DOI: 10.1016/0165-232X(91)90004-Z |
| Huang Y, 2010. Model test study of the nonsimultaneous failure of ice before wide conical structures. Cold Regions Science and Technology, 63(3), 87-96.DOI: 10.1016/j.coldregions.2010.06.004 |
| Huang Y, Ma JJ, Tian YF, 2013a. Model tests of four-legged jacket platforms in ice: Part 1. Model tests and results. Cold Regions Science and Technology, 95, 74-85. DOI: 10.1016/j.coldregions.2013.07.004 |
| Huang Y, Yu M, Tian YF, 2013b. Model tests of four-legged jacket platforms in ice: Part 2. Analyses and discussions. Cold Regions Science and Technology, 95, 86-101. DOI: 10.1016/j.coldregions.2013.07.003 |
| ITTC, 2002. Test methods for model ice properties. International Towing Tank Conference. |
| Kashteljan VI, Poznyak II, Ryvlin, AY, 1968. Ice resistance to motion of a ship. Sudostroyeniye (Soviet Shipbuilding), Leningrad. |
| Keinonen AJ, Browne R, Revill C, Reynolds A, 1996. Icebreaker characteristics synthesis, Report TP 12812E. The Transportation Development Centre. |
| Kotras TV, Baird AV, Naegle JW, 1983. Predicting ship performance in level ice. Transactions of the Society of Naval Architects and Marine Engineers, 91, 329-349. |
| Lewis JW, Edwards RY Jr, 1970. Methods for predicting icebreaking and ice resistance characteristics of icebreakers. Transactions of the Society of Naval Architects and Marine Engineers, 78, 213-249. |
| Lindqvist G, 1989. A straightforward method for calculation of ice resistance of ships. Proceedings of the International Conference on Port and Ocean Engineering under Arctic Conditions, Lulea, Sweden, 722-735. |
| Milano VR, 1973. Ship resistance to continuous motion in ice. Transactions of the Society of Naval Architects and Marine Engineers, 81, 274-306. |
| Narita S, Yamaguchi M, 1981. An experimental study of hull forms for the new Japanese Antarctic observation ship. Proceedings of the 6th STAR Symposium, Ottawa, Canada, 253-271. |
| Riska K, Wilhelmson M, Englund K, Leiviskä T, 1997. Performance of merchant vessels in the Baltic, Research report No. 52. Helsinki University of Technology, Ship Laboratory, Winter Navigation Research Board, Espoo. |
| Schwarz J, Jochmann P, Hoffman L, 1981. Prediction of the icebreaking performance of the German polar research vessel. Proceedings of the 6th STAR Symposium, Ottawa, Canada, 239-248. |
| Shi QZ, Huang Y, Song A, 2004. The shielding effect of multi-pile structures on ice force. China Ocean Engineering, 18(2), 197-206. DOI: 10.3321/j.issn:0890-5487.2004.02.003 |
| Spencer D, Jones SJ, 2001. Model-scale/full-scale correlation in open water and ice for Canadian Coast Guard “R-Class” icebreakers. Journal of Ship Research, 45(4), 249-261. |
| Timco G, Weeks W, 2010. A review of the engineering properties of sea ice. Cold Regions Science and Technology, 60(2), 107-129. DOI: 10.1016/j.coldregions.2009.10.003 |
| Valanto P, 2001. The resistance of ships in level ice. Transactions of the Society of Naval Architects and Marine Engineers, 109, 53-83. |
| von Bock und Polach R, Ehlers S, 2011. Heave and pitch motions of a ship in model ice: An experimental study on ship resistance and ice breaking pattern. Cold Regions Science and Technology, 68(1-2), 49-59. DOI: 10.1016/j.coldregions.2011.04.007 |
| Zhou L, Riska K, von Bock und Polach R, Moan T, Su B, 2013. Experiments on level ice loading on an icebreaking tanker with different ice drift angles. Cold Regions Science and Technology, 85, 79-93. DOI: 10.1016/j.coldregions.2012.08.006 |


