1 Introduction
In order to meet increased energy demands while also reducing CO2 emissions, the development of renewable energy sources is currently a priority for many industrialized countries. Wave power is an extremely promising renewable resource that could provide a substantial supply of clean energy (Bozzi et al., 2013). Using waves as a renewable energy source offers significant advantages over other energy generation methods, including the following (Drew et al., 2009):
1) Sea waves offer the highest energy density among the renewable energy sources.
2) There are few negative environmental impactsassociated withtheir use.
3) There is a natural seasonal variability in wave energy, which follows electricity demand in temperate climates.
4) Waves can travel great distances with little energy loss.
5) Wave power devices can reportedly generate power up to 90 percent of the time, compared to 20-30 percentfor wind and solar power devices.
Due to the high density of water, sea wave power is one of the most powerful sources of renewable energy. In recent years, wave energy extraction has been a popular field of study among researchers and examples of wave-energy converters are found throughout the literature (Antonio, 2009; Drew et al., 2009; Falnes, 2002). These converters are generally divided into categories based on their distance from the shoreline and the type of technology used.
In another category type, there are three groups of devices that are classified based on their horizontal dimension with respect to sea waves. When the horizontal dimension of a converter is much smaller than the wavelength of an incident wave, it is known as a point absorber; otherwise, it is called a line absorber. A line absorber that is parallel with the waves is called an attenuator and one that is perpendicular to the waves is called a terminator. In this study, we focus on the point absorber. Point absorbers (floating or submerged) convert the vertical motion of ocean waves into linear or rotational motion to drive electrical generators by means of a power take off (PTO) system (Bozzi et al., 2013). While they have a low energy absorbtion rate, if the size of the device is taken into account, its energy absorption capacity seems favorable (Iglesias et al., 2010). In addition, active and /or passive controls, as well as an optimized wave farm arrangement, can result in an increase in total energy absorption (Babarit et al., 2004; Fusco et al., 2011).
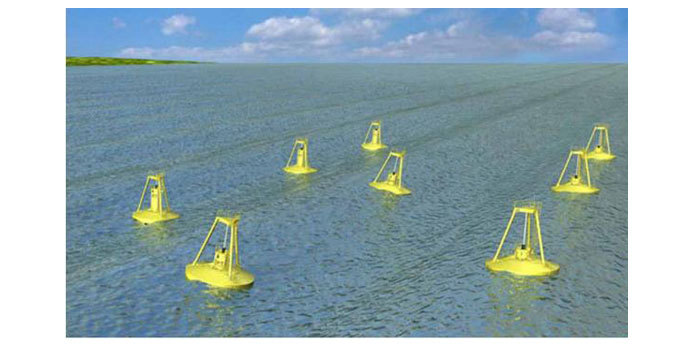
The Folating Point Absorber (FPA) concept was first introduced by Budal and Falnes (1978) , and the mathematical FPA relationships were presented by McCormick (2013) . It is an incontestable fact that a good wave absorber must be a good wavemaker. Hence, in order to absorb wave energy, it is necessary to displace water in an oscillatory manner and with the correct phase (timing) (Cruz, 2008; Falnes, 1995). FPAs can heave up and down on the surface of the water. Because of their small size, wave direction is not an important consideration for these devices. There are numerous examples of FPAs, one of which is Ocean Power Technology (OPT) ’s Powerbuoy. Fig. 1 shows an photo of a wave farm using Powerbuoys (Drew et al., 2009).
|
| Fig. 1 FPA device: OPT PowerBuoy |
Eriksson et al. (2005) conducted numerical wave interaction studies using a cylindrical point absorber connected to a seabed-based linear generator. In that study, the generator was modeled as a viscous damper. By writing the equation of motion and considering different diameters, as well as the spring and damper coefficients, it is possible to calculate the energy absorption.
Y.Yu and Y.Li (2013) studied the nonlinear interaction between waves and an FPA device. Their study showed that the nonlinear effects, including viscous damping and wave overtopping, could significantly decrease the power output and the motion of the FPA system, particularly in the presence of larger waves. Nazari et al. (2013) , performed a feasibility study on the implementation of a point absorber in the port of Assaluyeh. The results showed that the natural frequency and damping coefficient parameters significantlyaffect the average heave displacement. Therefore, by changing the shape of the device to a conical cylinder, the drag coefficient was decreased by 50% and the mean energy was increased by 45 watts.
Later, Beirao and Malca (2014) conducted another numerical study using a commercial finite element code. They performed a time domain analysis using Simulink Matlab software. By designing a heaving buoy in water of infinite depth, they found that a spherical geometry is optimal.
To improve efficiency, Goggins and Finnegan (2014) studied three geometric parameters, the diameter of the floating component, and the damping coefficient. In a case study on Irel and ’s west coast, Pastor and Liu (2014) simulated and analyzed the performance of a point absorber in the frequency and time domains, and obtained hydrodynamic coefficients using ANSYS-AQWA software. This device was used to generate electricity on a gas and oil platform, and the study objective was to determine the optimum geometry and draft.
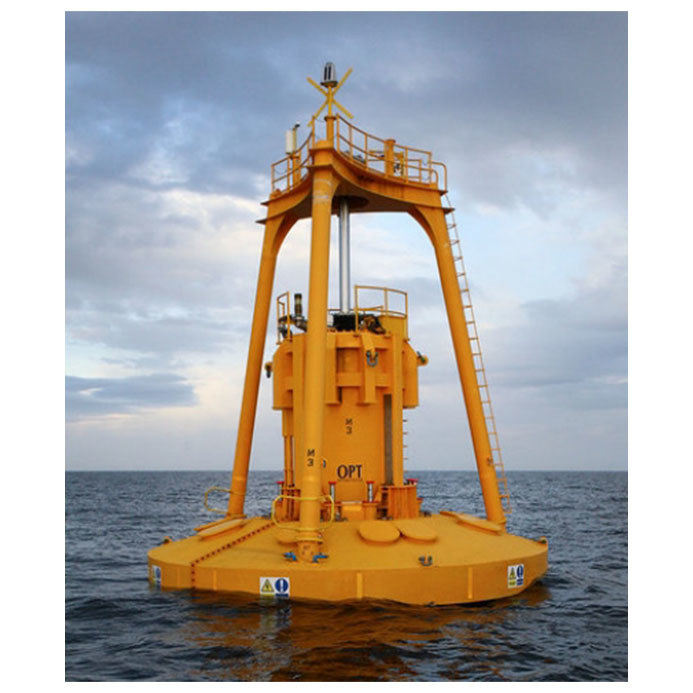
In general, recently developed computational tools facilitate more efficient analysis of the behavior of such devices, although they may be fragile, depending on their configurations and methodologies. The FPA device used in this study was inspired by OPT’s PowerBuoy, as shown in Fig. 2 (Courtesy of Ocean Power Technologies, 2013).
|
| Fig. 2 Prototype of OPT’s PowerBuoy |
Since, in our research, we used ANSYS-AQWA software as a core tool for computation, we carefully considered as main factors the existing software restrictions as well as our study objectives. The hydrodynamic parameters come with the AQWA software package, which is based on the boundary element method and linear potential wave theory. Therefore, it is a suitable approximation for modeling point absorbers (Bozzi et al., 2013).
We considered the two-body FPA device to explore the effects of wave height and period, and those of the device diameter, draft, geometry, and damping coefficient on energy conversion and device efficiency. This device extracts wave energy during the heave motion through a mass-spring-damper system. Herewe consider that the mass-spring-damper system actsin a linear fashion. The effects of the nonlinear interaction between waves and the FPA device, and viscous damping and wave overtopping in particular, are not investigated in this study. This paper is organized as follows: In the second section, we characterize the FPA concept, the equations of motion of FPA devices, and the PTO system’s force and power. In the third section, we discuss the main governing equations and modeling flowchart in the ANSYS-AQWA software package. In the fourth section, we validate our results by comparing them with existing experimental test results. In the fifth section, we investigate the effects of the various parameters listed above. Finally, in the last section, we draw our conclusions.
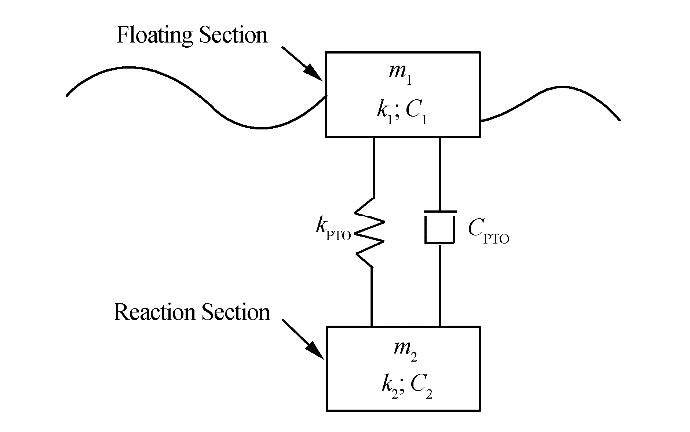
2 FPA ConceptAs mentioned above, the converter examined in this study is a two-body FPA, with one degree of freedom in the heave direction (Fig. 3). The floating section deals directly with the wave and the other section is completely submerged. The relative motion of the two components results in energy absorption. These two parts are connected by a linear mass-spring-damper system, which is expressed as a PTO.
|
| Fig. 3 Simplified schematic of the FPA system |
The equation of motion of an FPA in heave motion is obtained by:
\[F = ma\]
(1)
\[{\rm{Float:}}{\left ( {{F_z}} \right) _F} + {F_{PTO}} = {m_F}{a_F}\]
(2)
\[{\rm{Reaction: (}}{R_z}{{\rm{) }}_R} - {F_{PTO}} = {m_R}{a_R}\]
(3)
\[{F_{{\rm{PTO}}}} = - {C_{{\rm{PTO}}}}\left ( {{u_F} - {u_R}} \right) - {K_{{\rm{PTO}}}}\left ( {{z_F} - {z_R}} \right) \]
(4)
Also, the generated instantaneous power (PTO) is proportional to the square of the relative translational velocity of the two sections, and is expressed as follows:
\[{P_{{\rm{PTO}}}} = {C_{{\rm{PTO}}}}{\left ( {{u_F} - {u_R}} \right) ^2}\]
(5)
In this study, numerical modeling is performed with ANSYS-AQWA software, which uses the potential flow theory and adiffraction/radiation theory application. The velocity potential is obtained by assuming incompressible and irrotational flow:
\[u = \nabla \phi \]
(6)
\[\phi (x,t) = {\phi _I} + {\phi _D} + {\phi _R}\]
(7)
In diffraction theory, the potential function is calculated by solving the Laplace equation, applying appropriate boundary conditions, and then calculating the pressure and consequent acting forces on the body.
4 ValidationTo validate this model, we compared the numerical results of these two steps with those from similar experiments. In the first verification test, we assumed that there was no PTO connection between the two parts and the one-body system, and by modeling the PTO, we evaluated the two-body FPA system. We measured the output power for different wave conditions.
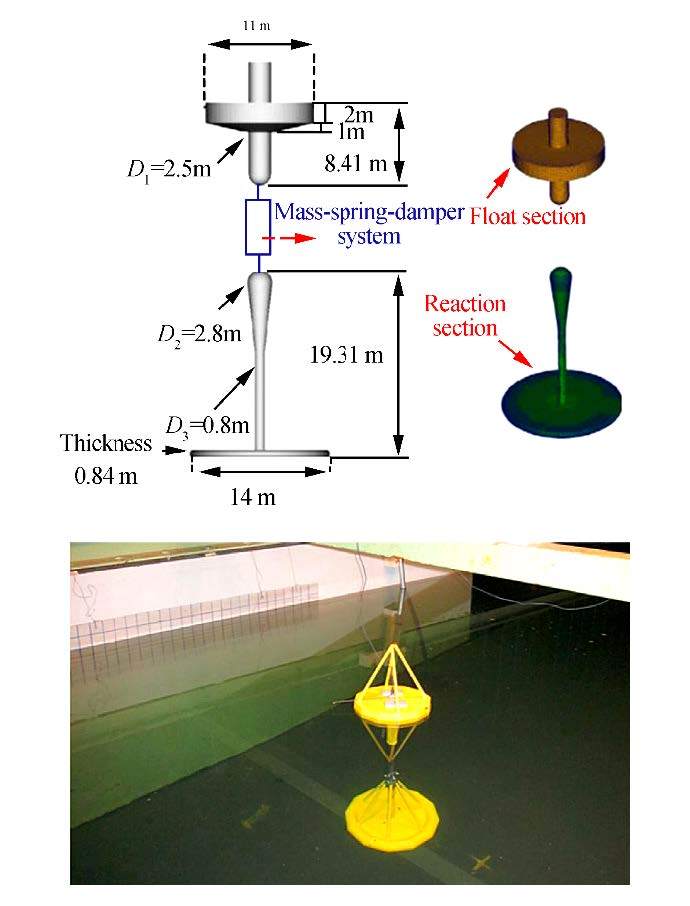
4.1 Experimental Set-upIn December 2010, researchers from UC Berkeley conducted an experimental test with a floating buoy with one degree of freedom in the heave direction. Fig. 4 shows the buoy in the flume, with a length, width, and height of 68, 2.4, and 1.5 meters, respectively.
|
| Fig. 4 FPA with exact dimensions in experimental tank |
In the laboratory, to perform the decay test, an initial displacement of Hin = 0.02 m was applied and the natural frequency obtained was around 0.9 s.
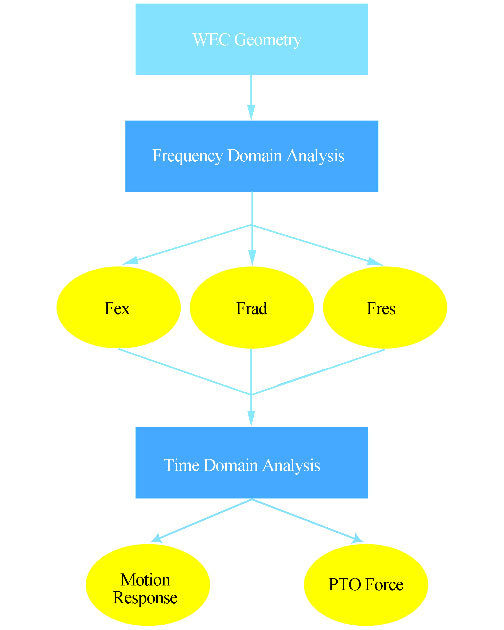
4.2 Numerical Set-upThe flowchart in Fig. 5 shows the three main steps of the modeling process in the AQWA software package.
|
| Fig. 5 Modeling flowchart with ANSYS-AQWA software |
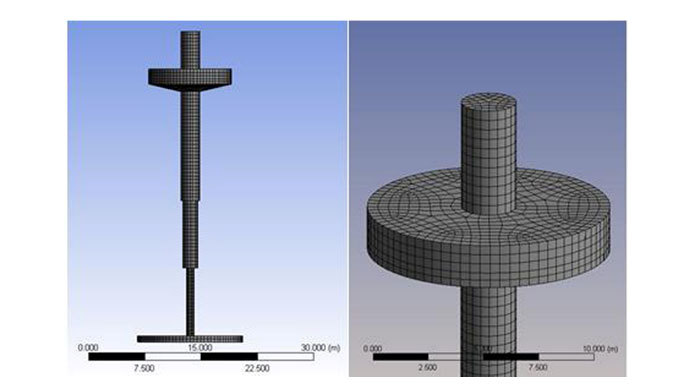
The model geometry was drawn using SolidWorks software. To analyze in the frequency domain, we considered the frequency range for the construction of hydrodynamic matrices to be 0.1-0.33 Hz. At this stage, the we conducted an analysis of the balance, stability, diffraction/radiation, and frequency domains, as illustrated in Fig. 3. Fig. 6 shows the grid resolution around the FPA model. Note that the sensitivitiy of the grid was examined, and the total number of meshes was set to 7007.
|
| Fig. 6 Mesh used in the AQWA simulation |
The third step is to consider the nonlinear problem and estimate the power output in the time domain. A nonlinear problem, here, refers to the effect of second order wave forces. These effects are most apparent in the behavior of anchored or moored floating structures (Journée, 2001).
Studies have shown that a final simulation time of 120 s and a time step of 0.05 s are appropriate, so they were utilized in this study. We defined the wave as linear and the outputs of this stage as displacement, velocity, acceleration of the FPA, mooring forces, and time history.
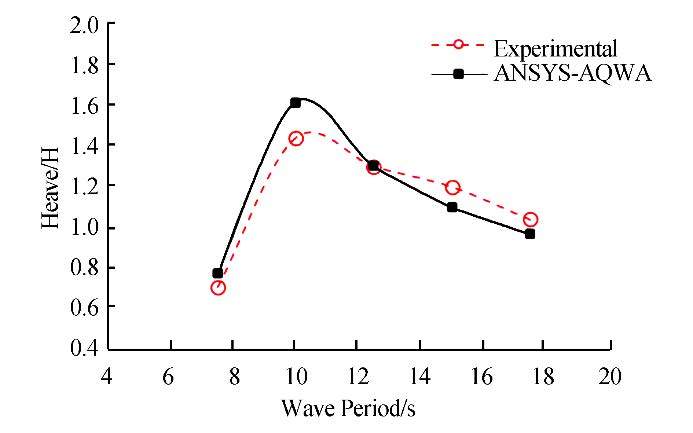
Fig. 7 shows a comparison between the numerical results and the experimental data in the one-body FPA system with an incident wave height of 2 m (H = 2 m). The vertical axis is the response amplitude operators (RAOs) and the horizontal axis is the wave period. When the wave period is more than the resonant period, the heave response follows the motion of the water surface. Also, the peak period occurs at the natural period, as obtained from the decay test.
|
| Fig. 7 Comparison between the numerical results and the experimental data in the one-body FPA system (H=2m) |
To validate the two-body FPA system, we considered an incident wave with a period of 8s and a height of 2.5m. The float section displaces more in the vertical direction due to its direct contact with the waves, and the displacement decreases with depth.
Figs. 8 and 9 express the velocity responses of the float and reaction sections, respectively.

|
| Fig. 8 Velocity response of the float section (H=2.5 m, T=8 s) |

|
| Fig. 9 Velocity response of the reaction section (H=2.5 m, T=8 s) |
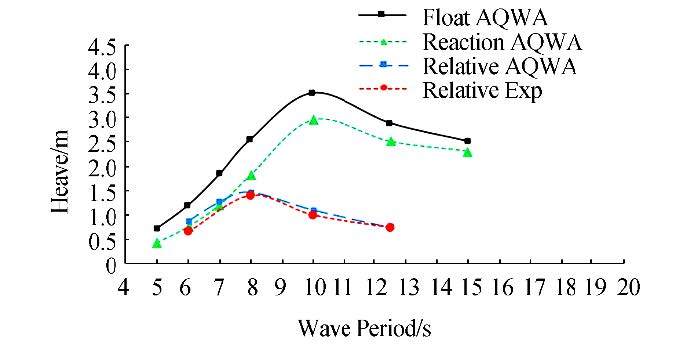
To ensure the accuracy of the PTO modeling, we radiated an incidental wave with a height of 2.5 m, and then compared the different wave periods and relative displacements obtained from numerical results with those in the experimental data. (see Fig. 10)
|
| Fig. 10 Heave response of the point absorber (H=2.5m) |
Our validation showed that the output of the ANSYS-AQWA software agreed with the experimental data. Differences between the results are due to numerical errors, such as simplifying assumptions and errors in the experimental procedure, such as measurement error, which are normal. In the following section, we discuss the effects of various parameterson energy absorption and device efficiency, including wave height and wave period, and the device diameter, draft, geometry, and damping coefficient.
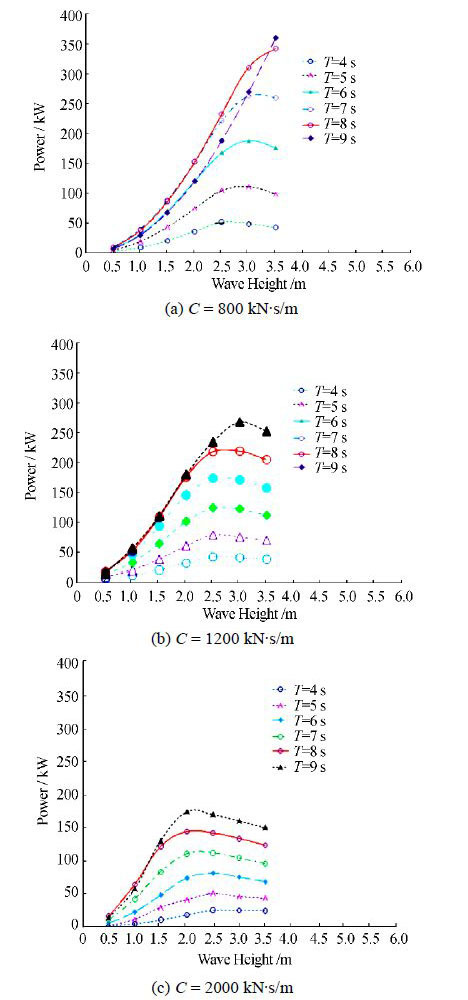
5.1 Wave heightWe studied wave energy absorption by the point absorber for different wave heights and periods. The amount of energy absorbed is directly related with the wave period. This process continues until the natural period of the device equalizes with the wave period and becomes resonant with it.
At higher wave periods, energy absorption is reduced. We assessed three damping scenarios, at 800, 1200, and 2000 kN∙s/m, and the results are shown in Fig. 11.
|
| Fig. 11 Effect of wave height on energy absorption |
When the wave height is decreased, the energy absorption increases with increasing wave periods, whereas increasing the height results in energy absorption reduction and peak displacement.
From Fig. 11, we see that with increased damping, it is more likely that maximum energy absorption occurs at lower wave heights and higher periods. Therefore, if wave conditions are known, the optimal damping ratio can be selected to yield resonance and the maximum absorption of power.
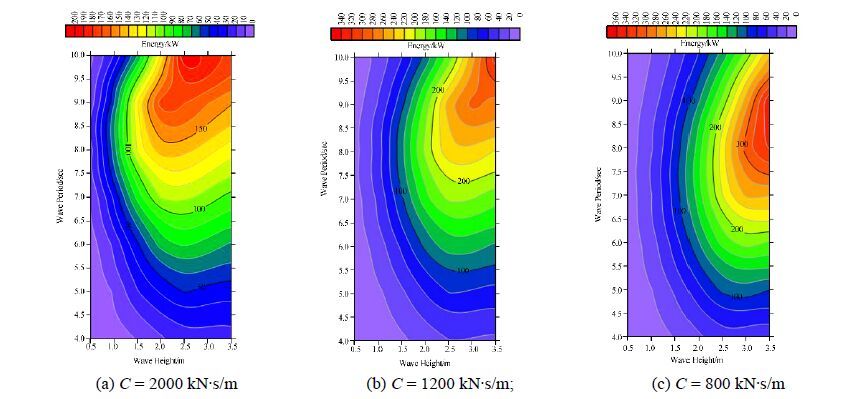
Fig. 12 graphically shows the effect of wave height and wave period on energy. In this figure, the results indicated by the warmer color represent the maximum absorption.
|
| Fig. 12 Contour plots illustrating the effect of wave height and wave period on energy |
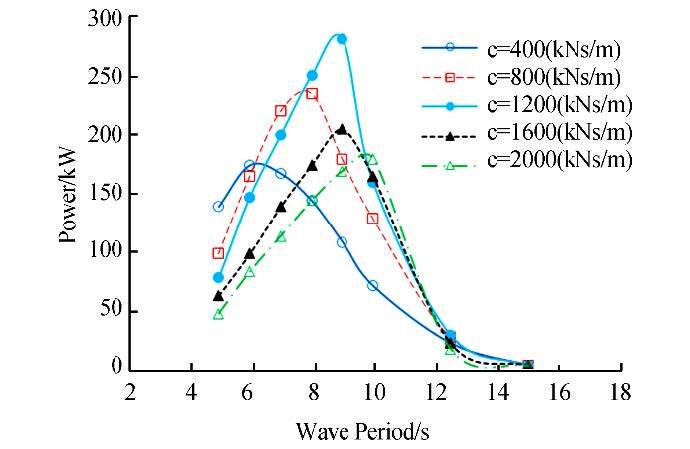
By examining several damping coefficients, we found that by increasing the damping coefficient, energy absorption increases until it reaches 1200kN∙s/m, as shown by the trend of changes in Fig. 13.
|
| Fig. 13 Effect of damping coefficient on absorbed power (H=2.5m) |
The float section is a cylinder with a diameter of 11m and a height of 3m. If there is an incident wave with a height of 2m and different periods, the results will be as shown in Fig. 12. As we can see, the highest energy is 280kW at a period of 9s, which is equal to the natural decay period.
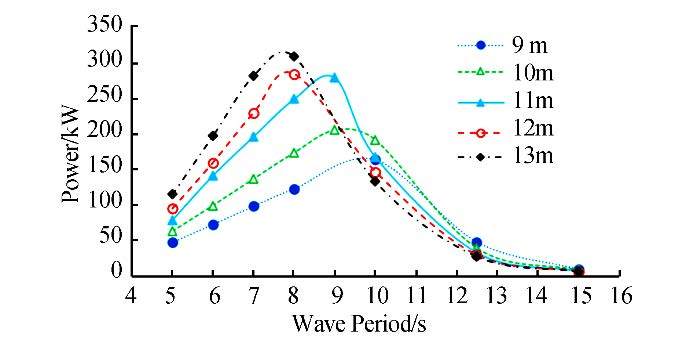
We repeated the simulation with four different diameters of 9, 10, 12, and 13m, while the other parameters remain constant. The PTO absorption coefficient for damping and spring stiffness are 1200kN∙s/m and 20kN/m, respectively.
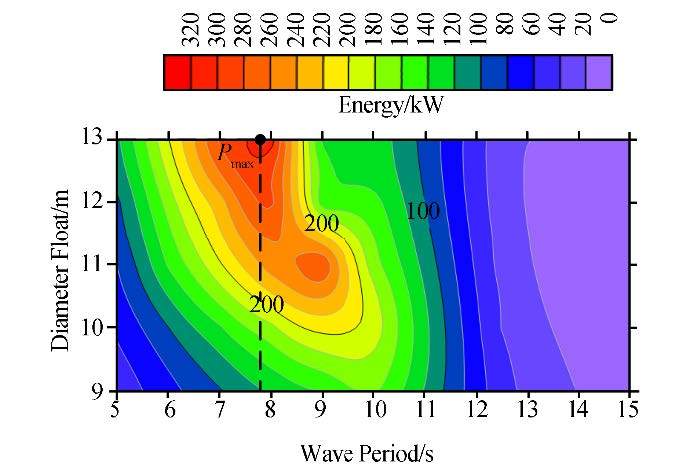
By increasing the diameter, the energy absorption increased due to changes in stiffness and mass; therefore, the peak period inFig. 14 is displaced. In Fig. 15 contour plots express the effect of float diameter on energy absorption.
|
| Fig. 14 Effect of float diameter on absorbed power |
|
| Fig. 15 Contour plots illustrating the effect of float diameter on energy absorption |
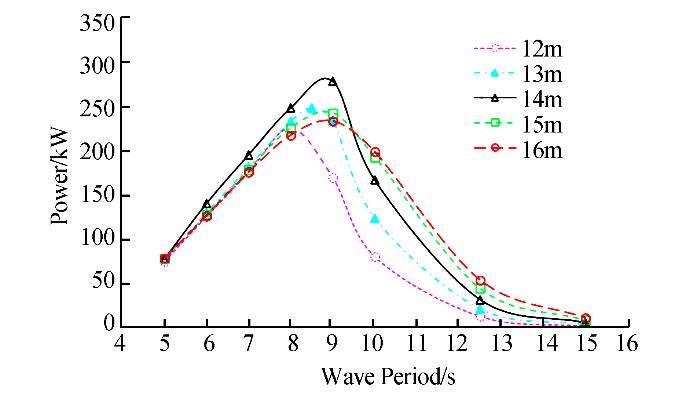
The reaction section is a cylinder with a diameter of 14m, a height of 0.84m, and a draft of 34.97m, which is located at a depth of 35.23m. We used a 2.5-m wave with different periods as the incidental wave and repeated the modeling for the four diameters of 12, 13, 15, and 16m.
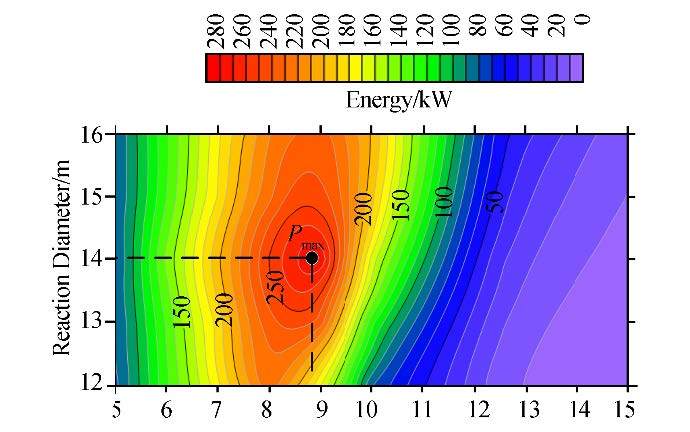
As we see in Fig. 16, the effect of increasing the diameter of the reaction section differsfor the natural period of the device from that outside the range. In the natural period, changing the reaction diameter causes a reduction in energy, since the ratio of 14:0.84 is the optimal ratio for diameter to height. The maximum energy, which is 280 kW, is absorbed in wave period of 9 s. In Fig. 17 contour plots illustrate the effect of reaction diameter on energy absorption.
|
| Fig. 16 Effect of reaction diameter on absorbed power |
|
| Fig. 17 Contour plots illustrating the effect of reaction diameter on energy absorption |
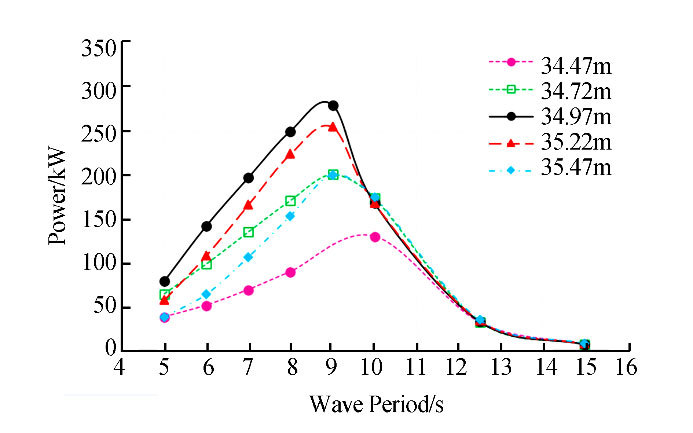
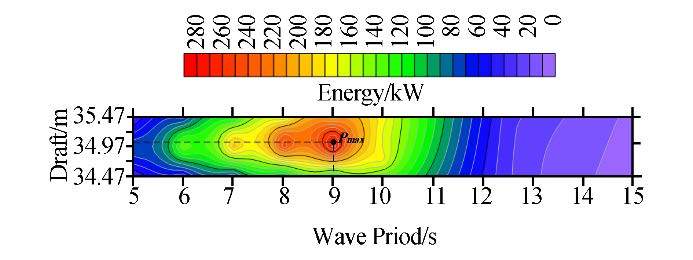
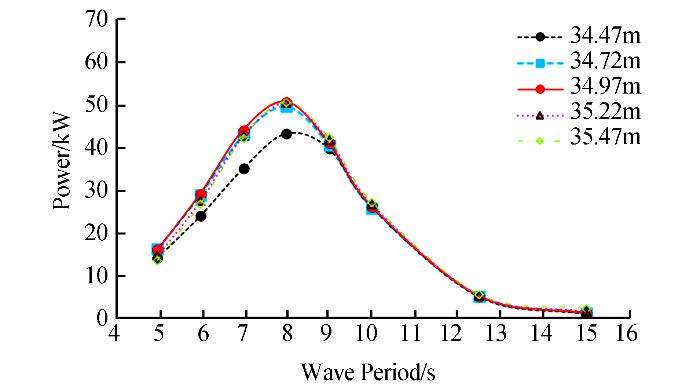
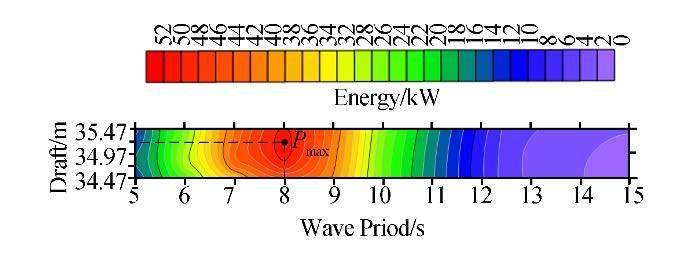
The draft in the original model is 34.97m, and to analyze the effect of this parameter, we compared it with the effects of four other drafts of 34.47, 34.72, 35.22, and 35.47m. The distance between the selected drafts is 25cm, with respect to the geometry and the part submerged in water. Figs. 18-21 show the results for wave heights of 2.5 and 1 m, respectively.
|
| Fig. 18 Effect of draft on absorbed power (H=2.5m) |
|
| Fig. 19 Contour plots illustrating the effect of draft on energy absorption (H=2.5m) |
|
| Fig. 20 Effect of draft on absorbed power (H = 1 m) |
|
| Fig. 21 Contour plots illustrating the effect of draft on energy absorption (H = 1 m) |
The results show that the existing draft is optimized for a 2.5-m wave height, but for lower wave heights, energy absorption is increased by reducing the draft. Based on the results of this study, the best draft can be chosen for each absorber in different environments.
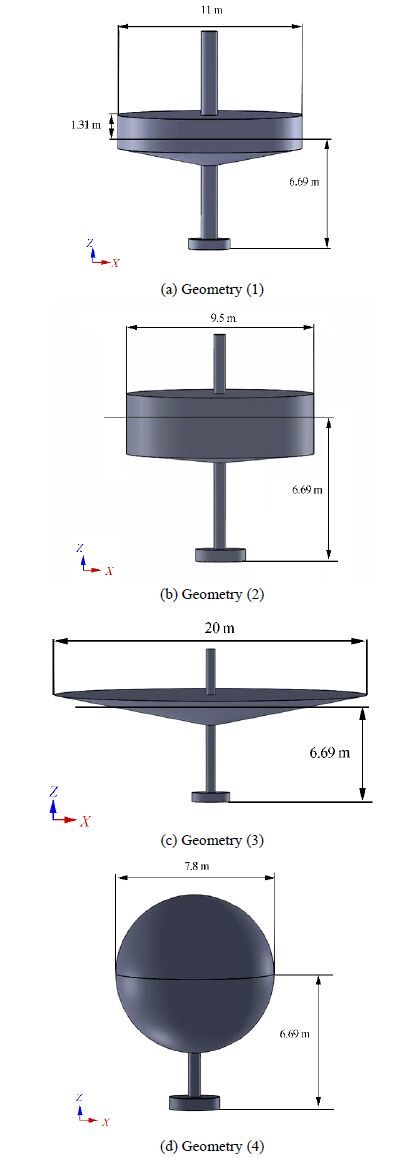
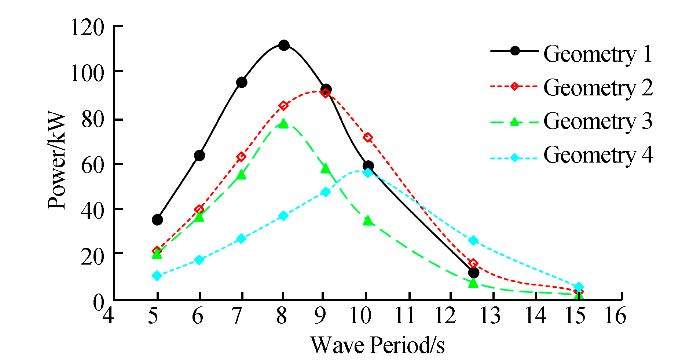
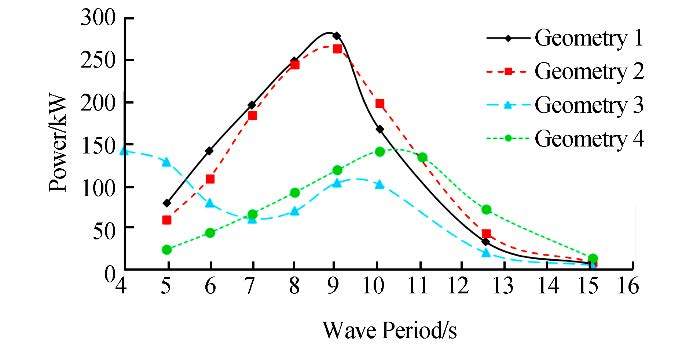
5.6 GeometryIn this section, we investigate the amount of energy absorbed by the point wave absorber by modeling four geometries of equal mass, as shownin Fig. 22. We note that we used geometry (1) for validation and compared its results with those of the other models. The energy absorption of incident wave heights of 1.5m and 2.5m are plotted in Figs. 23 and 24, respectively.
|
| Fig. 22 Four geometries of equal mass used for float section |
|
| Fig. 23 Energy absorbed in each of the geometries (H=1.5m) |
|
| Fig. 24 Energy absorbed in each of the geometries (H=2.5m) |
In the proposed geometries, the absorbent contact surface with the water and the effective height of the floating section in the water are not equal parameters. Geometry (3) has the maximum contact surface and minimum effective height, and Geometry (4) has the reverse. The two other geometries have a combination of these.
The results of Fig. 23 suggest that Geometry (1) yields the most energy with an incident wave of 1.5 m.
The optimal results from Geometry (1) were proved again by radiating an incident wave of 2.5 m. In this condition, the absorption power of Geometries (1) and (2) are almost equal. Also the higher incident wave height for Geometry (3) in Fig. 24 shows irregular energy absorption trends because of the variable cross-section.
6 ConclusionsIn this study, we considered the two-body FPA device to explore the effect of wave height and wave period, along with the device diameter, draft, geometry, and damping coefficient on energy conversion and device efficiency. The results are summarized as follows:
1) When the wave height is decreased, energy absorption increases with increasing wave period, while increasing the height results in the reduction of energy absorption.
2) By studying several damping coefficients, we showed that by increasing the damping coefficient, energy absorption increases.
3) By increasing the float diameter, energy absorption is increased.
4) In the natural period, changing the reaction diameter causes a reduction in energy, since the ratio of 14:0.84 is optimal for diameter to height.
5) In the present study, for wave heights lower than 2.5 m, energy absorption increases when draft is reduced. Based on these results, the optimal draft can be chosen for each absorber in different environments.
6) Of the four proposed geometries with equal masses, we identified the optimal geometry for device performance.
| Alves M, 2011. Wave to Wire Model Implementation. Wave Energy Centre, Portugal, Report, 1-71. |
| Babarit A, Duclos G, Clément AH, 2004. Comparison of latching control strategies for a heaving wave energy device in random sea. Applied Ocean Research, 26, 227-238. DOI: 10.1016/j.apor.2005.05.003 |
| Backer GD, 2009. Hydrodynamic Design Optimization of Wave Energy Converters Consisting of Heaving Point Absorbers.Ghent University, Zwijnaarde, Belgium. |
| Barbarit A, Clement A, 2006. Optimal latching control of a wave energy device in regular and irregular waves.Applied Ocean Research, 28, 77-91. DOI: 10.1016/j.apor.2006.05.002 |
| Beirao P, Malça C, 2014. Design and analysis of buoy geometries for a wave energy converter. International Journal of Energy and Environmental Engineering, 5, 1-11. DOI: 10.1007/s40095-014-0091-7 |
| Bozzi S, Miquel A, Antonini A, Passoni G, Archetti R, 2013.Modeling of a Point Absorber for Energy Conversion in Italian Seas. Energies, 6, 3033-3051. DOI: 10.3390/en6063033 |
| Budal K, Falnes J, 1978. Wave power conversion by point absorbers. Norwegian Maritime Research, 6(4), 2-11 |
| Courtesy of Ocean Power Technologies, 2013.www.power-technology.com. |
| Cruz J, 2008. Ocean Wave Energy:Current Status and Future Perspectives. Springer. |
| Drew B, Plummer AR, Sahinkaya MN, 2009. A review of wave energy converter technology. Proc Inst Mech Eng Part A:J.Power Energy, Sage Publications, London, England, 223, 887-902. DOI: 10.1243/09576509JPE782 |
| Eriksson M, Isberg J, Leijon M, 2005. Hydrodynamic modelling of a direct drive wave energy converter. International Journal of Engineering Science, 43, 1377-1387. DOI: 10.1016/j.ijengsci.2005.05.014 |
| Falcão, A, 2010. Wave energy utilization:A review of the technologies. Renew Sustain Energy, Rev., 14, 899-918. DOI: 10.1016/j.rser.2009.11.003 |
| Falnes J, 1995. Principles for Capture of Energy from Ocean Waves.Phase Control and Optimum Oscilation. Technical Report, Institutt for fysikk, Norway. |
| Falnes J, 2002. Ocean waves and oscillating systems:linear interactions including wave-energy extraction. Cambridge University Press, United Kingdom. |
| Falnes J, 2007. A review of wave-energy extraction. Marine Structures, 20, 185-201. DOI: 10.1016/j.marstruc.2007.09.001 |
| Fusco F, Ringwood J, 2011. Quanti_cation of the prediction requirements in reactive control of wave energy converters.Center for Ocean Energy Research National University of Ireland Maynooth, Ireland. |
| Goggins J, Finnegan W, 2014. Shape optimisation of floating wave energy converters for a specified wave energy spectrum. Renew Energy, 71, 208-220. DOI: 10.1016/j.renene.2014.05.022 |
| Iglesias G, Alvarez M, Garcia P, 2010. Wave Energy Converters, University of Santiago de Compostela, Hydrodynamic Eng.Encyclopedia Of Life and Support Systems(EOLSS), Available online at:www.eolss.net/sample-chapters/c08/E3-08-15. |
| Journée JMJ, Massie WW, 2001. Offshore hydrodynamics. Delft University of Technology. Online course available at:ocw.tudelft.nl Kristiansen E, Hjulstad A, Egeland O, 2005. State-space representation of radiation forces in time-domain vessel models.Ocean Engineering, 32, 2195-2216. |
| McCormick ME, 2013. Ocean wave energy conversion. Courier Corporation. United States, ISBN:9780486318165 |
| Nazari M, Ghassemi H, Ghiasi M, Sayehbani M, 2013. Design of the Point Absorber Wave Energy Converter for Assaluyeh Port n.d. Iranica Journal of Energy & Environment, 4, 130-135. DOI: 10.5829/idosi.ijee.2013.04.02.09 |
| Pastor J, Liu Y, 2014. Frequency and time domain modeling and power output for a heaving point absorber wave energy converter. International Journal of Energy and Environmental Engineering, 5, 1-13. DOI 10.1007/s40095-014-0101-9 |
| Payne GS, Taylor JR, Bruce T, Parkin P, 2008. Assessment of boundary-element method for modelling a free-floating sloped wave energy device. Part 1:Numerical modelling. Ocean Engineering, 35, 333-341. DOI: 10.1016/j.oceaneng.2007.10.006 |
| Taghipour R, Perez T, Moan T, 2008. Hybrid frequency-time domain models for dynamic response analysis of marine structures. Ocean Engineering, 35, 685-705. DOI: 10.1016/j.oceaneng.2007.11.002 |
| Techet AH, 2005. Design principles for ocean vehicles Massachusetts Institute of Technology, Department of Ocean Engineering. Online MIT university course available at:http://web.mit.edu/13.42/www/. |
| Yu YH, Li Y, 2013. Reynolds-Averaged Navier-Stokes simulation of the heave performance of a two-body floating-point absorber wave energy system. Computer & Fluids, 73, 104-114. DOI: 10.1016/j.compfluid.2012.10.007 |


