The deep-sea areas are becoming very important for petroleum industries and technology innovations(Chen, 2011). Due to its obvious advantages in the development of deepwater oil and gas fields, the subsea production system has been applied as an important part in the oilfield development system. Many research projects have been conducted for the subsea production system. Ju et al.(2014)calculated the process piping stress of the subsea dynamic riser base(SDRB) and proved that the jacket pipe and the carrier pipe stress of the SDRB process piping satisfy the DNV st and ards as a whole. In consideration of economic issues and security problems, the installation of underwater structures such as FJ needs special attention in the oil and gas field development project(Cone, 1963). Therefore, the research about underwater structures installation method has very important value for engineering projects.
Because of its broad applications in deepwater projects, many research projects about flowline jumper(FJ)or other subsea pipes have been conducted. These studies can be divided into two aspects: in-place strength or fatigue analysis and FJ design and installation analysis. At present, most research projects focus on the first aspect. Wang(2013)studied the design procedure of subsea rigid jumper system. His research also included strength and fatigue analysis of subsea rigid jumper. A methodology based on DNV-RP-F105 is designed to evaluate fatigue damage caused by vortex induced vibration(VIV). Zhou et al.(2005)presented a new method for nonlinear static finite element stress analysis of the PIP riser system, different elements are used so as to model the system accurately. Wang et al.(2009a)used a finite element analysis program to simulate the span response of a flowline under complex boundary and loading conditions, both VIV and direct wave loading were captured in his work. On the basis of the Hamilton principle, Ai and Sun(2009)derived a differential equation to describe the motion of a pinned-pinned tensioned spanning pipeline and calculated its VIV response according to DNV-RP-F105. Bakkouch(2013)analyzed the FJ slugging problem. Also, with the use of computational multiphase fluid dynamic(CMFD), he investigated the main flow features that accompany with slug flow in a FJ. Ma et al.(2013)did some analysis about the ultimate bearing capacity of the FJ structure. Additionally, it was pointed out that the component of axial compressed displacement was the major factor that caused ultimate failure of the jumper structure. Zhang et al.(2013)analyzed the failure reason of submarine pipeline according to physical and chemical testing. He et al.(2012b)studied the influence factors of the FJ design and presented the method to choose design parameters with the purpose of offering reference for the optimization design of deepwater FJ. Wang(2013)presented a design procedure for subsea rigid jumper system, including strength and fatigue analysis. Special attention is given to a methodology based on DNV-RP-F105 to evaluate jumper fatigue damage caused by vortex induced vibration. Ma et al.(2014)used a combined numerical method of computational structural dynamics and CFD to solve the fluid structure interaction problems and the internal multi-phase flow induced vibrations of an inverted U-shaped subsea jumper were analyzed. Based on incremental finite element method, Ma(2012)analyzed the effects of different displacement loadings and cracks acting on the FJ. Some conclusions about the change law of ultimate bearing capacity and the characteristics of failure modes of the jumper with circumferential cracks were determined. Based on leak detection criteria(LDC), Zhang et al.(2009)presented a quantitative risk assessment(QRA)method for the design of a proposed subsea oil export pipeline. Liu et al.(2013)presented a new axial force analysis method of high-temperature subsea pipe-in-pipe based on the shear lag theory. The maximum axial force of subsea pipe-in-pipe is calculated by this method, and the axial force distribution of subsea pipe-in-pipe is obtained.
Besides these strength and fatigue analyses, some progresses were also made in the studies of installation analysis. Li et al.(2008)introduced the latest deepwater pipeline laying technology and pipe laying barges of the renowned companies and the corresponding comparison. De Réals et al.(2003)did some research based on the Canyon Express project, and it was found that the support of flow meter weight was one of the main challenges in FJ installation. Zhang and Duan(2013)presented an approach and procedures that can be used to repair the large range pipeline leaks. According to the basic principle of vibration mechanics, Wang et al.(2014a)established the riser mechanical model to analyze its axial dynamic characteristics during installation. After this, a dynamic analysis model was established to analyze lateral vibration of marine riser in installation as well as discuss the maximum lateral vibration displacement variations with WD, riser size, BOPS/LMRP, wave height and wave period(Wang et al., 2015). Besides, Wang et al.(2014b)established a static analysis model and equation to analyze riser stress and deformation in its installation. Xie et al.(2015)built a 3D finite element model to simulate the process of the pipe sliding from the pipe lay vessel to the seabed and obtained the plastic deformation and final quality of the pipe after it was installed to the seabed. Jiao et al.(2013)used causality analysis to analyze cause of quality problems during pipe lay and the quality control points in the technique process were described in view of these questions. Guo et al.(2014)provided a general introduction of pipeline installation design codes and various lay methods commonly used by the industry.
The review of relative literatures shows that the research projects on FJ installation methods are limited. Considering that the research on deepwater FJ installation in China is still in the primary stage, this paper develops an installation methodology for deepwater FJ. Further analysis of FJ installation is made based on finite element models of FJ installation system. There are three sections in this paper: First, different kinds of deep water FJ are introduced. In this part, a general introduction about FJ is made and there is a comparison that presents the advantages and disadvantages of three common FJ types. In the second part of this paper, a typical installation procedure for FJ is developed and the main installations steps are described with the help of figures. In the last part, with the purpose of validating the installation method, numerical models are built to demonstrate the feasibility and validity of the installation steps. Further researches about FJ installation strength and the capability of installation equipment are also presented.
2 FJ descriptionsIn subsea oil and gas production systems, FJ is a short tubular connecting component and it is mainly used to transfer oil between the oil tree and manifold. In addition to the oil transportation, the FJ can also be used to inject water and gas into oil wells.
There are several configurations of rigid jumper that have been used in production. Generally, they are described and categorized by the orientations or types of connections. A typical FJ has terminal connectors in both sides. FJ can be divided into Rigid FJ and flexible FJ due to the difference in material character. Also, if the tube is rigid, the FJ is called rigid FJ and the FJ with flexible tube is named as flexible FJ(Zhang and Xie, 2011). Based on their different geometries, the rigid FJ includes M-shaped, inverted U-shaped, Z-shaped and non-regular three-dimensional cross-over, etc.(Wang et al., 2009b).
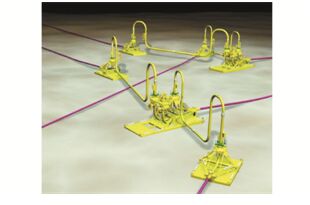
Most of the free st and ing hybrid risers select M-shaped rigid FJ with the vertical connector ends, which is shown in Fig. 1. Different shapes of the FJ also vary greatly in dimensions. The height of an M-shaped riser base FJ is 15-25 m, with a length of 25-60 m(Yang et al., 2014).
|
| Fig. 1 Illustration of deepwater jumper |
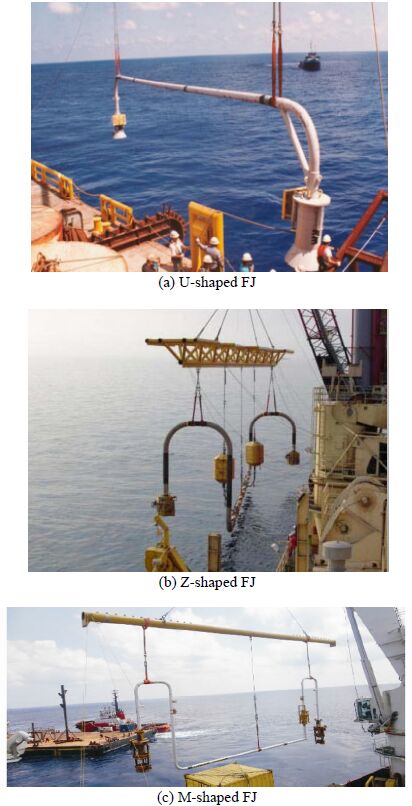
One of the most typical rigid jumpers used in the subsea flowline system is of the upside down U configuration. This type has vertically oriented hubs(located on the subsea structures), usually a collet or torus type connector(located on the jumper), and a straight run of pipe between the bends, as depicted in Fig. 2(a). The size of the U-shaped FJ is generally determined by the jumper orientation, pipeline expansion, connector misalignment requirements, sag and other forces. If the jumper needs additional flexibility, additional bends may be placed between the hubs(He et al., 2012a).
|
| Fig. 2 Typical rigid jumper |
Another type of FJ commonly used nowadays is the M-shaped configuration jumper, as illustrated in Fig. 2(c). In general, FJ is a 2D plane structure. But, 3D jumper(Z-shaped), as shown in Fig. 2(b), may be adopted depending on the loads and expansion transferred from flowlines.
Table 1 summarizes the advantages and disadvantages of three kinds of the FJ geometry(Plouzennec et al., 2011)
| Types | Advantages | Disadvantages |
| M | Simple concept; Reliable strength and response | Fatigue sensitive; Dem and ing higher quality welds; VIV damage might be great; High load on connector |
| Z | Greater flexible; Reliable response intensity; Easy to adapt to the angle of the end | Fatigue sensitive; Dem and ing higher quality welds; VIV damage might be great |
| U | Long fatigue life; Simple design | Problems in manufacturing and installation; Higher load on connector; No proof of its reliability; VIV damage cannot be eliminated |
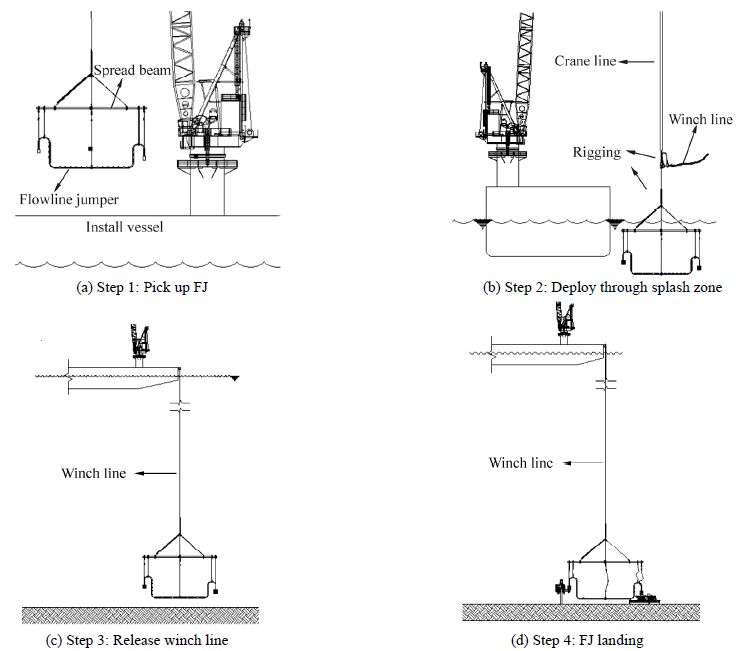
The following methodology is developed for the installation of the deepwater FJ with primary steps illustrated by Fig. 3.
|
| Fig. 3 Installation steps of FJ |
Step 1: Use installation vessel crane to pick up the FJ from the vessel as illustrated in Fig. 3(a). First, the spreader beam is connected to the installation vessel crane with the locks and traction line equipment, then the FJ is connected with the spreader beam by riggings. Next, the crane lifts the spreader beam from the operation deck and then the FJ is picked up by the spreader beam and riggings. In this step, it should be noted that controlling the FJ pick-up speed as required is extremely important.
Step 2: Overboard the FJ and release the crane line until the FJ passes through the splash zone, as illustrated in Fig. 3(b). After that, operate the crane to move the FJ to the outside of the vessel and then transfer it through the splash zone at a certain speed. Later on, connect the winch line with FJ locks, regulate the FJ and continue the installation. Finally, in the depths of about 150 m, the load will be transferred to the winch line and the crane line will be cut with the help of ROV and then recover it.
Step 3: Release the winch line until FJ is about 1.8 m above seabed and make alignment of the connectors as illustrated in Fig. 3(c). When the FJ is approaching 1.8 meters away from the sea floor, use the ROV to monitor its location, direction and depth. Lastly, control installation vessel to move FJ just above the vertical position of underwater structures.
Step 4: Connect the FJ with the manifold or other connection terminals, as illustrated in Fig. 3(d). Then using the winch line and ROV to control the direction of the FJ and make sure the connector keep alignment with the connection terminal. Afterwards, the ROV locates the connector to the terminal and completes the installation and sealing work.
4 Installation analysis of M-shaped jumper 4.1 General description of FJ installation systemThe main purposes of the analysis of FJ installation are to prove the feasibility of the installation of the FJ plan and the research of FJ stress characters during the installation process. In order to keep the applicability of analysis result, a typical M-shaped FJ is chosen to carry out the installation analysis.
The components of the FJ installation system contain: FJ, installation vessel, crane, winch, spreader beam, riggings, ROV, etc. In this paper, the ROV is not modeled in this analysis. The winch and the crane are lifting equipment in the installation vessel and the relationship between other components will be introduced in the flowing.
For the installation vessel, low frequency(LF)motions such as the slow drift motion due to waves and the driven motion induced by vessel thrusters are not considered in the simulation and the installation vessel is modeled as a simple steady(e.g. moored)vessel whose motion is on account of the first order wave effects only.
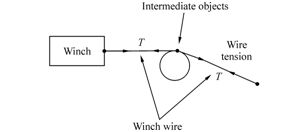
The winch and the crane are treated in a simply way, i.e., only the winch line(crane line)is modeled, as shown in Fig. 4. The “T” in Fig. 4 st and s for the wire tension. It is assumed that the winch inertia is negligible and the winch drive is perfect, so that it always exactly achieves the requested constant tension or constant speed. The FJ model and installation vessel are connected by a winch wire(or crane line). As well as connecting its two end points, the winch wire passes through intermediate points, in which case it does so as if passing over a small frictionless pulley at that point. The wire tension on either side of the intermediate point is then applied to that point.
|
| Fig. 4 Winch model |
The riggings are modeled as simple spring connections linking two points in the model, for example a node on an FJ to a node on spreader beam. They pull the two points with a force that depends on their relative positions and velocities. Riggings have no mass or hydrodynamic loading and simply apply an equal and opposite force to the two points.
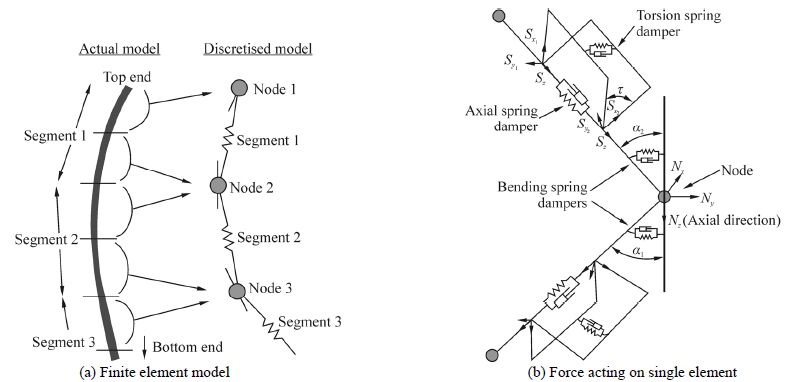
The FJ and the spreader beam are simulated as finite element models as shown in Fig. 5(a). The model is divided into a series of line segments, which are then models by straight massless model segments with a node at each end. The model segments only modeled the axial and torsional properties of the line, while the other properties(mass, weight, buoyancy etc.)are all lumped to the nodes, as indicated by the arrows in Fig. 5(b).
|
| Fig. 5 Finite element model of FJ and spreader beam |
Fig. 6 shows the configuration of M-shaped FJ, which contains the basic dimensions and its position near the seabed.

|
| Fig. 6 Configuration of FJ |
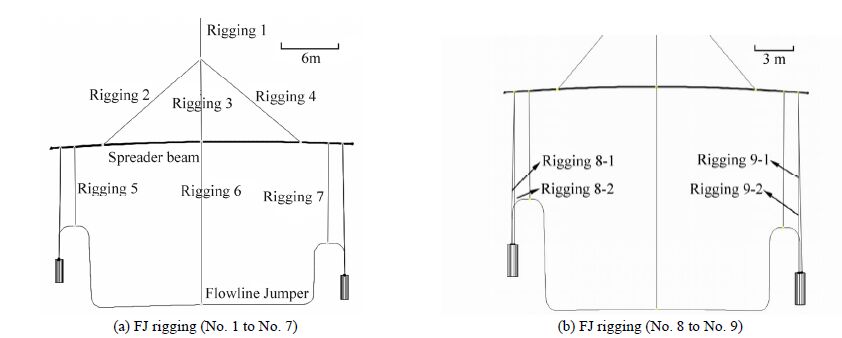
Table 2 gives the cross section parameters of FJ used in the following analysis. Fig. 7 is the FJ installation numerical model in OrcaFlex, illustrating the relationships among the FJ, spread beam and the riggings. Table 3 presents the length and stiffness of riggings used in FJ installation.
| mm | ||
| Out diameter | Wall thickness | Corrosion allowance |
| 168.3 | 15.9 | 3.0 |
|
| Fig. 7 FJ model in Orcaflex |
| NO. | Descriptions | Length/m | Stiffness/kN |
| #1 | Rigging overhead spreader beam | 6.0 | 2.43E5 |
| #2 | Slant rigging on spreader beam-connector #1 side | 13.83 | 1.32E5 |
| #3 | Slant rigging on spreader beam-middle | 9.0 | 5.15E4 |
| #4 | Slant rigging on spreader beam-connector #2 side | 13.83 | 1.32E5 |
| #5 | RBJ rigging-connector #1 side | 8.5 | 6.86E4 |
| #6 | RBJ rigging-middle | 17.2 | 2.94E4 |
| #7 | RBJ rigging-connect or #2 side | 10.65 | 6.86E4 |
| #8 | Connector Rigging-connector #1 side | 12.0 | 3.18E4 |
| #9 | Connector Rigging-connector #2 side | 14.2 | 3.18E4 |
In order to validate the feasibility of this installation method and investigate the structure strength, numerical models are built in Orcaflex, as shown in Fig. 8. Based on these, the installation analysis of the jumper has been carried out under the particular environmental conditions. As can be seen in the Fig. 8, the first three steps of the whole installation process are simulated. These three steps are described in the following.

|
| Fig. 8 Installation steps in numerical model |
1)Pick up FJ from the installation vessel
In this stage, the dynamic process of the crane lifting the FJ and the spreader beam are simulated under different sea conditions. In addition, wave directions and pick up speed are changed to do the sensitive analysis. And the vessel motion is calculated through the wave conditions and displacement RAO.
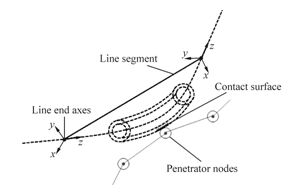
The collision-sensitive analysis for the FJ is carried out in this section. The parameters taken into consideration are the pickup speed and the wave directions. Line contact models are defined to model the collisions that happen between the FJ and other equipments, as shown in Fig. 9. The contact is modeled by attaching penetrators to some or all of the nodes of the lines. When the contact occurs between one of these penetrators and the contact surface, the force and moment are applied to the penetrator, which transfers those loads to the line node to which it is attached. Equal and opposite load is also applied to the contact surface and that load is transferred to the nodes at either end of the line segment.
|
| Fig. 9 The line contact model |
In this step, the rigid structural stress is calculated and checked during the process of the crane lifting the FJ from the installation vessel. The crane lifting force ability is also assessed to see whether it meets the dem and .
2)FJ passes through the splash zone.
This step needs to model the dynamic processes of the rigid FJ falling into the water, and the effect of the wave and slamming is also taken into consideration. Besides, this step also needs to build the FJ finite element model in the splash zone, and apply appropriate load calculation, then analyze the rigid FJ structure strength and the lifting force provided by the crane.
Fig. 10 shows the calculation method of the hydrostatic and hydrodynamic forces in the splash zone. As mentioned above, lines are subdivided into segments and the various forces are attributed to nodes at each end. For a partially submerged segment, the hydrostatic and hydrodynamic forces are proportioned depending on magnitude of the segment submerged. For a segment whose axis is normal to the surface, the proportion wet could be calculated from the intersection of the segment centerline axis with the free surface. However, this simple approach breaks down when the segment is tangent to the surface. For this reason, a simple but effective modification of this concept is carried out. Instead of using the centerline axis, the diagonal line is used to join the highest point on the segment circumference, at the “dry” end, with the lowest point at the “wet” end. It is shown in the diagonal line in Fig. 10. As the segment passes through the tangent position, the diagonal line switches corners but the proportion wet varies continuously. The intersection of the diagonal line with the surface continues to give the appropriate proportion wet result and the hydrostatic and dynamic forces are attributed to the appropriate node.

|
| Fig. 10 Proportion wet for a surface-piercing segment |
3)L and ing progress of FJ.
The main purpose of this step is to check the load provided by the winch when the FJ reaches maximum depth(1.8 meters from the sea bed). The added mass and drag force of the FJ and the weight of the winch line are all needed to be taken into consideration in the analysis. During this stage, the FJ installation speed is kept at 0.45 m/s. Moreover, the structure strength of FJ is researched in this process and environmental loads from different directions are calculated.
4.2.2 Environmental conditionsThe FJ is designed for the application in the South China Sea and the water depth of operation is 1 500 m. The sea condition is chosen to be relatively mild for the FJ installation work. The significant wave height is 1.0 m with the wave period 7.5 s. The current velocity of the water surface is 1.05 m/s and the underwater current velocities are given in Table 4.
| Water depth/m | Current velocity/(m·s−1) |
| 5 | 0.97 |
| 100 | 0.78 |
| 250 | 0.75 |
| 500 | 0.52 |
| 750 | 0.36 |
| 1 000 | 0.31 |
| 1 500 | 0.27 |
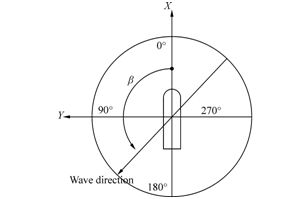
During the analysis, the environmental load directions also change from 0° to 180° with an interval of 45°, as shown in Fig. 11.
|
| Fig. 11 Wave directions |
The static analysis without considering the waves and currents effect is carried out and the results of the crane and winch force during the installation process are listed in the Table 5. In addition, Table 6 also showed sling static tensions in different steps. The numbers and positions of riggings can be seen in Fig. 7.
| Operating steps | Crane line/kN | Winch line/kN |
| Pick-up | 162.1 | — |
| Pass the splash zone | 162.1 | — |
| L and ing | — | 385.2 |
The main purpose of the static analysis is to get the initial tensions in the crane line and riggings and these static tensions can be very important for the design in dynamic analysis. According to the crane tension and the winch tension in Table 5, it can be deduced that the force provided by crane should be bigger than 162.1 kN and the winch capability should be larger than 385.2 kN.
It can also be seen from Table 6 that number 1/ number 2/ number 4 riggings endure bigger tensions in these steps and this should be considered in the installation plan.
| kN | |||
| Rigging No. | Step 1 | Step 2 | Step 3 |
| 1 | 162.1 | 162.1 | 90.7 |
| 2 | 111.6 | 111.6 | 49.6 |
| 3 | 19.1 | 19.1 | 27.0 |
| 4 | 107.9 | 107.9 | 48.0 |
| 5 | 12.2 | 12.2 | 0 |
| 6 | 30.4 | 30.4 | 0 |
| 7 | 11.0 | 11.0 | 0 |
| 8 | 16.3 | 16.3 | 10.8 |
| 9 | 16.0 | 16.0 | 10.4 |
In this stage, the FJ is picked up from the installation vessel’s deck. During this process, collisions often happen between the FJ and the spreader beam, which should be avoided during the installation. So the contact characters of the FJ and the spreader beam will be modeled in the time domain analysis in order to see if there exist contact forces.
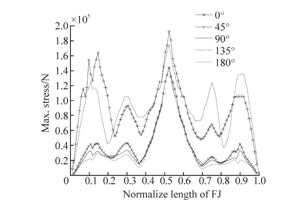
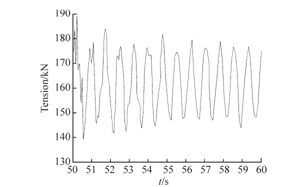
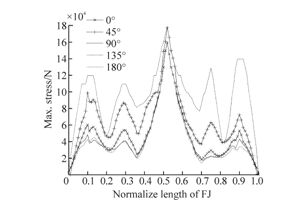
In order to get the key factors that should be controlled to avoid the FJ collision, the sensitive analysis is made. The two different lifting speeds are considered in the pickup condition, 0.10 m/s and 0.20 m/s and the wave load directions also change from 0° to 180° with an interval of 45°. Table 7 and Table 8 show the installation analysis results at two pickup speeds separately. Fig. 12 and Fig. 14 show the maximum FJ Von-Mises stress distribution in the corresponding installation speed, while Fig. 13 and Fig. 15 present the crane lifting force under different pickup speeds.
| (0.1 m/s) | ||||
| Wave dir/(°) | Max. stress of FJ/MPa | Max. tension of crane line/kN | Min. tension of crane line/kN | FJ collision |
| 0 | 149.4 | 189.3 | 138.5 | Yes |
| 45 | 197.5 | 211.5 | 116.4 | Yes |
| 90 | 149.8 | 193.4 | 138.5 | No |
| 135 | 183.0 | 205.3 | 129.1 | No |
| 180 | 149.8 | 180.9 | 139.1 | Yes |
| (0.1 m/s) | ||||
| Wave dir/(°) | Max. stress of FJ/MPa | Max. tension of crane line/kN | Min. tension of crane line/kN | FJ collision |
| 0 | 159.9 | 205.7 | 117.2 | No |
| 45 | 204.9 | 238.2 | 135.1 | No |
| 90 | 160.6 | 215.4 | 117.5 | No |
| 135 | 180.6 | 230.8 | 133.2 | No |
| 180 | 160.5 | 202.1 | 118.6 | No |
|
| Fig. 12 Max.Von-Mises stress distribution of FJ(0.1 m/s) |
|
| Fig. 13 ension of crane line(speed: 0.1 m/s; wave: 0°) |
|
| Fig. 14 Max. Von-Mises stress distribution of FJ(0.2 m/s) |

|
| Fig. 15 Tension of crane line(speed: 0.2 m/s; wave: 0°) |
It can be seen from the results presented by Fig. 12 and Fig. 14 that the maximum stress of the FJ always happens at central position of the jumper where the FJ connects with the sling. When the environment load comes from the direction of 45° and 135°, the FJ Von Mises stress reaches a maximum value, and the tension of the Crane line also reaches a relative high value. So the conclusion that can be got from these results is that the operation vessel should be kept at the head wave direction rather than the oblique wave direction, in order to minimize the stress in the FJ and the tension in crane line.
The Von Mises stress(204.9 MPa)occurs when the lifting speed is 0.2 m/s, it is less than the allowable stress values 300.16 MPa. It can be concluded that the FJ stress meets the strength requirements, and on the other h and , the installation method of this stage is feasible. Under the same environmental condition, the maximum tension in the crane line is 238.2 kN, which means the crane capability should be bigger than 238.2 kN.
In addition, the collision-sensitive analysis results can be seen in Table 7 and Table 8. When the pick up speed stays at 0.1 m/s, there will be a great possibility of the FJ collision, while if the speed rises to 0.2 m/s, the collision will not happen in all these wave directions, as the Table 8 shows. So it is necessary to set the pick up speed at a proper value, in order to avoid collision in installation process. But on the other h and , the bigger pick up speed means the larger tension in the crane line and the higher dem and to the equipment. Regardless of the pick-up speed of the FJ, there is another solution to avoid collision—using some temporary locks to control the horizontal movement of the FJ.
4.3.3 Dynamic analysis results of FJ passing through splash zone
During the FJ crossing the splash zone, the releasing speed of the crane line is set to 0.1 m/s. The pre-set distance of the FJ from the installation vessel starboard is 18.28 m, so the crane radius is adjusted to 23.34 m.
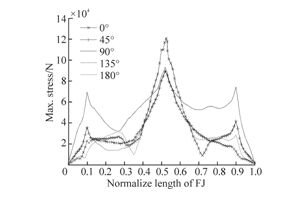
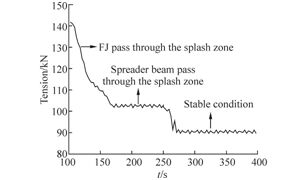
Table 9 shows the results of the installation analysis under different wave directions, the max stress of FJ, and the maximum and minimum tension of the crane line. Fig. 16 gives the maximum Von-Mises stress distribution along the FJ and Fig. 17 shows the changing process of crane line force under environmental loads from 0 °.
|
| Fig. 16 Max. Von-Mises stress distribution of FJ during passing through splash zone |
|
| Fig. 17 Tension of crane line(wave: 0°) |
As can be seen in Table 9 and Fig. 16, the maximum Von Mises stress of FJ still happens at the central position of the jumper where FJ connects with the sling. In this step, the maximum stress of the FJ occurs when wave loads act in the 0° direction and 180° direction. Besides, it can be obtained from Fig. 17 that the tension of crane line decreases with the release of crane line length: at the beginning of this stage, the maximum tension of crane line is about 146.5 kN. However, when the FJ is submerged into the water, the maximum tension falls to 104.7 kN. But at the end of this stage, when the whole system is submerged, the maximum tension of the crane decreases to 91.3 kN.
| Wave dir/(°) | Release speed: 0.1 m/s | ||
| Max. stress of FJ/MPa | Max. tension of crane line/kN | Min. tension of crane line/kN | |
| 0 | 119.8 | 91.3 | 89.5 |
| 45 | 90.2 | 91.9 | 87.7 |
| 90 | 93.5 | 99.9 | 79.7 |
| 135 | 91.2 | 91.9 | 87.6 |
| 180 | 119.1 | 90.8 | 90.3 |
The aim of the l and ing stage is to investigate the dynamic response of the FJ installation system when it reaches the maximum depth—the bottom of the FJ is about 1.8 m from the sea bed. Before reaching the lowest point, the FJ releasing speed is limited at 0.45 m/s.
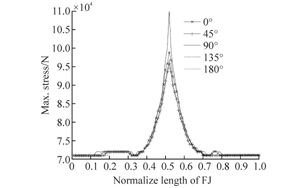
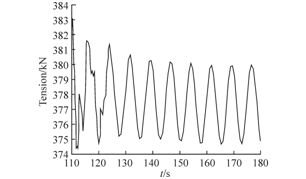
The Table 10 shows the analysis results of the dynamic step with 5 different wave directions. Fig. 18 illustrates the maximum Von-Mises stress distribution of the FJ in the corresponding wave directions. Fig. 19 presents winch tension in time domain, under the wave load from 0° direction.
| Wave dir/(°) | Release speed: 0.45 m/s | ||
| Max. stress of FJ/MPa | Max. tension of winch line/kN | Min. tension of winch line/kN | |
| 0 | 99.5 | 383.1 | 374.3 |
| 45 | 96.3 | 385.2 | 372.3 |
| 90 | 105.9 | 408.2 | 351.2 |
| 135 | 96.8 | 389.1 | 369.3 |
| 180 | 95.3 | 382.4 | 374.4 |
|
| Fig. 18 Max. Von-Mises stress distribution of FJ in l and ing stage |
|
| Fig. 19 Tension of winch line(wave: 0°) |
It can be seen from results that the maximum stress is also in the central area of the FJ where it connects with the rigging. The FJ maximum Von Mises stress(105.9 MPa)occurs when waves come from the direction of 90°, with the allowable stress value being 300.16 MPa. The results validate the installation method in this stage. It can also be obtained from Table 10 that the winch maximum capability shall be larger than 408.2 kN.
5 ConclusionsIn this paper, an installation methodology for deepwater FJ is developed and numerical models are built up to investigate the characters of the FJ stress and the equipment line tension during the installation. Some conclusions are obtained:
1)The analysis results of the FJ structural strength and crane line tensions show that the installation steps designed for the deep water FJ are feasible and valid.
2)During the installation, the maximum stress of the FJ always happens at its central position where the FJ connects with the sling. Therefore, some protection devices should be adopted during the installation in order to minimize the FJ maximum stress.
3)In the pick-up stage, collisions of the FJ with other equipment have great relationship with the pick up speed and the wave load directions. FJ collisions will occur if the pick up speed of the FJ is not suitable or installation vessel heading is in an inappropriate direction. So in this stage, the determination of the installation parameters should be based on the sufficientcollision sensitive analysis. Another solution to the FJ collision is using some temporary locks to control the horizontal movement of the FJ. However, this will make the installation system more cumbersome.
4)Basic requirements for the crane power and the winch capability should be obtained through the analysis of the FJ installation procedure. However, different combinations of the environmental loads and installation design parameters should be considered in the analysis as well.
5)The deployment speed and wave directions relative to the installation vessel play key roles in the FJ stress and other equipment loads. In order to minimize the FJ stress and maintain the installation system at a good condition, numerical simulations should be carried out to obtain the best environmental loads direction and the deployment speed for each installation stage.
AcknowledgementThe work reported in this paper is carried out during the sub-project of National Major Scientific and Technological Special Project “Numerical Simulation and Experimental Investigation of FPSO and Offloading System(2011ZX05030-006-002)” and supported by China National Offshore Oil Corp.(CNOOC)Research Center.
| Ai Shangmao, Sun Liping (2009). The effect of functional loads on free spanning pipeline's VIV response. Journal of Marine Science and Application, 8(2), 151-155. DOI: 10.1007/s11804-009-8108-y |
| Bakkouch M (2013). Riser base jumper slugging analysis by CFD simulations. International Conference on Ocean, Offshore and Arctic Engineering, Nantes, France, 2013-11335. |
| Chen Wei (2011). Status and challenges of Chinese deepwater oil and gas development. Journal of Petroleum Science and Technology, 8(4), 477-484. DOI: 10.1007/s12182-011-0171-8 |
| Cone CD (1963). The aerodynamic design of wings with cambered span having minimum induced drag. Langley Research Center, Hampton, United States, NASA Technical Report No. TR R-152. |
| De Réals TB, Lomenech H, Nogueira AC, Stearns JP, Ferroni L (2003). Canyon express flowline system: Design and installation. Offshore Technology Conference, Houston, 15096. |
| Guo Boyun, Song Shanhong, Ghalambor A, Lin TR (2014). Offshore pipelines: design, installation, and maintenance. 2nd ed., Gulf Professional Publishing, Houston, 135-146. |
| He Tong, Li Tingting, Duan Menglan, Li Liwei, Dong Na (2012a). Key issues of deep water hybrid riser base jumper design. Oil Field Equipment, 41(10), 14-19. (in Chinese) |
| He Tong, Li Tingting, Duan Menglan, Li Liwei, Dong Nan, Cao Jing (2012b). Analysis of primary influence factors for deep-water rigid jumper design. China Offshore Platform, 27(4), 50-56. (in Chinese) |
| Li Zhigang, Wang Cong, He Ning, Zhao Dongyan (2008). An overview of deepwater pipeline laying technology. China Ocean Engineering, 22(3), 521-532. |
| Liu Xiaoxia, Jia Xu, Zou Xing (2013). An axial force analysis of high-temperature subsea pipe-in-pipe. Pipeline Technique and Equipment, 4, 1-3. (in Chinese) |
| Jiao Dongmei, Yu Wentai, Du Yongjun, Han Xu (2013). Quality control of laying subsea pipe by S-Lay mode. China Offshore Platform, 28(3), 23-26. (in Chinese) |
| Ju Xuanze, Fang Wei, Yin Hanjun, Jiang Ying (2014). Stress analysis of the subsea dynamic riser base process piping. Journal of Marine Science and Application, 13(3), 327-332. DOI: 10.1007/s11804-014-1264-8 |
| Ma Yacheng, Tang Wenyong, Wang Jin (2014). On the numerical simulation methods of internal multiphase flow-induced vibration in subsea rigid jumper. Ship & Ocean Engineering, 43(4), 96-100. (in Chinese) |
| Ma Zengji (2012). The analysis and research on ultimate strength of the rigid jumper in subsea production facility. Master thesis, Shanghai Jiao Tong University, Shanghai, 42. (in Chinese) |
| Ma Zengji, Tang Wenyong, Xue Hongxiang (2013). Ultimate strength analysis of a jumper in subsea production facility. The Ocean Engineering, 31(1), 9-15. (in Chinese) DOI: 10.3963/j.issn.1671-7953.2014.04.023 |
| Plouzennec S, Sonawane M, Eyles T (2011). New approaches to the design of rigid jumpers for freestanding hybrid risers. Rio Pipeline Conference & Exposition, Rio de Janeiro, IBP1708-11. |
| Wang J, Wang FS, Duan G, Jukes P (2009a). VIV analysis of pipelines under complex Span conditions. Journal of Marine Science and Application, 8(2), 105-109. DOI: 10.1007/s11804-009-8109-x |
| Wang Jun (2013). Subsea rigid jumper design and VIV fatigue evaluation. Engineering Sciences, 11(4), 67-71. |
| Wang Wei, Sun Liping, Bai Yong (2009b). Investigation on subsea production systems. China Offshore Platform, 24(6), 41-45. (in Chinese) |
| Wang Yanbin, Gao Deli, Fang Jun (2014a). Axial dynamic analysis of marine riser in installation. Journal of Natural Gas Science and Engineering, 21, 112-117. DOI: 10.1016/j.jngse.2014.07.031 |
| Wang Yanbin, Gao Deli, Fang Jun (2014b). Static analysis of deep-water marine riser subjected to both axial and lateral forces in its installation. Journal of Natural Gas Science and Engineering, 19, 84-90. DOI: 10.1016/j.jngse.2014.04.019 |
| Wang Yanbin, Gao Deli, Fang Jun (2015). Study on lateral vibration analysis of marine riser in installation-via variational approach. Journal of Natural Gas Science and Engineering, 22, 523-529. DOI: 10.1016/j.jngse.2014.12.012 |
| Xie Peng, Zhao Yan, Yue Qianjin, Palmer AC (2015). Dynamic loading history and collapse analysis of the pipe during deepwater S-lay operation. Marine Structures, 40, 183-192. DOI: 10.1016/j.marstruc.2014.11.003 |
| Yang Hu, Li Xu, He Ning, Feng Xianhong (2014). Parametric study for sensitivity analysis of M shape subsea jumper. Ship Science and Technology, 36(3), 125-130. (in Chinese) |
| Zhang Fangyuan, Bai Yong, Badaruddin MF, Tuty S (2009). Quantitative risk assessment & leak detection criteria for a subsea oil export pipeline. Journal of Marine Science and Application, 8(2), 168-174. DOI: 10.1007/s11804-009-8116-y |
| Zhang Guoli, Qin Lifeng, Zhang Zhi, Hu Xuyan (2013). Failure analysis of some submarine pipeline. Journal of Xi'an Shiyou University (Natural Science Edition), 28(1), 98-101. (in Chinese) |
| Zhang Jin, Xie Yi (2011). Research and development of subsea manifold installation methods. The Ocean Engineering, 29(1), 143-148. (in Chinese) |
| Zhang Xinhu, Duan Menglan (2013). Research on the replacement repair technology of jumper on subsea pipeline. Society for Underwater Technology Technical Conference, Shanghai, China. |
| Zhou Hongjie, Yan Shuwang, Cui Wei (2005). Nonlinear static finite element stress analysis of pipe-in-pipe risers. China Ocean Engineering, 19(1), 155-166. |


