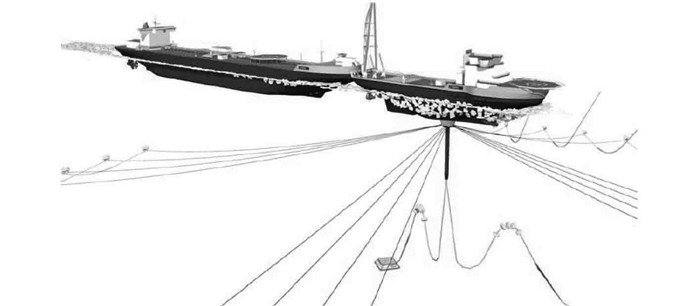
In recent years, the oil and gas production is getting more and more concern in the European Arctic. With the increased interest in the hydrocarbons exploration and exploitation, a new concept called The Arctic Tandem Offloading Terminal (ATOT) is proposed for the conditions occurring in the Barents Sea, Kara Sea and off Sakhalin. The concept comprises two units (see Figure 1): a turret moored offloading icebreaker (OIB) and a shuttle tanker moored in tandem at the OIB aft. Relevant details about the concept and tests are presented by Jensen et al. (2008), Bonnemaire et al. (2008).
|
Fig. 1 Sketch of the ATOT concept (Bonnemaire et al., 2008) |
However, when a ship is moored in ice conditions, it is possible that ice can interact with the hull from any direction due to the uncertainty of current and wind direction, which has impact on the interaction geometry, ice failure and therefore ice loads on the hull. Based on the observations and measurements from the model tests (Aksnes, 2009), it is obvious that the OBI is vulnerable to change its heading once touching the ice because of asymmetric action on the hull and little stiffness of moored system in the yaw. Once this phenomenon happens, the ship will turn so that a lager lateral area of hull will be exposed to ice interaction, which significantly augment the ice action on the hull and may lead to the breakage of moor lines. In order to avoid the accident and reduce the risk of ATOT, another method with heading control base on the moored ship is introduced to keep the heading as the desired. Once the ice drift is monitored with the help of ice management, the ship in the ice environment can tune the heading towards the incoming ices in advance and also keeping the heading as well during the interaction.
In this paper, the objective is to establish a numerical method based on empirical data to calculate the ice loads on ship. Then a numerical simulation of moored ship performance in horizontal plane based on heading control is conducted. Finally, the numerical results from different cases, including variability of ice thickness, ice speed and ice drift, are discussed.
1 Mathematical modeling of Vessel motionThe dynamics of vessels may be modeled at several levels of complexity. In this paper the formulation is carried out at two complexity levels (Sørensen, 2005a), namely a process plant model and a control plant model. The process plant model, which simulates as close as possible the real physics of the plant dynamics including process disturbances, sensor outputs and control inputs, is used for numerical simulations and analysis of the stability and performance of the closed-loop system. The control plant model, which is simplified from the process plant model, is used for controller design and analytical stability analysis (e.g.in the sense of Lyapunov). In this section, the process plant model including the kinematics and dynamics is discussed.
The study of dynamics is divided into kinematics and kinetics. The former describes geometrical aspects of motion while the latter deals with the forces and moments that generate such motion.
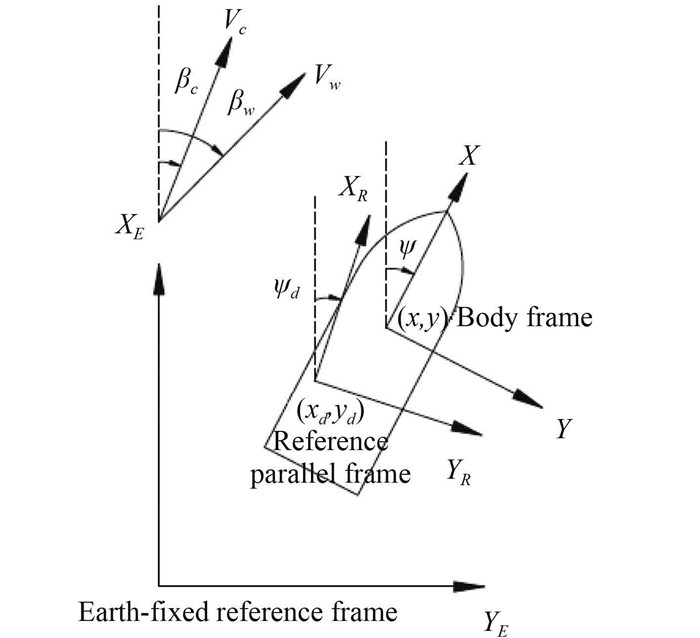
1.1 KinematicsIn station keeping, the motions and state variables of the control system are defined and measured with respect to some reference frames or coordinate systems as shown in Fig. 2 (Sørensen, 2005). The Earth-fixed reference frame is denoted as theXEYEZE -frame, in which the vessel’s position and orientation coordinates are measured relative to a defined origin. The body frameXYZ is fixed to the vessel and thus moving along with it. The hydrodynamic frame, XhYhZh -frame, is generally moving along the path of the vessel. In station keeping operations about the coordinatesxd , yd and Ψd , the hydrodynamic frame is Earth-fixed and denoted as the reference-parallel frameXRYRZR .
|
Fig. 2 Earth-fixed, reference-parallel and body-fixed frames |
The position vector of the vessel is defined as the Earth-fixed position (
| $ {{\dot \eta }} = {{J(\eta )\nu }}\;\;{\rm{or}}\;\;\left[ {\begin{array}{*{20}{c}} {{{{{\dot \eta }}}_{{1}}}}\\ {{{{{\dot \eta }}}_{{2}}}} \end{array}} \right]{{ = }}\left[ {\begin{array}{*{20}{c}} {{{{J}}_{{1}}}{{(}}{{{\eta }}_{{2}}}{{)}}} & {{{{0}}_{{{3 \times 3}}}}}\\ {{{{0}}_{{{3 \times 3}}}}} & {{{{J}}_{{2}}}{{(}}{{{\eta }}_{{2}}}{{)}}} \end{array}} \right]\left[ {\begin{array}{*{20}{c}} {{{{\nu }}_{{1}}}}\\ {{{{\nu }}_{{2}}}} \end{array}} \right]{{.}} $ | (1) |
If only surge, sway and yaw (3DOF) are considered, the position vector and the velocity vector are reduced to
| $ {{\dot \eta }} = {{R(\psi )\nu }}, $ | (2) |
| $ {{R(\psi )}} = \left[ {\begin{array}{*{20}{c}} {\cos \psi } & { - \sin \psi } & 0\\ {\sin \psi } & {\cos \psi } & 0\\ 0 & 0 & 1 \end{array}} \right]. $ | (3) |
The 6-DOF model formulation is based on Fossen (2010) and Sørensen (2005). The equation of motion for the nonlinear model of a moored vessel is given by
| $ {{M\dot v + }}{{{C}}_{{{RB}}}}{{(v)v + }}{{{C}}_{{A}}}{{(}}{{{v}}_{{r}}}{{)}}{{{v}}_{{r}}}{{ + D(}}{{{v}}_{{r}}}{{) + G(\eta ) = }}{{{\tau }}_{{{ice}}}}{{ + }}{{{\tau }}_{{{moor}}}}{{ + }}{{{\tau }}_{{c}}} $ | (4) |
where
In the station keeping, it is assumed thatCRB (v), CA (vr ) and the nonlinear component damping due to the hull in (4) are small and thus neglected. Based on the consideration of only horizontal motion, the kinetics model can be simplified such that
| $ {{M\dot v + = }}{{{\tau }}_{{{ice}}}}{{ + }}{{{\tau }}_{{c}}}{{ + }}{{{\tau }}_{{{moor}}}}, $ | (5) |
where
In this paper, the numerical method to evaluate the ice loads that was introduced by Su et al. (2010) was extended in this paper to simulate the moored ship performance in the horizontal plane under more complex and heading control conditions. In this section, this model is briefly described.
2.1 Numerical Simulation of the icebreaking patternIn the simulation program, the 2D ship model and the edge of the ice were discretized into a number of nodes on the water plane (as shown in Fig. 3). At each time step, the computational geometric tools were applied to collect the contact zones along the ship hull. It was also assumed that the hull had a flat contact surface at each contact zone.

|
Fig. 3 Discretization of the ship hull and the edge of the ice (Su, 2010) |
The ice wedges that were involved in the break displace process were determined by the bending cracks, which were idealized and described by a single parameter, the icebreaking radius. The icebreaking radius R was found by the expression given in Wang (2001) (based on information from Enkvist (1972) and Varsta (1983)):
| $ R = {C_l}l(1.0 + {C_v}{v^{rel}}_n). $ | (6) |
where
| $ l = {\left( {\frac{{E{h_i}^3}}{{12(1 - {v^2}){\rho _w}g}}} \right)^{1/4}}. $ | (7) |
|
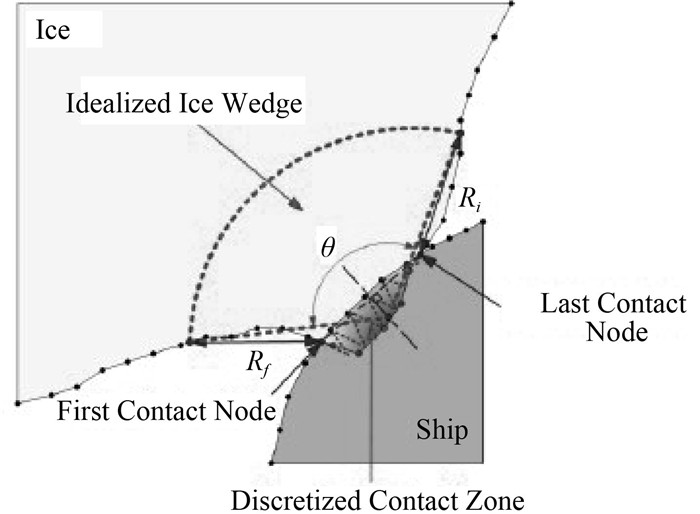
Fig. 4 Idealized ice wedge and discretized contact zone (Su, 2010) |
As shown in Fig. 4, the ice wedge was idealized and determined by the interpolation of the icebreaking radius at the first and last contact nodes (i.e., Rf and Rl ), and the opening angle of the ice wedge was denoted asθ. The contact zone was discretized by a number of triangles (the triangles shown in red in Fig. 4) based on the hull nodes that were in contact. The contact areaAC can then be calculated (Su et al., 2010). Before a bending failure occurs, we assume that the ice is only crushed on the contact surface, and the crushing forceFcr is normal to the contact surface and is calculated as the product of the ice crushing strengthσc (according to Kujala (1994)) and the contact areaAC . The frictional force was also taken into account (Su et al., 2010). Thus, if the vertical component of the crushing and frictional forcesFV exceeds the bending failure loadPf given in Eq. (8), the ice wedge will be bent and cleared from the edge of the ice:
| $ {P_f} = {C_f}{(\frac{\theta }{{\rm{\pi }} })^2}{\sigma _f}{h_i}^2. $ | (8) |
Whereθ opening angle of the idealized ice wedge is shown in Fig. 4; σf is the flexural strength of the ice; hi is the thickness of the ice; and Cf is an empirical parameter. Based on these assumptions, a step-by-step procedure can be applied to determine the icebreaking pattern and continuous icebreaking forces. The effects of the empirical parameters on the mean icebreaking force were investigated and compared with Lindqvist’s ice resistance (Lindqvist, 1989) in Su et al. (2010).
2.2 Simulation of the ship’s motionIn the simulation program, the surge, sway and yaw motions that were involved in the ship’s maneuvers as well as the icebreaking patterns were simulated simultaneously. Let (X, Y, Z) be a right-handed coordinate system where Z is in the vertical upward direction, X is in the direction of forward motion, and the origin is located at the hull’s center of gravity. Then, the linear coupled differential equations of motion can be written in the following form:
| $ {{(M + A)\ddot r(t) + Br(t) + Cr(t) = F(t)}}. $ | (9) |
Where the added mass coefficients were calculated from a given boundary element method program; and the damping and hydrostatic restoring coefficients were assumed to be zero in the 3DOF mode.
The forces and moments that resulted from the ice, ambient water, mooring system and control system were considered. A step-by-step numerical integration method was applied to solve the equations of motion that were established above based on Newmark’s method. More details are referred to Su et al. (2010).
3 Mooring systemThe mooring system applicable for the paper is an internal turret mooring system defined as a mooring system where lines are connected to the turret which via bearings allows the vessel to rotate around the anchor legs.It is desired to utilize turret systems, since the disconnection and reconnection sequence is quick and reliable.
Motions of a moored buoy in the ice conditions are significantly restricted by the mooring lines. Further, mooring systems provide not only time-varying restoring forces but also damping forces, both of which must be taken into consideration in the vessel response analysis in the horizontal plane. That is to say, the motion amplitude is highly dependent on the stiffness of the mooring system and the damping. The restoring forces are derived by presetting a set of maximum offsets in the direction in question, after which the relation between restoring forces and offsets can be approximated by the curve fitting method. However, damping of the motions might be difficult to quantify because it depends on configuration of mooring systems, water depth, actual sea state, current profile, ice conditions, and so on. A substantial degree of uncertainty arise in the evaluation of damping mainly constituting viscous damping of the vessel, wave drift damping, mooring system damping as well as thruster system damping if applicable. Therefore simplification is needed to incorporate the damping into the response analysis. One way is to use a linear damping coefficient in the motion equations, namely described by the damping ratio. If the effect of heading controller is not considered and the heading is assumed constant, the equation of (5) in surge and sway can be rewritten as
| $ \begin{array}{c} {{M\dot v + }}{{{D}}_{{{moor}}}}{{{v}}_{{r}}}{{ + }}{{{G}}_{{{moor}}}}{{(\eta ) = }}{{{\tau }}_{{{ice}}}},\\ {{{D}}_{{{moor}}}}{{ = 2\zeta }}\sqrt {{{MK(\eta )}}},\\ {{K(\eta ) = G(\eta )/\eta }}. \end{array} $ | (10) |
where
The main idea for heading control is to supply the system with additional damping and stiffness by aid of propulsion system. With this purpose, the damping could be provided by D-controller while the stiffness could be invoked by P-controller. Generally speaking, integral action is not desired to be used in position mooring (PM) system since ship the vessel is allowed to move within a certain range about the equilibrium point. If the heading deviates far away from the equilibrium which is unacceptable, the controller begins to make the actuators drive the vessel into the desired point. The control strategy is important to reduce fuel combustion of PM system. Then heading controller is chosen as a PD control law
| $ {M_\psi } = - {k_{p,\tilde \psi }}\tilde \psi - {k_{d,\tilde \psi }}^{\dot \sim }\psi , $ | (11) |
whereMΨ
presents the yaw moment necessary for propulsion system to counteract the disturbance of ice excitation;
In this section, a tanker named MT Uikku maneuvering in level ice is modeled, in which the ice forces are evaluated according to the empirical formulas which has been verified in (Su, 2010). After that the mooring system is configured and the relation between offset and restoring forces is curve-fitted by the help of Riflex. Then, response of moored ship in the horizontal plan is simulated with the ice excitation as an input.
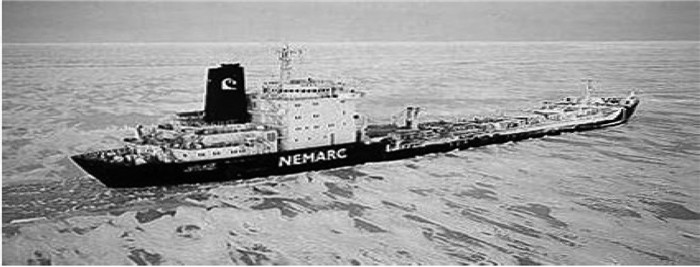
5.1 Modeling ofMT UikkuMT Uikku is a double-hull icebreaking motor tanker that is owned by Neste Shipping and Kvaerner Masa-Yard’s joint venture company, Nemarc. The ship was constructed to meet the standards of the highest Finnish-Swedish Ice Class, IA Super. The primary dimensions of MT Uikku are given in Table 1. In 1998, MT Uikku was instrumented to measure the ice loads from different parts of the ship hull during the ARCDEV voyage (Kotisalo et al., 1999). In 2003, three voyages were made between the Gulf of Finland and the Bothnian Bay (Hänninen, 2003), and the statistical characteristics of the ice loads measured on the bow area were discussed in Kujala et al. (2009) in which the analyzed data were gathered from the sensors FFR1 and FFR2 that were instrumented on frame 196.5 (as shown in Fig. 5).
|
|
Tab.1 Primary dimensions of MT Uikku |
|
Fig. 5 Icebreaking tanker MT Uikku |
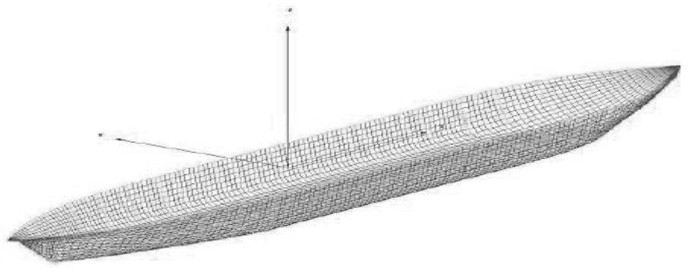
It is shown in Fig. 6 that the 3D ship geometry model of MT Uikku was built for the calculation of the hydrodynamic coefficients, which were required for the calculation of the ship’s motion. During the simulation of the icebreaking process, the full-scale ship model of MT Uikku was discretized into a number of nodes on the water plane. In Fig. 7, the edge of the ice was also discretized, and the ice thickness, ice crushing pressure and ice flexural strength were randomized along the X-axis. It should be noted that the effects of the submersion and sliding processes on the global ice loads were calculated from the submersion component of Lindqvist’s resistance. In calculating the submersion resistance, the bow was assumed to be completely covered by ice, and the bottom was covered for 70% of the length of the ship (Lindqvist (1989)).
|
Fig. 6 Ship geometry model of MT Uikku |

|
Fig. 7 Icebreaking model of MT Uikku |
In this section, during an icebreaking process, the thickness and strength properties of the ice that is encountered by the ship are assumed to be uniform.
Fig. 8 shows the 1000-second time histories of the calculated ice loads on frame, which are consisted of six icebreaking trials in which different constant values for the ice thickness (1.1 m and 1.5 m) and mean values of ship speed (0.3 m/s and 0.75 m/s) were simulated. The simulated frame loads seem to be very sensitive to the constant value of the ice thickness. Since the difference between two mean ship speeds is trivial, no apparent effect on the ice loads is showed from the speed. It is also observed that the peak values and repetition periods of the ice loading processes are varied due to the change in the motion of the ship for given propulsion, even though the external ice conditions are fixed.

|
Fig. 8 (a) Ice loads with ice thickness 1.1 m and mean ship speed at 0.3 m/s (b) Ice loads with ice thickness 1.1 m and mean ship speed at 0.75 m/s Ice loads with ice thickness 1.5 m and mean ship speed at 0.3 m/s (d) Ice loads with ice thickness 1.5 m and mean ship speed at 0.75 m/s |
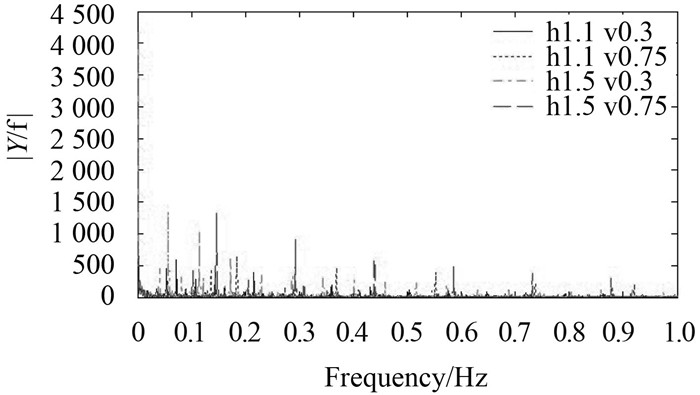
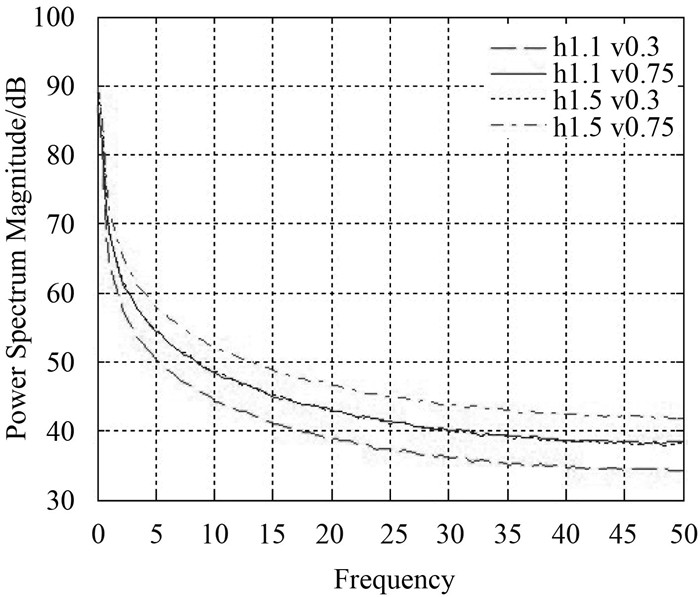
Fig. 9 and Fig. 10 give information about the amplitudes of simulated frame loads in frequency domain and the power spectral density of the ice loads in surge corresponding to Fig. 8. For brevity, the ice loads in sway and yaw are neglected since it is not as important as the loads in surge when the ship is heading towards the ice in a straight line. Obviously, it shows that the ice loading occurs mainly at low frequencies, ranging from 0 to about 1 Hz in the cases considered in Fig. 9. In addition, the results from Fig. 10 coincide with the fact that more propulsion need to overcome the ice load when maneuvering in the thicker ice or with higher speed, which verify the validity of the method of simulating the icebreaking process.
|
Fig. 9 Single-sided amplitude spectrum of ice loads in surge |
|
Fig. 10 Power spectrum magnitude of ice loads in surge |
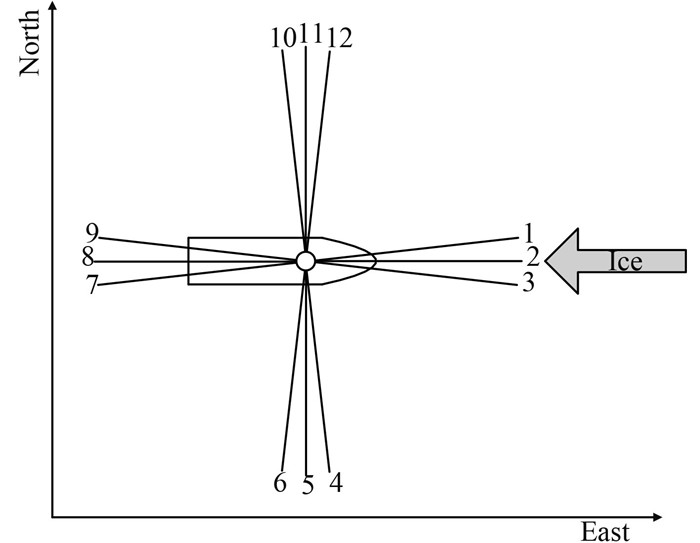
The mooring system consists of twelve identical mooring lines distributed at four corners of the vessel with three lines each and each mooring line has an identical chain-wire-chain configuration. The angle between mooring line 1 and line 2 is 10 degrees. The horizontal projection of the mooring system with water depth of 150 m is plotted in Fig. 11. In the configuration, North denotes the surge direction and East denotes the sway direction. The characteristics of the chain and wire components of each mooring line are listed in Table 2.
|
Fig. 11 Horizontal projection of the mooring system with 150 m water depth |
|
|
Tab.2 Characteristics and lengths of chain and wire components |
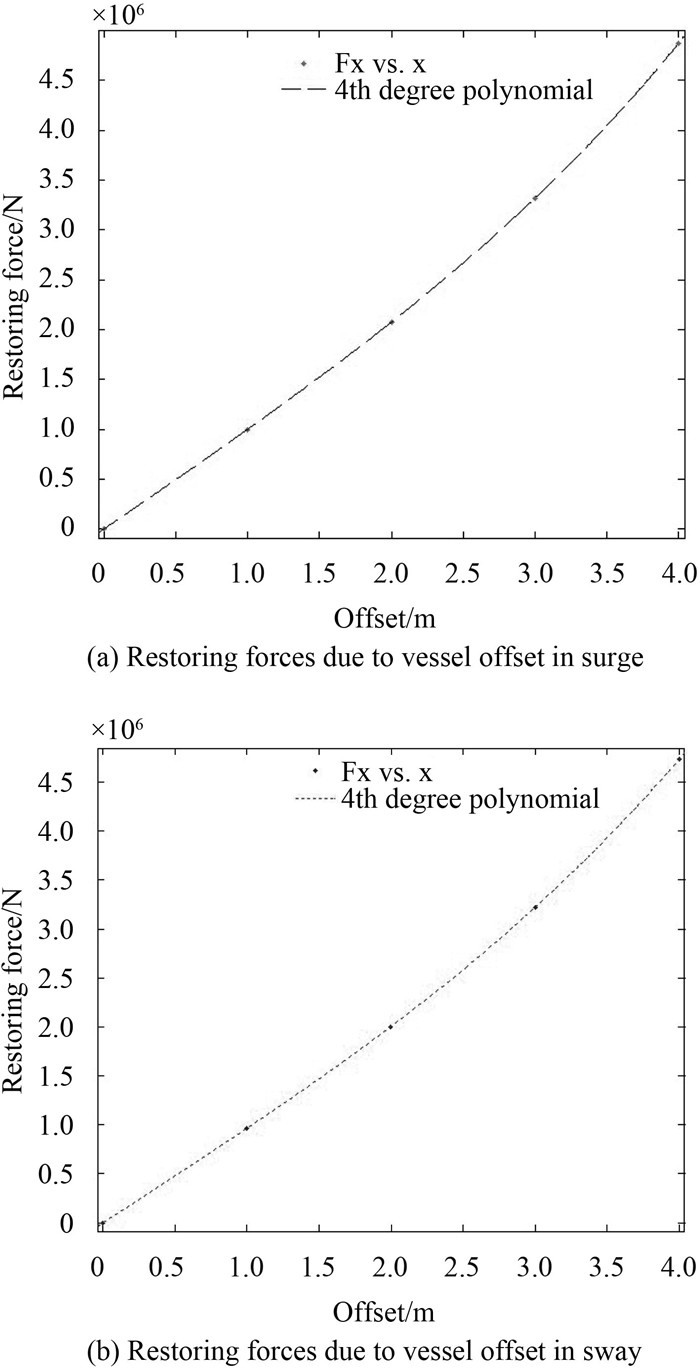
The ice direction is assumed to move in the west direction defined in Fig. 11 and is also marked on the same figure. First, the tanker is loaded by be moved quasi-statically along the ice direction, after which the offset-restoring force curves of mooring lines in surge and sway can be obtained from Riflex based on FEM, which is plotted in Fig 12. The obtained relation between restoring forces and offsets are fitted with a 4th degree polynomial as shown with dash line and dot line in Fig. 12 (a) and Fig. 12 (b) respectively. The curve could be expressed as:
| $ \begin{array}{l} \!\!{G_1}(x) \!\!=\!\! 2067{x^4} \!\!+\!\! 3348{x^3} \!\!+\!\! 12900{x^2} \!\!+\!\! 980500x \!\!+\!\! 40.58,\\ \!\!{G_2}(y) \!\!=\!\! 544.6{y^4} \!\!+\!\! 13990{y^3} \!\!-\!\! 8773{y^2} \!\!+\!\! 959300y \!\!+\!\! 14.35. \end{array} $ |
According to equation (19), the nonlinear stiffness is given
| $ \begin{array}{l} K{}_1(x) \approx 2067{x^3} + 3348{x^2} + 12900x + 980500,\\ {K_2}(y) \approx 544.6{y^3} + 13990{y^2} - 8773y + 959300. \end{array} $ |
As for the damping, according to DNV OS-E301 (DNV 2004), for a ship in 150m water depth, with 12 mooring lines and no risers: the surge damping coefficient is 5% to 10% of critical damping; the sway damping coefficient is 15% to 20% of critical damping.
|
Fig. 12 (a) Restoring forces due to vessel offset in surge (b) Restoring forces due to vessel offset in sway |
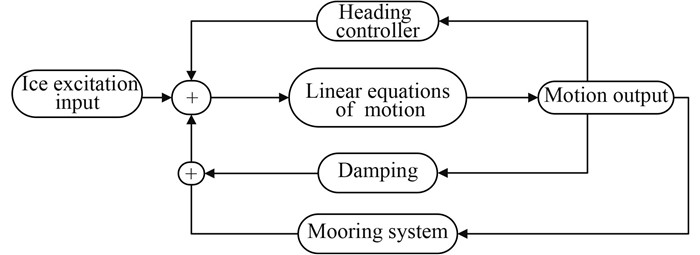
In broad sense, the main idea of simulations involves that the surge motion and sway motion is controlled by mooring system and the heading is controlled by heading controller which makes the moment command to thruster systems to counteract the external disturbances. The flow chart of simulation process is illustrated in Fig. 13. The ice loads under ice thickness 1.1 m and mean ship speed 0.3 m/s is applied as ice excitation input based on the assumption that the change of heading is trivial so that the ice excitation used as input would deviate the actual ice loads simulated when considering the influence of heading change on the ice loads. In the following simulation, three cases about the damping coefficients are to be considered, e.g., the undamped motion with
|
Fig. 13 Flow chart of simulation process |
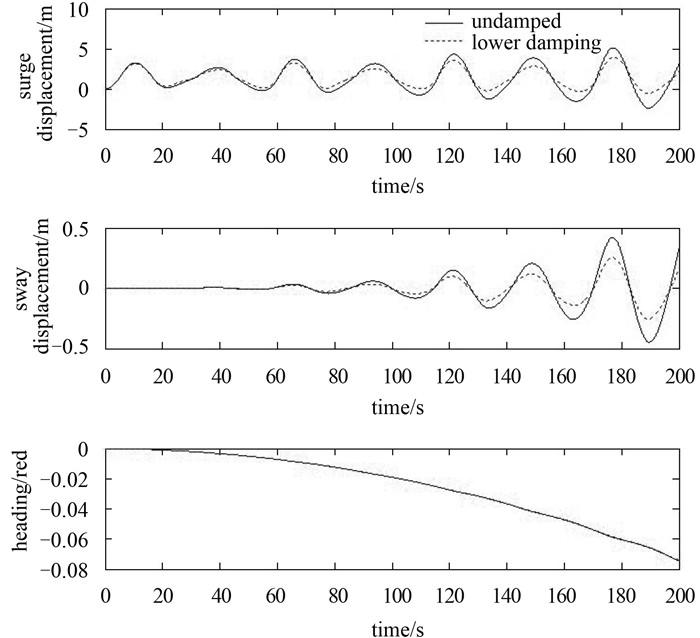
The simulation is done in undamped case and lower damping situation and the corresponding results are plotted in the figure 14.
|
Fig. 14 Undamped and lower damped motion without heading control |
It shows in the Fig. 14 that the heading begins to deviate from the original position even if the disturbance from ice is trivial because of its non-stiffness and non-damping in yaw, which also induces the sway motion due to the coupled effect between sway and yaw. This relation may bring the substantial increase in the amplitude of sway motion, leading to the breakage of mooring lines further, which is undesired in the practical application. In addition, once the heading deviates from the equilibrium, the external yaw moment from the ice action is likely to become larger than the input, which aggravates the possibility of the breakage. Besides, compared to undamped simulation, damping helps reduce the amplitude of motion, which is to be discussed in the following simulations. Therefore, heading control is of great importance in the station keeping of the tanker in ice.
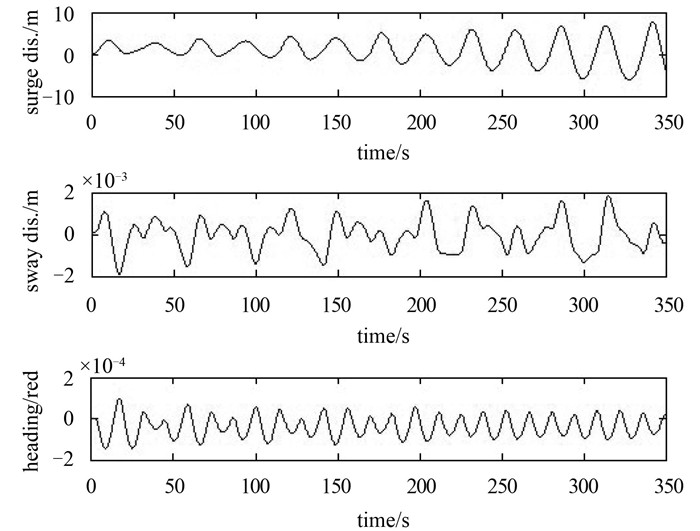
5.4.2 Response with constant heading controlAll simulations in this section are based on the heading control aiming at keep the heading at the initial value. The undamped response of the tanker in the level ice is shown in figure 15. Clearly, the heading and sway motion are controlled very well oscillating around the initial position with small amplitudes. However, the undamped surge motion diverges as time goes. This phenomenon could be explained easily in the sense that resonance appears when the ice exciting force has the same frequency as the natural frequency of the system. The ice excitation will continuously provide the energy to the system, which leads to a persistent increase of the amplitude of response. Hence, it is necessary to design the structure to ensure that the resonance is avoided.
|
Fig. 15 Undamped response based on heading control |
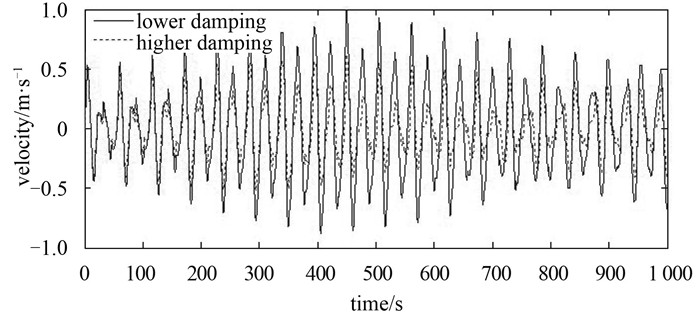
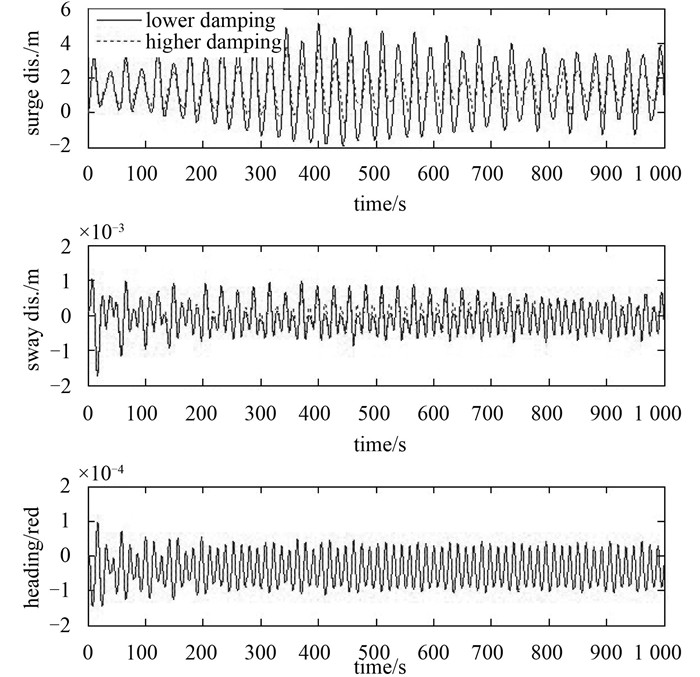
For the damped simulations, the responses with lower damping and higher damping are plotted in figure 16. Analogous to the undamped case, the heading and sway motion behaves as desired with small oscillations in both the lower and higher damping conditions while the significant differences in surge motions exist in undamped and damped situations.
|
Fig. 16 Velocity in surge based on heading control |
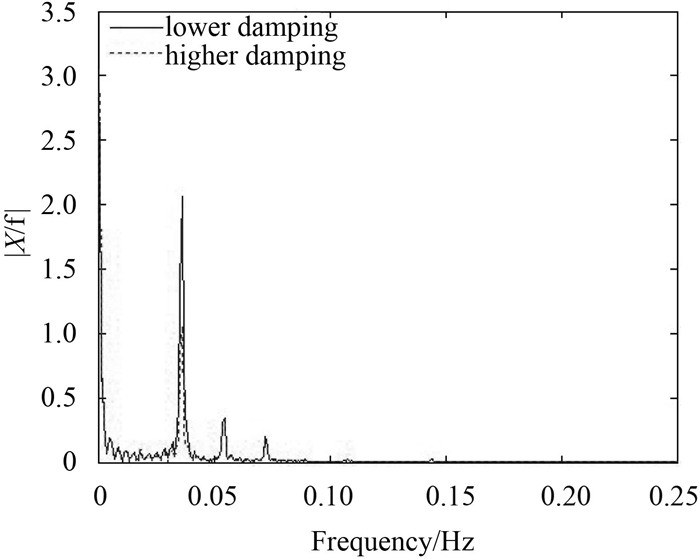
First, the influence of damping on the amplitudes of both surge motion and velocity (as shown in Fig. 16) is obviously comparing the motions and velocities with lower damping and higher damping. Second, the surge motion converges to a steady state as shown in Fig. 17.Fig. 18 illustrates the surge motion in frequency domain, from which it can be seen that the model frequencies are almost the same for the lower damping and higher damping, but the amplitudes with lower damping are larger than that with higher damping as a whole, especially at the model frequencies. In addition, it also shows that response occurs mainly at low frequencies, namely from 0 to 0.25 Hz for surge response.
|
Fig. 17 Damped response based on heading control |
|
Fig. 18 Surge amplitude in frequency domain based on heading control |
As mentioned before, ice is vulnerable to change the heading without heading controller. Provided that the ice turns the direction towards the tanker suddenly, then the best way for the tanker is to adjust the heading to make sure that the ice is moving towards the symmetric axis in surge.
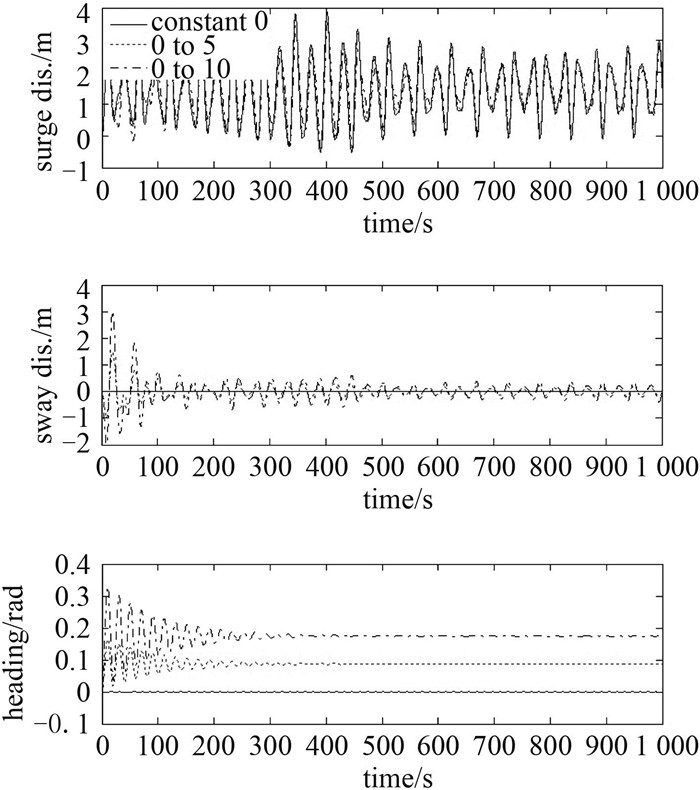
In this section, some simulations of heading response to variable ice drift with heading control are performed in order to test if the heading controller continues to works well in the assumed scenarios. The change of heading could not be set to too big since it has been assumed previously that the change of heading is small so that the ice forces as input is still valid to be used here. The desired headings are selected as 5 degrees and 10 degrees in the earth-fixed coordinate. The results of simulation are given in the figure 19. The controller performs well for the heading converges to the desired as expected. Of course, for a larger step in heading from 0 to 10 degree it will take longer time to settle down. Further, the effect from the controller on surge motion is small from figure 19.
|
Fig. 19 Heading response to variable ice drift with heading control |
A key issue of applying ATOT to gas and oil exploitation has been pointed out. As a feasible method to solve this problem, the head controller which aims at providing the necessary damping and stiffness has been designed and incorporated into the mooring system to simulate the response of the tanker in the horizontal plane. From results of the simulation, two important inspirations must be paid enough attention:
1) Damping estimation is of primary importance when predicting response of ship motion or designing the station keeping system for vessel operating in ice conditions in that it has a significant impact on the amplitude of motion and velocity. Damping insufficiency may lead to the resonance which should be avoided.
2) Applying the heading controller to control the heading is feasible and good method in both keeping the heading constant and tuning the heading to the desired which decreases the ice disturbance distinctly. It is useful to overcome the undesired change of heading caused by variable ice drift.
As a further research, the 6 DOF motion of moored vessel in the ice needs to be investigated as well as the dynamic mooring analysis.
| [1] | Bonnemaire, B., Aksnes, V., 2009. Analysis of the Behaviour of a Moored Ship in Variable Ice Drift. Proceedings of the 20th International Conference on Port and Ocean Engineering under Arctic Conditions. Luleå, Sweden. |
| [2] | Bonnemaire, B., Lundamo, T., Jensen, A. and Rupp, K.H., 2008. Subsurface Ice Interactions under a Moored Offloading Icebreaker. Proceedings of the 19th International Symposium on Ice. Vancouver, British Columbia, Canada. |
| [3] | DNV (2004) Offshore Standard-Position Mooring. DNV OSE301. |
| [4] | Enkvist, E., 1972. On the Ice Resistance Encountered by Ships Operating in The Continuous Mode of Icebreaking. Report No.24, The Swedish Academy of Engineering Science in Finland, Helsinki, Finland. |
| [5] | Fossen, T.I., 2010. Guidance and control of Marine Craft. Trondheim, Norway: Marine Cybernetics, NTNU. |
| [6] | Hänninen, S., 2003. Ship Based Observations on Board MT Uikku during the Winter 2003. Ship Laboratory, Helsinki University of Technology, Finland. (Unpublished). |
| [7] | Jensen, A., Bonnemaire, B., Rupp K.H., Løset, S., Breivik, K.G., Evers, K.U., Ravndal, O., Aksnes, V., Lundamo, T. and Lønøy, C., 2008. First Ice Tank Model Testing of the Arctic Tandem Offloading Terminal. Proceedings of the 19th International Symposium on Ice. Vancouver, British Columbia, Canada. |
| [8] | Kotisalo, K., Kujala, P., 1999. Ice Load Measurements Onboard MT Uikku during the ARCDEV Voyage. Proceedings of POAC 1999, pp. 974-987. |
| [9] | Kujala, P., 1994. On the Statistics of Ice Loads on Ship Hull in the Baltic. Mechanical Engineering Series No. 116, Ship Laboratory, Helsinki University of Technology, Finland. |
| [10] | Kujala, P., Suominen, M., Riska, K., 2009. Statistics of Ice Loads Measured on MT Uikku in the Baltic. Proceedings of POAC 2009. |
| [11] | Lindqvist, G., 1989. A Straightforward Method for Calculation of Ice Resistance of Ships. Proceedings of POAC 1989, pp. 722-735. |
| [12] | Sørensen, A.J., 2005. Marine cybernetics: modeling and control. In Lecture notes (5th edition). UK-05-76.Trondheim, Norway: Department of Marine Technology, NTNU. |
| [13] | Su, B., Riska, K., Moan, T., 2010. A Numerical Method for the Prediction of Ship Performance in Level Ice. Cold Regions Science and Technology, Vol. 60, pp. 177-188. |
| [14] | Varsta, P., 1983. On the Mechanics of Ice Load on Ships in Level Ice in the Baltic Sea. Publications 11, Technical Research Centre of Finland, Espoo, Finland. |
| [15] | Wang, S., 2001. A Dynamic model for Breaking Pattern of Level Ice by Conical Structures. Ph.D. Thesis, Department of Mechanical Engineering, Helsinki University of Technology, Finland. |
 2016, Vol. 38
