 2021, Vol. 41


2. 中国民航大学飞行技术学院, 天津 300300
2. College of Flight Technology, Civil Aviation University of China, Tianjin 300300
大气气溶胶通过吸收和散射太阳辐射, 影响地-气系统的辐射收支平衡, 即大气气溶胶-辐射相互作用(Aerosol-Radiation Interaction, ARI)(Li et al., 2017; Kuniyal et al., 2019).ARI可以改变边界层中质量和动量的递减率和垂直混合(Yang et al., 2016; Wang et al., 2018), 扰动地表温度、相对湿度、风速、降水量等天气要素(Wang et al., 2014a; Gao et al., 2015; Liu et al., 2016; Zhong et al., 2018a; 2018b; Zhang et al., 2019), 这些扰动又会通过传输、气象条件变化或化学过程等影响地面气溶胶浓度和空气质量(Yang et al., 2015; Zhang et al., 2015; Chen et al., 2016; Zhang et al., 2016; Zhou et al., 2018).
气溶胶辐射冷却效应对局地天气产生明显影响, 加剧气溶胶污染(Zhong et al., 2018a).并且气溶胶与边界层气象之间存在正反馈机制, 加剧高气溶胶质量浓度情况下的大气污染和霾事件(Petäjä et al., 2016; Zhao et al., 2017; Li et al., 2017; Liu et al., 2018; Zhong et al., 2018b).气溶胶-辐射相互作用可以强烈影响霾事件期间的PM2.5浓度(Ding et al., 2016; Liu et al., 2018; Zhong et al., 2018b; Dang et al., 2019; Wu et al., 2019)及大气污染物化学组分(Wang et al., 2014a; Zhang et al., 2018).2013年1月强霾事件期间, ARI使得京津冀区域日间地面PM2.5平均浓度增加10~50 μg·m-3 (2%~30%)(Wang et al., 2014; Gao et al., 2015).2015年12月华北平原持续性强霾事件期间, ARI使得近地面PM2.5浓度增加10.2 μg·m-3 (7.8%).当近地面PM2.5质量浓度从50 μg·m-3左右增加到几百μg·m-3时, ARI对华北平原白天近地面PM2.5的贡献超过20%, 极大地加剧了强霾的形成(Wu et al., 2019).ARI在冬季最高可使四川盆地PM2.5月平均浓度增加超过30 μg·m-3, 使中国地区平均增加8.9 μg·m-3(6.9%)(Zhang et al., 2018).
ARI对短期排放控制措施的响应可以提高大气污染治理的效果.有研究表明, ARI效应使得APEC期间的临时排放控制效果提高了6.7%(Zhou et al., 2019), 对北京城区日间地面PM2.5浓度的下降贡献了1.9 μg·m-3, 约占PM2.5总降幅的10.9%(Gao et al., 2017).ARI效应可以使排放控制措施在重污染条件下更加有效, 获得额外的空气质量改善效益和健康红利, 但ARI效应对PM2.5污染迅速增加的地区和没有空气污染控制措施的地区则是一种惩罚, 会加剧气溶胶污染(Xing et al., 2016; Zhou et al., 2019).
为应对严重的大气污染, 我国于2013年颁布并实施了严格的《大气污染防治行动计划》(“大气十条”).针对“大气十条”对大气污染治理的影响, 近期有很多学者进行了相关研究(张小曳等, 2019; Cheng et al., 2019a; 2019b; Sun et al., 2019; Vu et al., 2019).然而, 这些研究主要集中在厘清减排和气象条件变化对PM2.5质量浓度下降所起的作用和相对贡献, 以及所带来的健康效益等方面(Zheng et al., 2017; Ding et al., 2019; Zhai et al., 2019; Zhang et al., 2019), 没有涉及“大气十条”对大气气溶胶-辐射相互作用强度变化的影响.因此, 有必要了解“大气十条”实施后, 我国大气气溶胶-辐射相互作用的强弱发生了怎样的变化, 并定量分析其变化对空气质量的影响, 为未来制订和评价大气污染防治政策措施等提供科学依据.
2 数据与方法(Data and methods) 2.1 观测数据模型验证的气象数据来自美国国家气候数据中心(NCDC)提供的模拟区域内地面气象站数据, 大气污染物数据来自中国环境监测总站发布的模拟区域内经过数据质量控制的国控站点逐小时空气质量监测数据.
2.2 模型配置本研究利用在线耦合的区域大气化学传输模型WRF-Chem v3.7.1进行数值模拟.水平分辨率为36 km×36 km, 垂直方向从地表至50 hPa不均匀分为24层, 边界层内设置了更密集的垂直层次, 以便更好地模拟该层次内的气象要素变化.气象初始场和边界场数据来自NCEP的全球再分析(FNL)资料.化学初始场和边界条件由MOZART-4模型提供(Emmons et al., 2010).其他物理和化学方案包括:RRTMG长波和短波辐射传输方案(Iacono et al., 2008)、Purdue Lin云微物理方案(Lin et al., 1983)、Grell Freitas积云参数化方案(Grell et al., 2014)、Noah陆面过程方案(Chen et al., 2001)、YSU边界层方案(Hong et al., 2006)、CBM-Z气相化学机制(Zaveri et al., 1999)、MOSAIC四粒径段气溶胶机制(Zaveri et al., 2008)、以及Fast-J光化学机制(Wild et al., 2000).本研究使用的人为源排放清单, 在中国地区采用MEIC排放清单(Zheng et al., 2018), 中国以外的区域采用MIX排放清单(Li et al., 2017a).生物质排放为MEGAN模型的在线计算结果(Guenther et al., 2006).海盐和沙尘排放通量的计算来自GOCART模型(Chin et al., 2000; Ginoux et al., 2001).模拟区域包括东亚大部、东南亚北部和南亚东部.
2.3 试验方案本研究的模拟年份为2013年和2017年, 选取各年的1月、4月、7月和10月分别代表冬、春、夏和秋4个不同季节, 以表征各类气象要素和大气颗粒物浓度在时间尺度上和年均情况的异同.
为了量化人为源排放和气象条件变化对PM2.5浓度以及气溶胶-辐射相互作用的影响, 共进行4组情景试验:①2013年基准情景(E13M13);②2017年基准情景(E17M17);③假设情景1(E13M17);④假设情景2(E17M13).每组情景试验所使用的排放场和气象场详见表 1.每组情景下各季节代表月份的模拟试验又包含3套模拟试验:①BASE试验, 利用WRF-Chem的在线耦合特性, 完整考虑气溶胶-辐射相互作用(ARI)和气溶胶-云相互作用(Aerosol-Cloud Interaction, ACI)的影响;②RAD试验, 不考虑ACI, 仅考虑ARI, 即将云微物理方案中的云滴数浓度设定为一个恒定的清洁背景值(2.5×10⁷ kg-1), 以排除气溶胶对云滴粒子数的影响(Zhang et al., 2015; Zhao et al., 2017; Zhang et al., 2018; Zhou et al., 2019);③NON试验, 是在RAD试验配置的基础上, 将ARI关闭, 即ARI和ACI均不考虑.用RAD与NON试验结果之差, 量化ARI效应对气象要素和大气颗粒物浓度的影响.之所以设计3套模拟试验, 是为了固定云滴数浓度, 以排除ACI对ARI的叠加影响, 仅考虑由于ARI所引起的气象要素变化和大气污染物浓度水平波动.
| 表 1 模拟试验方案 Table 1 Simulation experiment scheme |
由于2017基准情景(E17M17)与假设情景1(E13M17)之间气象条件一致, 只存在人为源排放的差异, 两者的模拟结果之差反映人为源排放变化的影响;同理2017基准情景(E17M17)与假设情景2(E17M13)之间人为源排放一致, 只存在气象条件的差异, 两者的模拟结果之差反映气象条件变化的影响.本研究将2017年相对于2013年ARI效应的变化定义为ΔARIv, 其中v表示PM2.5浓度或气象要素, 例如地面向下短波辐射、边界层高度、2 m温度和相对湿度等.排放和气象条件变化对ΔARIv的影响分别表示为ΔEmis-drive和ΔMet-drive.
3 结果与讨论(Results and discussion) 3.1 模型验证气象要素和PM2.5质量浓度模拟结果与实际观测数据的对比统计分析如表 2所示.2017年各季节月平均2 m温度的相关系数在0.89~0.98之间;各季节月平均2 m相对湿度存在-0.7%~2.6%不同程度的均值偏差;各季节月平均10 m风速均值偏差约为0.5~1.0 m·s-1;降水量的相关系数达到0.68~0.80. 2013年和2017年PM2.5浓度的相关系数分别达到0.54~0.63和0.54~0.64, 标准化均值偏差分别为-3.6%~9.1%和5.5%~16.8%.总体而言, 模拟结果与观测数据之间的相关性与之前的很多研究(Zhang et al., 2015; Gao et al., 2017; Zhao et al., 2017; Zhang et al., 2018)相当, 说明模型对气象要素和PM2.5质量浓度的模拟表现良好, 模拟结果合理可信.
| 表 2 模拟区域内气象要素和PM2.5浓度模拟结果与观测结果对比统计分析 Table 2 Statistical analysis of model performance for meteorological factors and PM2.5 concentrations in the simulation domain |
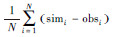 , sim和obs分别为第i个时次的模拟值和观测值, N为样本数;3)标准化均值偏差=
 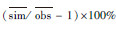 .
.
相较2013年, 2017年各季节ARI效应引起的全国月平均PM2.5浓度增加量明显减小(图 1a).不同季节排放和气象条件变化对ΔARIPM2.5的影响不尽相同(图 1b), 在冬季ΔARIPM2.5的7.2 μg·m-3中, 减排和气象条件变化分别贡献了5.8 μg·m-3和1.4 μg·m-3, 分别约占ΔARIPM2.5的80%和20%;2017年春夏季减排对ΔARIPM2.5的贡献分别达到116%和123%, 而不利气象条件的影响分别抵消了16%和23%的减排贡献.就年平均值而言, ΔARIPM2.5为2.7 μg·m-3, 其中减排贡献了2.4 μg·m-3, 约占88%;气象条件变化贡献了0.3 μg·m-3, 约占12%.显然, 污染减排对ΔARIPM2.5的贡献显著大于气象条件变化的贡献, 起主导作用.
 |
| 图 1 2013年和2017年ARI引起的全国各季节及年平均PM2.5浓度增加(a), 2017年相对于2013年的变化(ΔARIPM2.5)及排放变化(ΔEmis-drive)和气象条件变化(ΔMet-drive)对ΔARIPM2.5的贡献(单位:μg·m-3)(b) Fig. 1 The increase of seasonal and annual average PM2.5 concentrations caused by the ARI effect in 2013 and 2017 (a), the total changes of the ARI effect on PM2.5 concentrations during 2013—2017(ΔARIPM2.5), and the changes attributed to emission reductions (ΔEmis-drive) and meteorological changes (ΔMet-drive) (b) (unit: μg·m-3) |
2013年和2017年各季节ARI均使得中国地区平均地面向下太阳辐射(Shortwave Downward, SWD)、边界层高度(Planetary Boundary Layer Height, PBLH)、2 m温度(Temperature at 2 m, T2)和10 m风速(Wind Speed at 10 m, WSP10)下降, 2 m相对湿度(Relative Humidity at 2 m, RH2)增加.相对而言, ARI对四川盆地气象要素的影响最大, 京津冀区域次之, 长三角和珠三角区域相对较小.2013年1月和2017年1月四川盆地月平均SWD分别下降54 W·m-2和35 W·m-2, 京津冀区域分别下降34 W·m-2和24 W·m-2;四川盆地月平均PBLH分别下降122 m和72 m, 京津冀区域分别下降29 m和36 m;四川盆地月平均RH2分别增加2.3%和1.4%, 京津冀区域分别增加0.1%和1.2%.
总体而言, 与2013年相比, 2017年ARI对全国平均气象要素的影响趋于减弱.如图 2所示, 2017年各季节相对于2013年同期ARI对SWD、PBLH、T2和RH2的影响都产生了较大的差异, 尤其是冬季之间差异最为明显.由于气溶胶与边界层气象之间存在正反馈机制(Petäjä et al., 2016; Li et al., 2017; Liu et al., 2018; Zhong et al., 2018b), 因此, 2013—2017年ARI效应减弱引起的气象要素相对转好, 对污染物的垂直混合和扩散更有利.
 |
| 图 2 2017年各季节相对于2013年同期ARI对地面向下短波辐射(a)、边界层高度(b)、2 m温度(c)和2 m相对湿度(d)的影响差异(单位分别为:W·m-2、m、K和%) Fig. 2 The changes of the ARI effect on surface downward shortwave radiation (a), planetary boundary layer height (b), temperature at 2 m (c) and relative humidity at 2 m (d) in 2017 compared with that in 2013 (△ARIv) (unit: W·m-2, m, K, and%, respectively) |
2013年和2017年各季节ARI效应引起的中国地区月平均PM2.5浓度变化及2017年相对于2013年变化差异(ΔARIPM2.5)的空间分布如图 3所示.2013年和2017年各季节ARI对中国中、东部地区及四川盆地PM2.5浓度均有不同程度的增强作用, 但2017年各季节ARI对PM2.5浓度的影响均明显小于2013年, 这与2017年各季节地面气溶胶浓度明显低于2013年有关.ARI效应的强弱受颗粒物浓度的直接影响, 当所处年份的颗粒物浓度相对较低时, ARI效应导致该年份颗粒物浓度的上升幅度也更小.ARI对PM2.5浓度影响的空间分布特征与地面气溶胶浓度的空间分布特征有很好的对应关系, 中、东部地区和四川盆地气溶胶浓度较高的区域, 2013年和2017年各季节ARI使得地面PM2.5浓度增加的量值和相对百分比均更加明显, ΔARIPM2.5也更大, 尤其是冬季.
 |
| 图 3 2013年(a)和2017年(b)各季节ARI效应引起的中国地区月平均PM2.5浓度变化, 及(c)2017年相对于2013年变化差异(ΔARIPM2.5)的空间分布(单位:μg·m-3) Fig. 3 The monthly average PM2.5 concentration changes caused by the ARI effect in different seasons of 2013 (a) and 2017 (b) over China, and (c) the differences between 2017 and 2013 (ΔARIPM2.5) (unit: μg·m-3) |
ARI效应对中国地区2013—2017年PM2.5浓度总降幅的影响如表 3所示.与2013年相比, 2017年各季节ARI对PM2.5浓度的增强作用明显降低, 并且地面PM2.5浓度降幅越大的区域及季节, ARI增强效应下降的幅度也越大, 说明“大气十条”实施使得PM2.5浓度下降的同时, ARI的增强效应减弱, 带来了额外的空气质量改善效益, 尤其是霾污染频发的冬季, ARI的这种协同效益明显超过了APEC期间对临时减排措施的响应(1.8 μg·m-3, 6.7%)(Zhou et al., 2019).2013年和2017年冬季ARI对全国月平均PM2.5浓度的增强作用分别为12.4 μg·m-3和5.2 μg·m-3.相比2013年, 2017年冬季ARI的增强作用下降了7.2 μg·m-3, 占冬季PM2.5总降幅的12.1%.2017年秋季ARI的增强作用下降了1.8 μg·m-3, 占秋季PM2.5总降幅的6.1%;春节和夏季ARI增强作用下降的量值相对较小, 均只有约1.1 μg·m-3.总体而言, ARI效应的减弱使得2017年全国平均PM2.5浓度相较2013年下降了2.7 μg·m-3, 占PM2.5总降幅的9.1%.
| 表 3 ARI效应减弱对中国地区2013—2017年间PM2.5浓度总降幅的贡献 Table 3 Contribution of the weakened ARI effect to the total reduction of PM2.5 concentrations over China during 2013—2017 |
在区域尺度上, 2013年和2017年冬季ARI效应使得京津冀区域月平均PM2.5浓度分别增加了17.6 μg·m-3和9.4 μg·m-3, 增加百分比分别为9.7%和7.2%;相比2013年, 2017年降低了8.2 μg·m-3, 占该区域冬季PM2.5总降幅的14.8%.ARI效应的减弱使得2017年京津冀区域平均PM2.5浓度相较2013年下降了2.8 μg·m-3, 占该区域PM2.5浓度总降幅的9.9%.在长三角和珠三角区域, ARI效应的减弱也为2017年冬季同比2013年区域月平均PM2.5浓度总降幅分别贡献了4.0 μg·m-3(8.9%)和3.1 μg·m-3(16.8%).
3.5 对冬季污染天气的影响2013年1月和2017年1月京津冀区域都经历了5次不同程度的污染天气过程, PM2.5日均浓度峰值均超过300 μg·m-3.2013年1月和2017年1月, ARI效应使得京津冀区域月平均PM2.5浓度分别增加了17.6 μg·m-3和9.4 μg·m-3;使得2013年1月25—31日强霾事件期间区域日平均PM2.5浓度以及峰值浓度分别增加了23.7 μg·m-3和47.6 μg·m-3, 增加百分比分别为11.1%和20.9%;使得2017年1月1—8日强霾事件期间区域日平均PM2.5浓度以及峰值浓度分别增加了19.2 μg·m-3和33.7 μg·m-3, 增加百分比分别为8.9%和12.4%.2013年1月和2017年1月, ARI增强作用超过10 μg·m-3的天数分别为21 d和12 d.一方面表明ARI效应明显加剧冬季霾污染;另一方面也反映出2017年冬季ARI效应引起的PM2.5浓度增加值、增加百分比和影响明显的天数均显著低于2013年冬季(图 4), 表明2017年冬季ARI对PM2.5浓度的增强效应明显减弱.
 |
| 图 4 2013年1月(a)和2017年1月(b)京津冀区域日平均地面PM2.5浓度(实线)及ARI效应引起的PM2.5浓度增加(虚线)的时间序列 Fig. 4 Time series of the regional average daily surface PM2.5 concentrations (solid line) and the PM2.5 concentration changes caused by the ARI effect (dash line) in the Beijing-Tianjin-Hebei region in January 2013 (a) and January 2017 (b) |
气溶胶辐射强迫使得到达地面的太阳辐射减少, 边界层高度降低, 大气层结更稳定, 对污染物的垂直混合和扩散产生抑制, 是重污染期间近地面PM2.5浓度增加的主要原因(Wang et al., 2014a; Gao et al., 2015; Chen et al., 2019).模拟结果显示, ARI使得2013年1月和2017年1月京津冀区域月平均SWD分别降低了34 W·m-2(24%)和24 W·m-2(18%), 月平均PBLH分别降低了16%和12%.相较于2013年1月, 2017年1月ARI对地面太阳辐射和边界层高度的影响变小, 使得污染物垂直混合和扩散条件相对转好, 减弱了其对PM2.5浓度的增强作用, 这些变化与2013年实施“大气十条”以来整体环境PM2.5浓度明显降低有关.
3.6 ARI增强效应与地面PM2.5浓度的关系2013年和2017年京津冀区域ARI效应引起的PM2.5浓度增加与区域日平均地面PM2.5浓度的相关性如图 5所示, 两者之间均呈明显的二次非线性关系.相比2013年, 2017年ARI效应引起的PM2.5浓度变化明显降低.另外, 本研究结果也表明, 当地面PM2.5浓度超过约100 μg·m-3后, ARI效应引起的PM2.5浓度变化明显增大, 这可能与京津冀区域地面PM2.5浓度超过一定的阈值(100 μg·m-2)时不利气象条件与PM2.5累积之间的双向反馈被有效激活有关, 从而导致气象条件进一步恶化, PM2.5浓度急剧增加(张小曳等, 2019; Zhong et al., 2019).
 |
| 图 5 2013年(a)和2017年(b)京津冀区域ARI效应引起的PM2.5浓度增加与区域日平均地面PM2.5浓度(基准情景BASE模拟结果)之间的关系 Fig. 5 The relationships of PM2.5 concentration changes caused by the ARI effect versus the regional average daily surface PM2.5 concentrations (model results from BASE of Baseline scenario) in the Beijing-Tianjin-Hebei region in 2013 (a) and 2017 (b) |
由此可见, 有效的污染控制可以进一步减轻气溶胶污染, ARI效应可以使排放控制措施在重污染条件下更加有效, 获得额外的空气质量改善效益(Zhou et al., 2019), 而持续加剧的气溶胶污染可能导致PM2.5浓度的额外增加.在京津冀区域霾污染高发季节, 减少污染物的区域排放和传输, 将地面PM2.5浓度控制在达到触发双向反馈机制的阈值以下, 对于减少该区域内的持续强霾污染至关重要.
4 结论(Conclusions)研究发现, “大气十条”实施后ARI对PM2.5质量浓度的增强效应明显减弱, ARI效应的减弱导致2017年冬、春、夏和秋季全国月平均PM2.5浓度相较2013年分别下降了7.2、1.1、1.1和1.8 μg·m-3, 分别占各季节同比PM2.5浓度总降幅的12.1%、6.7%、6.3%和6.1%;导致2017年全国年平均PM2.5浓度相较2013年下降了2.7 μg·m-3, 占PM2.5浓度总降幅的9.1%.在这一过程中污染减排起了主导作用, 约占ARI效应减弱导致全国年平均PM2.5浓度下降的88%, 气象条件变化的贡献约占12%.ARI效应的减弱对京津冀区域PM2.5浓度的影响最为显著, 使得2017年冬季区域月平均PM2.5浓度相较2013年下降了8.2 μg·m-3, 占该区域冬季PM2.5浓度总降幅的14.8%, 区域年平均PM2.5浓度相较2013年下降了2.8 μg·m-3, 占该区域PM2.5浓度总降幅的9.9%.ARI效应的减弱对长三角和珠三角区域冬季PM2.5浓度总降幅的贡献则分别为4.0 μg·m-3(8.9%)和3.1 μg·m-3(16.8%). “大气十条”的实施降低了ARI效应对京津冀区域冬季污染天气的影响程度, 2013年1月和2017年1月ARI效应使得区域月平均PM2.5浓度分别增加了17.6 μg·m-3和9.4 μg·m-3, 增加百分比分别为9.7%和7.2%;使得强霾事件期间区域日平均PM2.5浓度峰值分别增加了47.6 μg·m-3(20.9%)和33.7 μg·m-3(12.4%).研究表明“大气十条”实施后ARI对PM2.5质量浓度的增强效应明显减弱, 从而进一步推动了全国及重点区域PM2.5浓度的下降, 带来了额外的空气质量改善效益.
Chen D, Liu Z, Fast J, et al. 2016. Simulations of sulfate-nitrate-ammonium (SNA) aerosols during the extreme haze events over northern China in October 2014[J]. Atmospheric Chemistry and Physics, 16(16): 10707-10724. DOI:10.5194/acp-16-10707-2016 |
Chen F, Dudhia J. 2001. Coupling an advanced land surface-hydrology model with the Penn State-NCAR MM5 modeling system. Part Ⅰ:Model implementation and sensitivity[J]. Monthly Weather Review, 129(4): 569-585. DOI:10.1175/1520-0493(2001)129<0569:CAALSH>2.0.CO;2 |
Chen L, Zhu J, Liao H, et al. 2019. Assessing the formation and evolution mechanisms of severe haze pollution in Beijing-Tianjin-Hebei region using process analysis[J]. Atmospheric Chemistry and Physics, 19: 10845-10864. DOI:10.5194/acp-19-10845-2019 |
Cheng J, Su J, Cui T, et al. 2019a. Dominant role of emission reduction in PM2.5 air quality improvement in Beijing during 2013-2017:A model-based decomposition analysis[J]. Atmospheric Chemistry and Physics, 19: 6125-6146. DOI:10.5194/acp-19-6125-2019 |
Cheng N, Cheng B, Li S, et al. 2019b. Efects of meteorology and emission reduction measures on air pollution in Beijing during heating seasons[J]. Atmospheric Pollution Research, 10: 971-979. DOI:10.1016/j.apr.2019.01.005 |
Chin M, Rood R B, Lin S J, et al. 2000. Atmospheric sulfur cycle simulated in the global model GOCART:Model description and global properties[J]. Journal of Geophysical Research Atmosphere, 105: 24671-24687. DOI:10.1029/2000JD900384 |
Dang R, Liao H. 2019. Severe winter haze days in the Beijing-Tianjin-Hebei region from 1985-2017 and the roles of anthropogenic emissions and meteorology[J]. Atmospheric Chemistry and Physics, 19: 10801-10806. DOI:10.5194/acp-19-10801-2019 |
Ding A, Huang X, Nie W, et al. 2016. Enhanced haze pollution by black carbon in megacities in China[J]. Geophysical Research Letters, 43(6): 2873-2879. DOI:10.1002/2016GL067745 |
Ding D, Xing J, Wang S, et al. 2019. Estimated contributions of emissions controls, meteorological factors, population growth, and changes in baseline mortality to reductions in ambient PM2.5 and PM2.5-related mortality in China, 2013-2017[J]. Environmental Health Perspectives, 127(6): 067009. DOI:10.1289/EHP4157 |
Emmons L K, Walters S, Hess P G, et al. 2010. Description and evaluation of the model for ozone and related chemical tracers, version 4 (MOZART-4)[J]. Geoscientific Model Development, 3(1): 43-67. DOI:10.5194/gmd-3-43-2010 |
Gao M, Liu Z, Wang Y, et al. 2017. Distinguishing the roles of meteorology, emission control measures, regional transport, and co-benefits of reduced aerosol feedbacks in "APEC Blue"[J]. Atmospheric Environment, 167: 476-486. DOI:10.1016/j.atmosenv.2017.08.054 |
Gao Y, Zhang M, Liu Z, et al. 2015. Modeling the feedback between aerosol and meteorological variables in the atmospheric boundary layer during a severe fog-haze event over the North China Plain[J]. Atmospheric Chemistry and Physics, 15(8): 4279-4295. DOI:10.5194/acp-15-4279-2015 |
Ginoux P, Chin M, Tegen I, et al. 2001. Sources and distributions of dust aerosols simulated with the GOCART model[J]. Journal of Geophysical Research:Atmospheres, 106(D17): 20255-20273. DOI:10.1029/2000JD000053 |
Grell G A, Freitas S R. 2014. A scale and aerosol aware stochastic convective parameterization for weather and air quality modeling[J]. Atmospheric Chemistry and Physics, 14(10): 5233-5250. DOI:10.5194/acp-14-5233-2014 |
Guenther A, Karl T, Harley P, et al. 2006. Estimates of global terrestrial isoprene emissions using MEGAN (Model of Emissions of Gases and Aerosols from Nature)[J]. Atmospheric Chemistry and Physics, 6(11): 3181-3210. DOI:10.5194/acp-6-3181-2006 |
Hong S, Noh Y, Dudhia J. 2006. A new vertical diffusion package with an explicit treatment of entrainment processes[J]. Monthly Weather Review, 134(9): 2318-2341. DOI:10.1175/MWR3199.1 |
Iacono M J, Delamere J S, Mlawer E J, et al. 2008. Radiative forcing by long-lived greenhouse gases:Calculations with the AER radiative transfer models[J]. Journal of Geophysical Research:Atmospheres, 113(D13). DOI:10.1029/2008JD009944 |
Kuniyal J C, Guleria R P. 2019. The current state of aerosol-radiation interactions:A mini review[J]. Journal of Aerosol Science, 130: 45-54. DOI:10.1016/j.jaerosci.2018.12.010 |
Li M, Zhang Q, Kurokawa J, et al. 2017a. MIX:a mosaic Asian anthropogenic emission inventory under the international collaboration framework of the MICS-Asia and HTAP[J]. Atmospheric Chemistry and Physics, 17(2): 935-963. DOI:10.5194/acp-17-935-2017 |
Li Z, Guo J, Ding A, et al. 2017. Aerosol and boundary-layer interactions and impact on air quality[J]. National Science Review, 6: 810-833. |
Lin Y, Farley R D, Orville H D. 1983. Bulk parameterization of the snow field in a cloud model[J]. Journal of Climate and Applied Meteorology, 22(6): 1065-1092. DOI:10.1175/1520-0450(1983)022<1065:BPOTSF>2.0.CO;2 |
Liu Q, Jia X, Quan J, et al. 2018. New positive feedback mechanism between boundary layer meteorology and secondary aerosol formation during severe haze events[J]. Scientific Reports, 8: 6095. DOI:10.1038/s41598-018-24366-3 |
Liu X, Zhang Y, Zhang Q, et al. 2016. Application of online-coupled WRF/Chem-MADRID in East Asia:Model evaluation and climatic effects of anthropogenic aerosols[J]. Atmospheric Environment, 124: 321-336. DOI:10.1016/j.atmosenv.2015.03.052 |
Petäjä T, Järvi L, Kerminen V M, et al. 2016. Enhanced air pollution via aerosol-boundary layer feedback in China[J]. Scientific Reports, 6: 18998. DOI:10.1038/srep18998 |
Sun J, Liang M, Shi Z, et al. 2019. Investigating the PM2.5 mass concentration growth processes during 2013-2016 in Beijing and Shanghai[J]. Chemosphere, 221: 452-463. DOI:10.1016/j.chemosphere.2018.12.200 |
Vu T, Shi Z, Cheng J, et al. 2019. Assessing the impact of Clean Air Action Plan on air quality trends in Beijing using a machine learning technique[J]. Atmospheric Chemistry and Physics, 19: 11303-11314. DOI:10.5194/acp-19-11303-2019 |
Wang H, Peng Y, Zhang X, et al. 2018. Contributions to the explosive growth of PM2.5 mass due to aerosol-radiation feedback and decrease in turbulent diffusion during a red alert heavy haze in Beijing-Tianjin-Hebei, China[J]. Atmospheric Chemistry and Physics, 18: 17717-17733. DOI:10.5194/acp-18-17717-2018 |
Wang J, Wang S, Jiang J, et al. 2014a. Impact of aerosol-meteorology interactions on fine particle pollution during China's severe haze episode in January 2013[J]. Environmental Research Letter, 9(9): 094002. DOI:10.1088/1748-9326/9/9/094002 |
Wang Z, Li J, Wang Z, et al. 2014. Modeling study of regional severe hazes over mid-eastern China in January 2013 and its implications on pollution prevention and control[J]. Science China:Earth Sciences, 57(1): 3-13. DOI:10.1007/s11430-013-4793-0 |
Wild O, Zhu X, Prather M. 2000. Fast-J:Accurate simulation of in-and below-cloud photolysis in tropospheric chemical models[J]. Journal of Atmospheric Chemistry, 37(3): 245-282. DOI:10.1023/A:1006415919030 |
Wu J, Bei N, Hu B, et al. 2019. Aerosol-radiation feedback deteriorates the wintertime haze in the North China Plain[J]. Atmospheric Chemistry and Physics, 19: 8703-8719. DOI:10.5194/acp-19-8703-2019 |
Xing J, Wang J, Mathur R, et al. 2016. Unexpected benefits of reducing aerosol cooling effects[J]. Environmental Science & Technology, 50(14): 7527-7534. |
Yang X, Zhao C, Guo J, et al. 2016. Intensification of aerosol pollution associated with its feedback with surface solar radiation and winds in Beijing[J]. Journal of Geophysical Research:Atmospheres, 121: 4093-4099. DOI:10.1002/2015JD024645 |
Yang Y, Liu X, Qu Y, et al. 2015. Characteristics and formation mechanism of continuous hazes in China:a case study during the autumn of 2014 in the North China Plain[J]. Atmospheric Chemistry and Physics, 15: 8165-8178. DOI:10.5194/acp-15-8165-2015 |
Zaveri R A, Peters L K. 1999. A new lumped structure photochemical mechanism for large-scale applications[J]. Journal of Geophysical Research:Atmospheres, 104(D23): 30387-30415. DOI:10.1029/1999JD900876 |
Zaveri R A, Easter R C, Fast J D, et al. 2008. Model for simulating aerosol interactions and chemistry (MOSAIC)[J]. Journal of Geophysical Research:Atmospheres, 113(D13204). |
Zhai S, Jacob D J, Wang X, et al. 2019. Fine particulate matter (PM2.5) trends in China, 2013-2018:Separating contributions from anthropogenic emissions and meteorology[J]. Atmospheric Chemistry and Physics, 19: 11031-11041. DOI:10.5194/acp-19-11031-2019 |
Zhang B, Wang Y, Hao J. 2015. Simulating aerosol-radiation-cloud feedbacks on meteorology and air quality over eastern China under severe haze conditions in winter[J]. Atmospheric Chemistry and Physics, 15(5): 2387-2404. DOI:10.5194/acp-15-2387-2015 |
Zhang H, Cheng S, Li J, et al. 2019. Investigating the aerosol mass and chemical components characteristics and feedback effects on the meteorological factors in the Beijing-Tianjin-Hebei region, China[J]. Environmental Pollution, 244: 495-502. DOI:10.1016/j.envpol.2018.10.087 |
Zhang Q, Zheng Y, Tong D, et al. 2019. Drivers of improved PM2.5 air quality in China from 2013 to 2017[J]. Proceedings of the National Academy of Sciences, 116(49): 201907956. |
张小曳, 徐祥德, 丁一汇, 等. 2019. 2013-2017年气象条件变化对中国重点地区PM2.5质量浓度下降的影响[J]. 中国科学:地球科学: 49. DOI:10.1360/N072018-00303 |
Zhang X, Zhang Q, Hong C, et al. 2018. Enhancement of PM2.5 concentrations by aerosol-meteorology interactions over China[J]. Journal of Geophysical Research:Atmospheres, 123: 1179-1194. DOI:10.1002/2017JD027524 |
Zhang Y, Zhang X, Wang K, et al. 2016. Application of WRF/Chem over East Asia:Part Ⅱ. Model Improvement and Sensitivity Simulations[J]. Atmospheric Environment, 124: 285-300. DOI:10.1016/j.atmosenv.2015.07.022 |
Zhao B, Liou K, Gu Y, et al. 2017. Enhanced PM2.5 pollution in China due to aerosol-cloud interactions[J]. Scientific Reports, 7: 4453. DOI:10.1038/s41598-017-04096-8 |
Zheng B, Tong D, Li M, et al. 2018. Trends in China's anthropogenic emissions since 2010 as the consequence of clean air actions[J]. Atmospheric Chemistry and Physics, 18: 14095-14111. DOI:10.5194/acp-18-14095-2018 |
Zheng Y, Xue T, Zhang Q, et al. 2017. Air quality improvements and health benefits from China's clean air action since 2013[J]. Environmental Research Letters, 12: 114020. DOI:10.1088/1748-9326/aa8a32 |
Zhong J, Zhang X, Wang Y, et al. 2018a. Heavy aerosol pollution episodes in winter Beijing enhanced by radiative cooling effects of aerosols[J]. Atmospheric Research, 209: 59-64. DOI:10.1016/j.atmosres.2018.03.011 |
Zhong J, Zhang X, Dong Y, et al. 2018b. Feedback effects of boundary-layer meteorological factors on cumulative explosive growth of PM2.5 during winter heavy pollution episodes in Beijing from 2013 to 2016[J]. Atmospheric Chemistry and Physics, 18: 247-258. DOI:10.5194/acp-18-247-2018 |
Zhong J, Zhang X, Wang Y, et al. 2019. The two-way feedback mechanism between unfavorable meteorological conditions and cumulative aerosol pollution in various haze regions of China[J]. Atmospheric Chemistry and Physics, 19: 3287-3306. DOI:10.5194/acp-19-3287-2019 |
Zhou D, Ding K, Huang X, et al. 2018. Transport, mixing and feedback of dust, biomass burning and anthropogenic pollutants in eastern Asia:a case study[J]. Atmospheric Chemistry and Physics, 18: 16345-16361. DOI:10.5194/acp-18-16345-2018 |
Zhou M, Zhang L, Chen D, et al. 2019. The impact of aerosol-radiation interactions on the effectiveness of emission control measures[J]. Environmental Research Letter, 14: 024002. DOI:10.1088/1748-9326/aaf27d |