2. 天津市环境监测中心, 天津 300191
2. Tianjin Environmental Monitoring Center Station, Tianjin 300191
碳组分是环境受体中PM2.5(空气动力学当量直径≤2.5 μm的大气颗粒物)的重要组分, 约占到PM2.5质量的10%~70%(Turpin et al., 2000; Pöschl, 2005), 主要包括元素碳(EC)和有机碳(OC).EC主要来源于化石燃料、生物质等的不完全燃烧;而OC来源较为复杂, 既包括污染源如化石燃料、机动车、生物质等产生的一次有机碳(POC), 又包括由气态前体物经复杂的气-固转化而生成的二次有机碳(SOC)(Cao et al., 2003).颗粒物中的碳组分对环境质量(Cao et al., 2007; Huang et al., 2014)、大气能见度(Offenberg et al., 2000; 邹长伟等, 2006)、人体健康(Valavanidis et al., 2008; Cao et al., 2012)、气候变化(Jacobson, 2001; Menon et al., 2002)等有显著影响.
近年来, 热/光碳分析仪已被广泛用于OC与EC的定量测定(Park et al., 2002; Li et al., 2015; Wang et al., 2017), 其原理是依据OC与EC在不同温度下的优先氧化顺序将其分离成OC1~OC4、EC1~EC3.同时, OP(OC在碳化过程中会形成的裂解碳)由非分散红外法(NDIR)定量, 最终计算得到OC、EC、Char-EC和Soot-EC.Han等(2007)指出, Char-EC为燃料燃烧后固体残渣中的EC, 而Soot-EC为燃烧后气相挥发物质再凝结形成的EC.很多研究通过各碳组分的标识特征来定性判定OC、EC的潜在来源, 如生物质燃烧样品中OC1较为丰富(张灿等, 2014), OC3和OC4为道路尘中丰富的碳组分(曹军骥等, 2005).机动车中EC1~EC3含量较高, OC2可以作为燃煤样品的标识组分等(Watson et al., 1994; Kim et al., 2004).Char-EC值可能受燃煤排放和机动车的影响较多(Han et al., 2009; Liu et al., 2017).另外, 各碳组分间的相关性一定程度上也能反映各碳组分来源之间的关系(Liu et al., 2017; 史国良等, 2016).然而, 目前碳组分方面的研究主要集中在OC和EC污染特征(Park et al., 2002; Li et al., 2015; Wang et al., 2017)、SOC浓度估算(Na et al., 2004; 黄虹等, 2005; 王杨君等, 2010), 及水溶性有机碳浓度特征等方面(Zappoli et al., 1999; Pathak et al., 2011; 陶俊等, 2011), 而针对碳气溶胶源类的识别及定量解析方面的研究仍然有限.
一些研究利用碳组分比值识别来源(Cao et al., 2005; Cao et al., 2006; Liu et al., 2016).如Safai等(2014)、李立伟等(2017)根据OC/EC比值定性分析碳组分主要来源.相关研究发现, Char-EC/Soot-EC为11.6时指示生物质燃烧源的排放, 为0.6时指示机动车排放源, 低于2.0时为燃煤源(Chow et al., 2004; Cao et al., 2005).Han等(2009)分析了我国14个城市颗粒物中Char-EC/Soot-EC比值, 发现该比值在碳气溶胶来源识别方面比OC/EC比值更有效.Liu等(2017)利用Char-EC/Soot-EC比值定性分析生物质燃烧可能是海口市碳气溶胶的主要来源之一;张家营等(2017)基于Char-EC/Soot-EC比值发现, 菏泽市冬季大气颗粒物中的碳组分主要受燃煤及生物质燃烧的影响.但这些方法存在较大不确定性, 如OC/EC比值会受到二次气溶胶等影响(包贞等, 2009), 而且比值方法仅能对大气颗粒物碳组分来源进行定性解析.为此, 一些研究通过受体模型如主成分分析(PCA)、PMF、CMB等解析碳组分的来源(Zhang et al., 2002; Kim et al., 2004; Cao et al., 2005), 其中PMF模型因具有无需输入源谱、方便缺失数据处理等优点, 一些研究尝试利用其进行碳组分的定性、定量的来源解析(Wang et al., 2015; 田鹏山等, 2016; Liu et al., 2017; 张家营等, 2017), 但相关研究仍然是有限的.
天津市是京津冀大气污染传输通道城市之一[http://dqhj.mep.gov.cn/dtxx/201703/t20170323_408663.shtml], 2016年环境受体中PM2.5年均浓度达到69 μg·m-3, 约为国家环境空气质量年二级标准(35 μg·m-3)的2倍, 大气污染形势较为严峻.另外, 作为北方重要的工业城市, 2015年天津市煤炭消耗量约4500×104 t, 化石燃料的使用导致大量碳气溶胶排入大气中, 对京津冀地区的污染物排放不容忽视(黄鹤等, 2011; Liu et al., 2016).本研究于2016年2月和8月, 在天津市城区共设置6个采样点位采集PM2.5样品, 采用热/光碳分析仪对夏、冬两季PM2.5中碳组分进行测定分析, 探讨碳组分时空分布、相关性及比值特征, 利用PMF模型定性、定量解析PM2.5中碳组分主要来源, 以期为天津市区碳气溶胶的污染防治提供科学依据.
2 材料与方法(Materials and methods) 2.1 样品采集根据天津市污染源排放及功能分区, 本研究在天津市区设置6个采样点位(南京路、南口路、大直沽、前进道、勤俭道、复康路)(图 1和表 1)每天同步采集PM2.5样品.采集时间为2016年2月22日—3月22日(冬季)和2016年8月15日—9月5日(夏季), 每次采样时长为23 h(当日10:00—次日9:00).采样仪器选用TH-150AⅡ智能中流量采样器(武汉天虹智能仪表厂)加载PM2.5切割头, 流量设定为100 L·min-1.采样滤膜为石英滤膜(φ90 mm, Pallflex), 采样前将滤膜置于马弗炉中600 ℃下灼烧4 h, 以除去滤膜中挥发性组分.灼烧后的滤膜冷却至室温取出, 为降低湿度和温度对其影响, 于恒温(20±1) ℃恒湿(50%±5%)环境中平衡72 h后再使用电子天平(Mettler Toledo, AX205型, ±0.01 mg)进行称量, 每张滤膜均称重两次取均值, 两次误差低于50 μg.采样后滤膜需用滤膜纸包裹避光, 在-4 ℃条件下保存等待分析.采样期间气象数据由中国气象数据网提供(表 2).
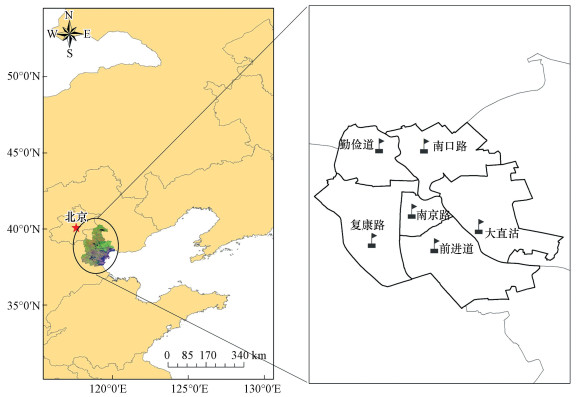 |
| 图 1 采样点位示意 Fig. 1 Locations of sampling sites |
| 表 1 天津市区PM2.5采样点位情况 Table 1 Descriptions of PM2.5 sampling sites in Tianjin city |
| 表 2 采样期间气象参数 Table 2 Meteorological parameters during the sampling period |
OC、EC通过美国沙漠研究所的DRI2001A型碳分析仪进行定量测定(Liu et al., 2015; 李立伟等, 2017), 使用IMPROVE A升温程序.石英膜上的样品在氦气的非氧化环境中, 分别在140 ℃(OC1)、280 ℃(OC2)、480 ℃(OC3)和580 ℃(OC4)逐级升温, 对0.558 cm2的滤膜片进行加热, 经MnO2催化, 滤膜上OC转化为CO2.此后, 样品又在氦气/氧气混和气(He/O2)环境中, 分别于580 ℃(EC1)、740 ℃(EC2)、840 ℃(EC3)逐级升温, 该过程中EC被氧化分解为CO2.通过非分散红外法(NDIR)定量检验.为检测OC在碳化过程中会形成裂解碳(OP)的生成量, 采用633 nm的氦-氖激光全程检测滤膜光强的变化, 从而明确指示出OC和EC的分离点.根据IMPROVE A协议:OC=OC1+OC2+OC3+OC4+OP;EC=EC1+EC2+EC3-OP;Char-EC=EC1-OP;Soot-EC=EC2+EC3, 计算出OC、EC、Char-EC、Soot-EC的含量.
2.3 PMF模型PMF模型是美国EPA官方推荐受体模型之一(Norris et al., 2014).PMF因其具有无需输入源谱、可处理缺失数据等优点被广泛利用在源解析研究中(Tian et al., 2014; Titos et al., 2014; Liu et al., 2015).PMF模型利用权重计算出颗粒物中碳组分误差, 再由最小二乘法对采样数据进行分解, 将原始矩阵n×m的X(i×j)矩阵分解成源贡献矩阵G(i×k)、源成分谱矩阵F(k×j)和残差矩阵E(i×j), 表达式为:

|
(1) |
式中, Xij表示i样品中的第j个化学成分的浓度, p为源类个数, i为受体样本, j为物种, k为污染源数, fkj是j组分在源类k中的百分占比(非负值), gik是源类k对样品i的贡献(非负值), eij为第i个受体中第j种组分的残差(Paatero, 1997).
PMF模型目标就是利用共轭梯度算法寻求目标函数Q值最小化的解, 从而确定污染源贡献谱G和污染源成分谱F.目标函数Q表达式如下:

|
(2) |
式中, μij为第i个受体中第j种组分的不确定度, 详见Paatero等(1993)、Norris等(2014)研究.
本研究使用EPA(美国国家环境保护局)PMF 5.0模型对天津市区夏季和冬季大气PM2.5中碳组分进行来源解析.经多次程序运行, 测试不确定性参数和调整因子数以确保最小目标函数值和残差矩阵值, 并结合本地排放源清单和实地调查结果, 最终识别得到4类排放因子.将实测TC浓度与模型拟合TC浓度进行相关性分析(图 2), 夏季和冬季的拟合优度分别为0.81、0.99, 拟合值与实测值接近;并且夏季(Qture:202)和冬季(Qture:219)的PMF计算所得目标函数值Qture值均接近理论Qexp值(Qexp夏:159;Qexp冬:224).因此, PMF解析结果是合理的.
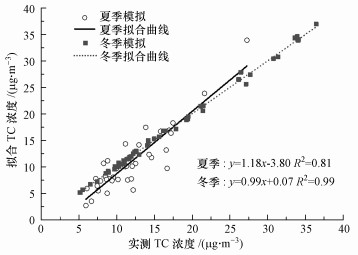 |
| 图 2 采样期间实测TC浓度与PMF拟合TC浓度的相关性回归 Fig. 2 Correlations between measured and reconstructed total carbon mass concentrations from PMF during the sampling period |
由于SOC较难直接定量求得, EC示踪法常被用于SOC估算, 常采用OC/EC最小比值法来定量估算OC中SOC的含量(刘新民等, 2002; Lin et al., 2009), 计算方法如下:

|
(3) |
式中, OCtot为实际测得的总有机碳浓度(μg·m-3);(OC/EC)min为采样期内观测到的OC/EC最小值, 本研究中根据OC、EC散点图, 取OC/EC较小点的平均值作为(OC/EC)min(图 3);这些比值最小点散布于整个采样期间, 故利用这些比值最小的散点计算(OC/EC)min具有代表性.由此得到夏季(OC/EC)min为1.34;冬季(OC/EC)min为2.24.
 |
| 图 3 OC、EC散点图 Fig. 3 Scatter plot of OC and EC concentrations in PM2.5 samples |
两次采样时段各采集2个现场空白样和3个平行样品, 其中将现场空白样中测定的OC、EC平均值作为样品本底值扣除(Cabada et al., 2004), 本研究采集的4个空白样本底值均小于实际样品的5%;平行样品用于采样现场和后续实验分析的全过程质量控制, 采集的6个平行样品OC和EC含量相对偏差控制在±10%.每批次样品分析之前均采用CH4/He标准气体(体积比为1:19)进行仪器校正, 相对标准偏差不超过5%;每次10%样品进行重复分析.
3 结果与讨论(Results and discussion) 3.1 碳组分时空变化特征采样期间, 天津市区大气PM2.5中OC、EC质量浓度如图 4所示.夏季PM2.5中OC平均浓度为(7.5±3.0) μg·m-3, 占PM2.5的11.7%±4.1%.相比于夏季, 冬季OC的浓度和占比较高, 分别为(13.1±7.0) μg·m-3和13.9%±2.8%.其中冬季OC浓度为夏季的1.7倍, 这可能与冬季的燃煤取暖密切相关(http://www.tianqi.com/news/160450.html).另外, 冬季不利的气象条件(表 2), 如地表温度低, 近地面大气易形成上暖下冷的逆温现象, 加上地面风速较低, 使得污染物积累不易扩散;但夏季大气稳定性差, 污染物扩散条件好.采样期间, OC浓度表现出一定季节差异性, 而EC浓度的季节变化不明显(图 4).夏季和冬季EC浓度分别为(4.0±1.8)、(4.3±2.4) μg·m-3, 占PM2.5的6.1%±2.0%和4.6%±1.2%, 这可能与EC性质稳定, 不易受温度湿度的影响有关.但供暖期的煤炭消耗量增加也会使得EC浓度升高(刘泽珺等, 2017).
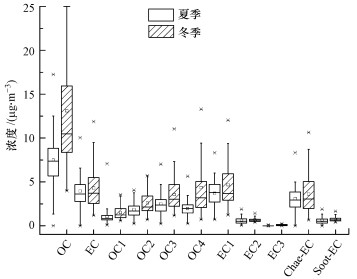 |
| 图 4 夏、冬季大气PM2.5中碳组分质量浓度 Fig. 4 Carbonaceous fractions concentrations during summer and winter |
与国内一些城市对比(表 3), 天津市区夏季OC浓度高于宁波(杜博涵等, 2015)、鞍山(张伟等, 2017)、海口(Liu et al., 2017), 低于上海(黄众思等, 2014)、成都(张智胜等, 2013);EC浓度除较成都(张智胜等, 2013)低外, 均高于其他几个城市.冬季OC浓度高于宁波(杜博涵等, 2015)、海口(Liu et al., 2017), 低于其他城市;EC浓度低于南京(Li et al., 2015)、成都(张智胜等, 2013)、菏泽(张家营等, 2017), 高于宁波(杜博涵等, 2015)和海口(Liu et al., 2017).因此, 天津市区PM2.5中OC、EC含量处于较高水平, 而各城市间OC、EC含量的差异也表明碳组分的污染程度与污染源排放强度、气象要素、区域影响等有关.
| 表 3 不同城市PM2.5中OC、EC、OC/EC对比 Table 3 The concentrations of OC and EC and the values of OC/EC in different cities in China |
从天津市区PM2.5中各碳组分构成来看(图 4和图 5), 夏季和冬季EC1浓度最高, 分别为(3.7±1.6)、(4.7±2.4) μg·m-3, EC1是汽车尾气中丰富的碳组分(Zhu et al., 2010), 表明汽车尾气可能对天津市区PM2.5中碳组分具有重要的贡献, 这与天津市区较高的机动车保有量有较大关系[http://www.tj.gov.cn/tj/tjgb/201703/t20170314_3588851.html];而EC1质量分数表现为夏季(32.3%)高于冬季(27.3%), 可能说明天津市区夏季碳组分受汽车尾气影响较大.OC3和OC4浓度较高, 两者浓度和的占比在夏季、冬季分别为38.2%、43.6%, 与南京(Li et al., 2015)、菏泽(张家营等, 2017)类似.Char-EC浓度在夏季为(3.1±1.4) μg·m-3, 低于冬季浓度(3.6±2.3) μg·m-3, 与北京、上海(Han et al., 2010)、海口(Liu et al., 2017)等类似, 冬季较高的Char-EC值可能受燃煤排放和机动车的影响较多(Han et al., 2009; Liu et al., 2017).OC1、EC2、EC3占比较低, 分别为8.7%~9.0%、4.4%~5.0%、0.1%~0.4%.
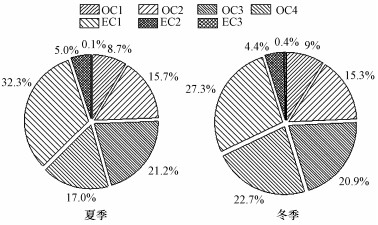 |
| 图 5 夏、冬季PM2.5中各碳组分质量分数 Fig. 5 Percentages eight carbon fractions in PM2.5 during summer and winter in Tianjin city |
天津市区采样期间碳组分空间分布特征如表 4所示.南口路采样点OC4(冬:(5.4±2.3) μg·m-3;夏:(2.5±1.2) μg·m-3)浓度均高于其他点位, 且EC1(冬:(6.3±2.0) μg·m-3;夏:(4.0±1.8) μg·m-3)、OC2(冬:(3.2±1.1) μg·m-3;夏:(1.8±0.8) μg·m-3)浓度较高.相比之下, 复康路OC2(冬:(2.2±1.0) μg·m-3;夏:(1.4±0.6) μg·m-3)、OC4(冬:(3.3±2.4) μg·m-3;夏:(1.5±0.8) μg·m-3)浓度均低于其他点位, EC1(冬:(3.7±2.3) μg·m-3;夏:(3.0±1.4) μg·m-3)浓度较低, 这与不同点位中颗粒物碳组分的来源不同有关.EC1可作为机动车尾气中标识组分(彭超等, 2015; Xu et al., 2016), OC2主要来源于燃煤源和机动车源排放(Cao et al., 2005; 彭超等, 2015), OC4在道路尘中含量丰富(Chow et al., 2004), 因此, 南口路作为工业和交通混合区, 机动车、燃煤等排放的碳质气溶胶较多, 且道路尘对其也有贡献;复康路为风景区, 受污染源影响较少.另外, Soot-EC(冬:0.5~1.0 μg·m-3;夏:0.4~0.8 μg·m-3)、EC2(冬:0.5~0.8 μg·m-3;夏:0.4~0.9 μg·m-3)各点位空间变化较小.
| 表 4 各采样点碳组分质量浓度 Table 4 The concentrations of carbonaceous fractions at different sampling sites in Tianjin during summer and winter |
研究认为, OC和EC的相关性可以从一定程度上定性分析大气颗粒物的来源.若其相关性好, 这说明其存在相似或共同的来源(Turpin et al., 1991; Yang et al., 2005).天津市区夏季和冬季PM2.5中各碳组分之间的相关性如表 5所示.由表可知, OC与EC相关性显著, 冬季二者相关系数为0.96(p<0.01), 夏季为0.83(p<0.01), 表明冬季PM2.5中OC和EC具有相似的来源;而夏季略低, 可能因为夏季中二次气溶胶的影响较为突出(安欣欣等, 2016).夏季和冬季中, EC1与OC1、OC2、OC3、OC4相关性显著(r=0.77~0.93, p<0.01), 表明机动车源、生物质等的不完全燃烧将排放有机碳和少部分的元素碳(Liu et al., 2017).冬季Char-EC与OC(r=0.94, p<0.01)、EC(r=0.98, p<0.01)相关性明显高于夏季(OC:r=0.44, p<0.01;EC:r=0.45, p<0.01);这可能与二者机理不同相关, Char-EC是燃烧后的固体残渣, 而Soot-EC是由于不完全燃烧形成的(Han et al., 2009).冬季碳组分中OC2、EC1均与OC和EC有较强的相关性, 结合3.1节OC2、EC1的标识特征, 可以说明天津市区冬季燃煤源和机动车源是PM2.5碳组分的重要来源.
| 表 5 天津市区夏季和冬季PM2.5中各碳组分相关性 Table 5 The correlations between carbonaceous fractions in PM2.5 in Tianjin during summer and winter |
采样期间, 天津市区夏季PM2.5中OC/EC平均值为1.9, 其中前进道最低(1.7), 勤俭道最高(2.2).冬季OC/EC平均值为3.0, 各采样点比值均显著高于夏季(t-检验, p < 0.01), 其中南口路最低(2.8), 前进道最高(3.4).一般OC/EC比值超过2时, 表明有SOC反应存在(Chow et al., 1996).通过OC/EC最小比值法估算得到的SOC发现(见1.4节), 天津市区夏季SOC的平均浓度为(2.6±1.4) μg·m-3, 占OC的33.5%±13.6%, PM2.5的4.2%±2.1%.冬季SOC的平均浓度高于夏季, 达到(3.5±2.5) μg·m-3, 占OC的26.6%±12.0%, PM2.5的3.7%±1.8%.这可能是因为冬季燃煤造成OC排放增加的同时也会排放有机气态污染物, 在不利的气象条件下(见3.1节), 易造成二次有机前体物积累, 使得SOC生成几率增加(Dan et al., 2004).但冬季SOC在OC的占比略低于夏季, 这与夏季温度较高的气象条件使得光化学反应强烈有关.
研究表明, OC/EC比值范围为2.7~23.8时表明燃煤排放(Watson et al., 2001; Zhang et al., 2008), 机动车尾气的比值约为1.0~4.2(Schauer et al., 1999a; Schauer et al., 1999b), 可推测天津供暖期燃煤排放一次污染物增加, 使得OC/EC比值升高.与其他城市相比(表 4), 天津市区夏季OC/EC值(1.9)与成都(2.1) (张智胜等, 2013)相近, 低于其他几个城市.冬季OC/EC比值(3.0)与宁波(3.2) (杜博涵等, 2015)、菏泽(2.9) (张家营等, 2017)接近, 低于鞍山(4.6) (张伟等, 2017)、杭州(5.3) (李立伟等, 2017).总体来看, 与国内一些城市类似, 燃煤和机动车排放对天津市区大气PM2.5中碳组分影响较大.
天津市区夏季PM2.5中Char-EC/Soot-EC的平均值为6.5, 高于冬季(4.9).研究指出Char-EC/Soot-EC为11.6时指示生物质燃烧源的排放, 为0.6时指示机动车排放源, 低于2.0时为燃煤源(Cao et al., 2005; Chow et al., 2004).因此, 天津市区碳组分可能受燃煤源、机动车排放源的影响.Char-EC/Soot-EC值的空间分布表明各点位差异性显著(t检验, p<0.05).其中复康路采样点夏季最高(7.7);南京路采样点冬季和夏季均为最低(冬季:4.6;夏季:2.1), 表明复康路可能受生物质燃烧排放影响较大, 但该点位位于市内风景区, 极少受到生物质燃烧排放影响, 所以Char-EC/Soot-EC比值来判定来源具有较大不确定性(Kim et al., 2004), 仍需结合PMF模型进一步讨论分析.
3.4 碳组分来源解析结果本文采用PMF模型解析出4类因子, 其成分谱如图 6所示.对于冬季PM2.5中的碳组分(图 6a), 因子1代表道路尘, 该因子中OC3(43.8%)、OC4(74.9%)含量较高(Chow et al., 2004);因子2中EC2(45.5%)和EC3(98.7%)占比均较高, 将其识别为柴油车(Hamilton et al., 1991; Turpin et al., 1995; Cao et al., 2005);因子3中EC1(45.3%)含量最高, 其次为OC2(15.1%), OC3(13.6%)、OC1(10.2%)也较高, 标识该因子所对应的污染源为汽油车(Watson et al., 1994; Kim et al., 2004; Cao et al., 2005);因子4中OC1含量最高(50.5%), OC2(37.6%)、OC3(30.7%)也较高, 将其识别为燃煤和生物质排放(Kim et al., 2004; Cao et al., 2005; Zhu et al., 2010; Xu et al., 2016).夏季PM2.5中的碳组分的4个因子的标识组分类似于冬季(图 6b), 分别代表燃煤和生物质排放、柴油车、汽油车、道路尘.
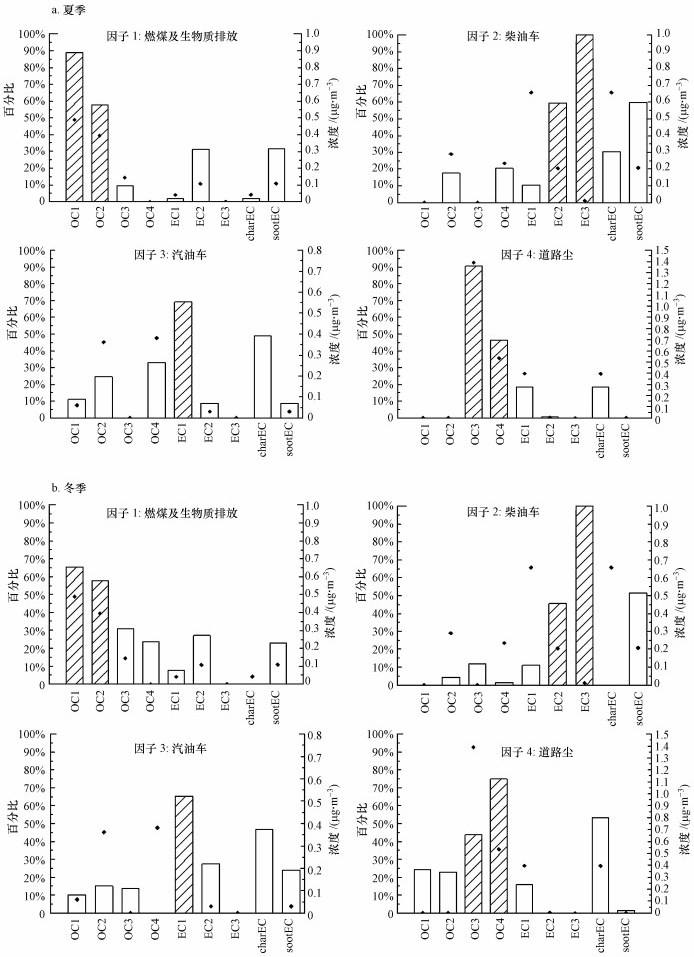 |
| 图 6 PMF解析天津市区夏季(a)和冬季(b) PM2.5中碳组分不同来源成分谱 Fig. 6 Source profiles obtained with the PMF for carbonaceous species in PM2.5 during summer and winter in Tianjin |
PMF计算出的天津市区夏季和冬季大气PM2.5中碳组分的4类源类的分担率如图 7所示.可以看出, 燃煤源及生物质排放、汽油车对冬季PM2.5中碳组分的分担率最大, 分别为41.3%和18.1%.其次为道路尘对PM2.5中碳组分的分担率, 为16.3%, 柴油车略低于道路尘, 分担率为15.5%.夏季燃煤源及生物质排放分担率(35.4%)较冬季显著下降, 表明冬季碳组分受到采暖期燃煤量增加的影响较大.相应地, 汽油车(20.5%)、柴油车(16.4%)分担率较冬季有所上升, 道路尘分担率为14.4%.另外, 本研究的PMF模型解析结果也存在一些不确定性和局限性, 如缺乏SOC标识因子使得SOC对碳组分的贡献难以定量, 被随机分配到各因子中(Liu et al., 2017);较难识别出一些复杂排放源如餐饮油烟、垃圾燃烧等(史国良等, 2016; Liu et al., 2017).综上所述, 天津市区大气PM2.5中碳组分来自燃煤及生物质燃烧混合源、柴油车、汽油车、道路尘.
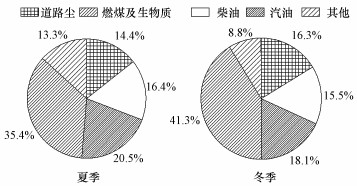 |
| 图 7 PMF模型解析各类源对天津市区夏季和冬季PM2.5中碳组分的分担率 Fig. 7 Source apportionment of carbonaceous species of PM2.5 during summer and winter in Tianjin |
近年来, 很多城市针对碳组分来源都开展了相关研究.Cao等(2005)认为汽油车(44%~73%)、燃煤(44%)、柴油车(3%~23%)及生物质燃烧(4%~9%)是西安大气颗粒物碳组分的主要来源;Liu等(2017)对海口市全年碳组分来源研究发现机动车排放、燃煤、生物质燃烧是主要来源, 其中机动车排放分担率为29.3%;田鹏山等(2016)研究表明, 燃煤是关中地区冬季碳气溶胶首要来源, 分担率占45.0%~47.9%;李立伟等(2017)发现杭州市冬季PM2.5中TC主要来源为燃煤、汽油车排放和道路尘, 其分担率为79.1%.以上可以看出, 城市颗粒物中碳组分主要来源有燃煤、机动车和生物质燃烧等, 而各城市中相同来源对碳组分的分担率并不一致, 这与城市的经济发展水平、能源和工业结构、人类活动水平密切相关(Liu et al., 2017).
4 结论(Conclusions)1) 天津市区夏季PM2.5中OC平均浓度为(7.5±3.0) μg·m-3, 占PM2.5的11.7%±4.1%.相比于夏季, 冬季OC的浓度和占比均增加, 分别为(13.1±7.0) μg·m-3和13.9%±2.8%;EC季节变化不明显, 夏季和冬季EC浓度分别为(4.0±1.8) μg·m-3、(4.3±2.4) μg·m-3, 占PM2.5的6.1%±2.0%和4.6%±1.2%.
2) 天津市区PM2.5中OC与EC在夏季(r=0.83, p<0.01)和冬季(r=0.96, p<0.01)的相关性均显著, 而冬季Char-EC与OC(r=0.94, p<0.01)、EC(r=0.98, p<0.01)相关性明显高于夏季(OC:r=0.44, p<0.01;EC:r=0.45, p<0.01).
3) 天津市区PM2.5中OC/EC平均值在夏季和冬季分别为1.9和3.0, 说明天津市碳组分可能受燃煤源、机动车排放源的影响;估算得到夏季SOC为(2.6±1.4) μg·m-3, 占OC的33.5%±13.6%;冬季为(3.5±2.5) μg·m-3, 占OC的26.6%±12.0%, 这与夏季和冬季的排放源和气象条件相关.
4) 天津市区夏季PM2.5中Char-EC/Soot-EC比值为6.5, 高于冬季(4.9);且Char-EC/Soot-EC比值空间差异性显著(t检验, p<0.05).
5) PMF解析结果表明, 天津市区大气PM2.5中碳组分主要来源于燃煤及生物质排放混合源、柴油车、汽油车、道路尘, 其对夏季PM2.5中碳组分分担率分别为35.4%、16.4%、20.5%、14.4%;对冬季碳组分分担率分别为41.3%、15.5%、18.1%、16.3%.可以看出, 燃煤和机动车是控制天津市区PM2.5中碳质组分的关键.
安欣欣, 张大伟, 冯鹏, 等. 2016. 北京城区夏季PM2.5中碳组分和二次水溶性无机离子浓度特征[J]. 环境化学, 2016, 35(4): 713–720.
|
包贞, 焦荔, 洪盛茂. 2009. 杭州市大气PM2.5中碳分布特征及来源分析[J]. 环境化学, 2009, 28(2): 304–305.
DOI:10.3321/j.issn:0254-6108.2009.02.032 |
曹军骥, 李顺诚, 李扬, 等. 2005. 2003年秋冬季西安大气中有机碳和元素碳的理化特征及其来源解析[J]. 自然科学进展, 2005, 15(12): 1460–1466.
DOI:10.3321/j.issn:1002-008X.2005.12.008 |
Cabada J C, Pandis S N, Subramian R, et al. 2004. Estimating the secondary organic aerosol contribution to PM2.5 using the EC tracer method[J]. Aerosol Science and Technology, 38(S1): 140–155.
|
Cao J J, Lee S C, Chow J C, et al. 2007. Spatial and seasonal distributions of carbonaceous aerosols over China[J]. Journal of Geophysical Research Atmospheres, 112(D22): 22–11.
|
Cao J J, Lee S C, Ho K F, et al. 2003. Characteristics of carbonaceous aerosol in Pearl River Delta Region, China during 2001 winter period[J]. Atmospheric Environment, 37: 1451–1460.
DOI:10.1016/S1352-2310(02)01002-6
|
Cao J J, Lee S C, Ho K F, et al. 2006. Characterization of roadside fine particulate carbon and its eight fractions in Hong Kong[J]. International Journal of Computers & Applications, 6(2): 106–122.
|
Cao J J, Wu F, Chow J C, et al. 2005. Characterization and source apportionment of atmospheric organic and elemental carbon during fall and winter of 2003 in Xi'an, China[J]. Atmospheric Chemistry and Physics, 5(11): 3127–3137.
DOI:10.5194/acp-5-3127-2005
|
Cao J J, Xu H, Xu Q, et al. 2012. Fine particulate matter constituents and cardiopulmonary mortality in a heavily polluted Chinese city[J]. Environmental Health Perspectives, 120(3): 373–378.
DOI:10.1289/ehp.1103671
|
Chow J C, Watson J G, Kuhns H D, et al. 2004. Source profiles for industrial, mobile, and area sources in the Big Bend Regional Aerosol Visibility and Observational (BRAVO) Study[J]. Chemosphere, 54(2): 185–208.
DOI:10.1016/j.chemosphere.2003.07.004
|
Chow J C, Watson J G, Lu Z, et al. 1996. Descriptive analysis of PM25, and PM10, at regionally representative locations during SJVAQS/AUSPEX[J]. Atmospheric Environment, 30(12): 2079–2112.
DOI:10.1016/1352-2310(95)00402-5
|
Dan M, Zhuang G, Li X, et al. 2004. The characteristics of carbonaceous species and their sources in PM2.5 in Beijing[J]. Atmospheric Environment, 38(21): 3443–3452.
DOI:10.1016/j.atmosenv.2004.02.052
|
杜博涵, 黄晓锋, 何凌燕, 等. 2015. 宁波市PM2.5中碳组分的时空分布特征和二次有机碳估算[J]. 环境科学, 2015(9): 3128–3134.
|
Hamilton R S, Mansfield T A. 1991. Airborne particulate elemental carbon:Its sources, transport and contribution to dark smoke and soiling[J]. Atmospheric Environment.part A.general Topics, 25(3/4): 715–723.
|
Han Y M, Cao J J, Chow J C, et al. 2007. Evaluation of using thermal/optical reflectance method to discriminate between soot-and char-EC[J]. Chemosphere, 69(4): 569–574.
DOI:10.1016/j.chemosphere.2007.03.024
|
Han Y M, Cao J J, Lee S C, et al. 2010. Different characteristics of char and soot in the atmosphere and their ratio as an indicator for source identification in Xi'an, China[J]. Atmospheric Chemistry and Physics, 10(2): 1487–1495.
|
Han Y M, Lee S C, Cao J J, et al. 2009. Spatial distribution and seasonal variation of Char-EC and Soot-EC in the atmosphere over China[J]. Atmospheric Environment, 43(38): 6066–6073.
DOI:10.1016/j.atmosenv.2009.08.018
|
Huang R J, Zhang Y, Bozzetti C, et al. 2014. High secondary aerosol contribution to particulate pollution during haze events in China[J]. Nature, 514(7521): 218–222.
DOI:10.1038/nature13774
|
黄鹤, 蔡子颖, 韩素芹, 等. 2011. 天津市PM10, PM2.5, PM1连续在线观测分析[J]. 环境科学研究, 2011, 24(8): 897–903.
|
黄虹, 李顺诚, 曹军骥, 等. 2005. 广州市夏季室内外PM2.5中有机碳, 元素碳的分布特征[J]. 环境科学学报, 2005, 25(9): 1242–1249.
DOI:10.3321/j.issn:0253-2468.2005.09.017 |
黄众思, 修光利, 朱梦雅, 等. 2014. 上海市夏冬两季PM2.5中碳组分污染特征及来源解析[J]. 环境科学与技术, 2014, 37(4): 124–129.
|
Jacobson M Z. 2001. Strong radiative heating due to the mixing state of black carbon in atmospheric aerosols[J]. Nature, 409(6821): 695–697.
DOI:10.1038/35055518
|
Kim E, Hopke P K, Edgeeton E S. 2004. Improving source identification of Atlanta aerosol using temperature resolved carbon fractions in positive matrix factorization[J]. Atmospheric Environment, 38(20): 3349–3362.
DOI:10.1016/j.atmosenv.2004.03.012
|
Li B, Zhang J, Zhao Y, et al. 2015. Seasonal variation of urban carbonaceous aerosols in a typical city Nanjing in Yangtze River Delta, China[J]. Atmospheric Environment, 106: 223–231.
DOI:10.1016/j.atmosenv.2015.01.064
|
Lin P, Hu M, Deng Z, et al. 2009. Seasonal and diurnal variations of organic carbon in PM2.5 in Beijing and the estimation of secondary organic carbon[J]. Journal of Geophysical Research-Atmospheres, 114(D2): 1013–1033.
|
Liu B S, Bi X H, Feng Y C, et al. 2016. Fine carbonaceous aerosol characteristics at a megacity during the Chinese Spring Festival as given by OC/EC online measurements[J]. Atmospheric Research, 181: 20–28.
DOI:10.1016/j.atmosres.2016.06.007
|
Liu B S, Song N, Dai Q L, et al. 2015. Chemical composition and source apportionment of ambient PM2.5, during the non-heating period in Taian, China[J]. Atmospheric Research, 170: 23–33.
|
李立伟, 戴启立, 毕晓辉, 等. 2017. 杭州市冬季环境空气PM2.5中碳组分污染特征及来源[J]. 环境科学研究, 2017, 30(3): 340–348.
|
Liu B S, Zhang J Y, Wang L, et al. 2017. Characteristics and sources of the fine carbonaceous aerosols in Haikou, China[J]. Atmospheric Research, 199: 103–112.
|
刘新民, 邵敏, 曾立民, 等. 2002. 珠江三角洲地区气溶胶中含碳物质的研究[J]. 环境科学, 2002, 23: 54–59.
|
刘泽珺, 吴建会, 张裕芬, 等. 2017. 菏泽市PM2.5碳组分季节变化特征[J]. 环境科学, 2017, 38(12): 4943–4950.
|
Menon S, Hansen J, Nazarenko L, et al. 2002. Climate effects of black carbon aerosols in China and India[J]. Science, 297: 2250–2253.
DOI:10.1126/science.1075159
|
Na K, Sawant A A, Song C, et al. 2004. Primary and secondary carbonaceous species in the atmosphere of Western Riverside County, California[J]. Atmospheric Environment, 38(9): 1345–1355.
DOI:10.1016/j.atmosenv.2003.11.023
|
Norris G, Duvall R. 2014. EPA Positive Matrix Factorization (PMF) 5. 0 Fundamentals and User Guide[R]. Washington DC: Environmental Protection Agency, 14-50
|
Offenberg J H, Baker J E. 2000. Aerosol size distributions of elemental and organic carbon in urban and over-water atmospheres[J]. Atmospheric Environment, 34(10): 1509–1517.
DOI:10.1016/S1352-2310(99)00412-4
|
Paatero P, Tapper U. 1993. Analysis of different modes of factor analysis as least squares fit problems[J]. Chemometrics and Intelligent Laboratory Systems, 18(2): 183–194.
DOI:10.1016/0169-7439(93)80055-M
|
Paatero P. 1997. Least squares formulation of robust non-negative factor analysis[J]. Chemometrics Intelligent Laboratory Systems, 37: 27–35.
|
Park S S, Kim Y J, Fung K. 2002. PM2.5 carbon mea PM2.5 carbon measurements in two urban areas:seoul and Kwangju, Korea[J]. Atmospheric Environment, 36: 1287–1297.
DOI:10.1016/S1352-2310(01)00552-0
|
Pathak R K, Wang T, Ho K F, et al. 2011. Characteristics of summertime PM2.5 organic and elemental carbon in four major Chinese cities:implications of high acidity for water-soluble organic carbon(WSOC)[J]. Atmospheric Environment, 45(2): 318–325.
DOI:10.1016/j.atmosenv.2010.10.021
|
Pöschl U. 2005. Atmospheric aerosols:Composition, transformation, climate and health effects[J]. Angewandte Chemie International Edition, 44(46): 7520–7540.
DOI:10.1002/(ISSN)1521-3773
|
彭超, 翟崇治, 王欢博, 等. 2015. 万州城区夏冬季PM2.5中有机碳和元素碳的浓度特征[J]. 环境科学学报, 2015, 35(6): 1638–1644.
|
Safai P D, Raju M P, Rao P S, et al. 2014. Characterization of carbonaceous aerosols over the urban tropical location and a new approach to evaluate their climate importance[J]. Atmospheric Environment, 92(1/2/3): 493–500.
|
Schauer J J, Kleeman M J, Cass G R, et al. 1999b. Measurement of emissions from air pollution sources.1.C1 through C29 organic compounds from meat charbroiling[J]. Environmental Science & Technology, 33(10): 1566–1577.
|
Schauer J J, Kleeman M J, Cass G R, et al. 1999a. Measurement of emissions from air pollution sources.2.C1 through C30 organic compounds from medium duty diesel trucks[J]. Environmental Science & Technology, 33(10): 1578–1587.
|
史国良, 陈刚, 田瑛泽, 等. 2016. 天津大气PM2.5中碳组分特征和来源分析[J]. 环境污染与防治, 2016, 38(1): 1–7.
|
陶俊, 柴发合, 朱李华, 等. 2011. 2009年春季成都城区碳气溶胶污染特征及其来源初探[J]. 环境科学学报, 2011, 31(12): 2756–2761.
|
田鹏山, 曹军骥, 韩永明, 等. 2016. 关中地区冬季PM2.5中碳气溶胶的污染特征及来源解析[J]. 环境科学, 2016, 37(2): 427–433.
|
Tian Y Z, Wang J, Peng X, et al. 2014. Estimation of the direct and indirect impacts of fireworks on the physicochemical characteristics of atmospheric PM10 and PM2.5[J]. Atmospheric Chemistry & Physics, 14(18): 9469–9479.
|
Titos G, Lysmsni H, Pandolfi M, et al. 2014. Identification of fine (PM1) and coarse (PM10-1) sources of particulate matter in an urban environment[J]. Atmospheric Environment, 89: 593–602.
DOI:10.1016/j.atmosenv.2014.03.001
|
Turpin B J, Huntzicker J J. 1995. Identification of secondary organic aerosol episodes and quantitation of primary and secondary organic aerosol concentrations during SCAQS[J]. Atmospheric Environment, 29(23): 3527–3544.
DOI:10.1016/1352-2310(94)00276-Q
|
Turpin B J, Saxena P, Andrews E. 2000. Measuring and simulating particulate organics in the atmosphere:Problems and prospects[J]. Atmospheric Environmental, 34: 2983–3013.
DOI:10.1016/S1352-2310(99)00501-4
|
Turpin B J, Huntaicker J J. 1991. Secondary formation of organic aerosol in the Los Angeles basin:a descriptive analysis of organic and elemental carbon concentrations[J]. Atmospheric Environment, 25(2): 207–215.
DOI:10.1016/0960-1686(91)90291-E
|
Valavanidis A, Fiotakis K, Vlachogianni T. 2008. Airborne particulate matter and human health:toxicological assessment and importance of size and composition of particles for oxidative damage and carcinogenic mechanisms[J]. Journal of Environmental Science & Health Part C Environmental Carcinogenesis Reviews, 26(4): 339–362.
|
Wang J Z, Ho S S H, Cao J J, et al. 2015. Characteristics and major sources of carbonaceous aerosols in PM2.5, from Sanya, China[J]. Science of the Totol Environment, 530/531: 110–119.
DOI:10.1016/j.scitotenv.2015.05.005
|
Wang Q, Jiang N, Yin S, et al. 2017. Carbonaceous species in PM2.5, and PM10, in urban area of Zhengzhou in China:Seasonal variations and source apportionment[J]. Atmospheric Research, 191: 1–11.
DOI:10.1016/j.atmosres.2017.02.003
|
Watson J G, Chow J C, Lowenthal D H. 1994. Differences in the carbon composition of source profiles for diesel-and gasoline powered vehicles[J]. Atmospheric Environment, 28(15): 2493–2505.
DOI:10.1016/1352-2310(94)90400-6
|
Watson J G, Chow J C, Houck J E. 2001. PM2.5 chemical source profiles for vehicle exhaust, vegetative burning, geological material, and coal burning in Northwestern Colorado during 1995[J]. Chemosphere, 43(8): 1141–1151.
DOI:10.1016/S0045-6535(00)00171-5
|
王杨君, 董亚萍, 冯加良., 等. 2010. 上海市PM2.5中含碳物质的特征和影响因素分析[J]. 环境科学, 2010, 31(8): 1755–1761.
|
Xu H M, Cao J J, Chow J C, et al. 2016. Inter-annual variability of wintertime PM2.5 chemical composition in Xi'an, China:evidences of changing source emissions[J]. Science of the Total Environment, 545-546: 546–555.
DOI:10.1016/j.scitotenv.2015.12.070
|
Yang F, He K, Ye B, et al. 2005. One-year record of organic and elemental carbon in fine particles in downtown Beijing and Shanghai[J]. Atmospheric Chemistry and Physics, 5(6): 1449–1457.
DOI:10.5194/acp-5-1449-2005
|
Zappoli S, Andracchio A, Fuzzi S, et al. 1999. Inorganic, organic and macromolecular components of fine aerosol in different areas of Europe in relation to their water solubility[J]. Atmospheric Environment, 33(17): 2733–2743.
DOI:10.1016/S1352-2310(98)00362-8
|
Zhang M, Cass G R, Schauer J J, et al. 2002. Source apportionment of PM2.5 in the Southeastern United States using solvent-extratable organic compounds as tracers[J]. Environmental Science & Technology, 36(11): 2361–2371.
|
Zhang Y X, Schauer J J, Zhang Y H, et al. 2008. Characteristics of particulate carbon emissions from real-world Chinese coal combustion[J]. Environmental Science & Technology, 42(14): 5068–5073.
|
Zhu C S, Chen C C, Cao J J, et al. 2010. Characterization of carbon fractions for atmospheric fine particles and nanoparticles in a highway tunnel[J]. Atmospheric Environment, 44(23): 2668–2673.
DOI:10.1016/j.atmosenv.2010.04.042
|
张灿, 周志恩, 翟崇治, 等. 2014. 基于重庆本地碳成分谱的PM2.5碳组分来源分析[J]. 环境科学, 2014, 35(3): 811–819.
|
张家营, 刘保双, 毕晓辉, 等. 2017. 菏泽市冬季大气PM2.5和PM10中碳组分来源解析[J]. 环境科学研究, 2017(11): 1670–1679.
|
张伟, 姬亚芹, 李金, 等. 2017. 鞍山市夏冬季PM2.5中碳组分化学特征及来源解析[J]. 中国环境科学, 2017, 37(5): 1657–1662.
DOI:10.3969/j.issn.1000-6923.2017.05.007 |
张智胜, 陶俊, 谢绍东, 等. 2013. 成都城区PM2.5季节污染特征及来源解析[J]. 环境科学学报, 2013, 33(11): 2947–2952.
|
邹长伟, 黄虹, 曹军骥. 2006. 大气气溶胶含碳物质基本特征综述[J]. 环境污染与防治, 2006, 28(4): 270–274.
DOI:10.3969/j.issn.1001-3865.2006.04.010 |
 2018, Vol. 38


