 2018, Vol. 38


2. 清华大学环境学院, 北京 100084;
3. 清华大学地球系统科学系, 北京 100084;
4. 中国气象科学研究院灾害国家重点实验室和大气化学重点开放实验室, 北京 100081;
5. 中国气象局气象探测中心, 北京 100081
2. School of Environment, Tsinghua University, Beijing 100084;
3. Department of Earth System Science, Tsinghua University, Beijing 100084;
4. State Key Laboratory of Severe Weather & Key Laboratory for Atmospheric Chemistry, Chinese Academy of Meteorological Sciences, Beijing 100081;
5. Meteorological Observation Center of CMA, Beijing 100081
改革开放40年, 经济的高速发展及快速的城镇化和工业化, 我国已然成为全球人为源排放的重要源区(Zhang et al., 2009).高排放导致我国大气污染越来越受到国家乃至全世界关注, 特别是一些重大灰霾事件的出现, 如2013年1月我国持续时间长、范围广、浓度大的灰霾事件(安静宇等, 2014; He et al., 2014; Jiang et al., 2014; Wang et al., 2014; Yang et al., 2015; Zheng et al., 2015)及2013年11月底—12月初我国长三角地区的重灰霾事件(Wang et al., 2015), 从而使得细颗粒物, 即PM2.5(空气动力学直径小于2.5 μm)受到普通人群关注.PM2.5不仅会降低空气质量, 而且会影响人体健康(Dockery et al., 1993; 谢鹏等, 2009)、能见度(Wang et al., 2012; Zhang et al., 2013)和气候变化(Han, 2010; Han et al., 2011, 2012; Liu et al., 2016; Zhuang et al., 2013a; 2013b).
海南省一直是我国空气质量最好的省份之一, 然而随着城市经济的迅猛发展, 特别是北部湾作为海上丝绸之路的重大规划, 海口市大气环境问题也随之而来.根据海口市生态环境保护厅(http://www.hkhbj.gov.cn/hjjc/default.aspx?pi=20)空气质量状况显示, 2013—2017年秋冬季节海口市出现不同程度霾天气.2013年海口市空气质量较其它4年差, 为污染天数最多的年份, 且有3 d达到中度污染等级.2014—2016年, 海口市污染天数呈下降趋势, 但2017年海口市一级天数再度减少, 为这5年中最少年, 而污染天数也从2016年的5 d增加到13 d.这些数据均表明作为旅游城市的海口市也面临着大气环境压力.
海口市不仅是海南省省会城市, 同时也是北部湾重要成员.北部湾位于我国南海西北部, 北临广西壮族自治区, 西临越南, 东临我国雷州半岛和海南岛, 是一个三面为陆地环抱的半封闭海湾.北部湾是我国大西南地区的海上通道, 分布有重要的港口城市, 其油气和海洋生物资源也极为丰富.从行政区角度出发, 北部湾区域陆上主要包括广西壮族自治区的4个市, 分别是南宁市、北海市、钦州市和防城港市;广东省湛江市和茂名市;海南省海口市、澄迈县、临高县、儋州市、昌江黎族自治县、东方市、乐东黎族自治县和洋浦经济开发区.作为中国参与东盟“10+1”战略重要门户的北部湾地区, 其规划的重点产业仍以高能耗、高排放的传统产业为主, 这些规划项目的相继投产运行, 势必会增加北部湾各种大气污染物的排放, 然而目前尚未有北部湾人为源对海口市大气环境质量影响论证的相关报道.基于此, 本文主要探讨不利风向条件下北部湾人为源对海口市PM2.5浓度影响, 以期为北部湾区域内联防联控工作提供科学支持, 同时也为海口市未来规划提供科学依据.
本研究首先基于海口市多年气象条件获得海口市不利风向时间段, 利用清华大学研发的排放清单, 设置一系列数值模拟实验, 通过WRF/CMAQ(WRF, Weather Research Forecast;CMAQ, Community Multi-scale Air Quality)模型定量分析北部湾人为源排放对海口市PM2.5浓度的影响.
2 数据和方法(Data and method) 2.1 模式介绍和数据来源气象场模型(WRF)驱动空气质量模型(CMAQ)在中国已得到广泛应用(Che et al., 2011; Wang et al., 2012; Zheng et al., 2015).关于WRF和CMAQ详细介绍可参考相关网址(http://www2.mmm.ucar.edu/wrf/users/和http://www.cmascenter.org/cmaq/)或上述发表文章, 本文不再赘述.本研究中WRF模型参数方案选择如表 1所示, 这些方案的选定是在多个测试基础上, 选择能够利用空气质量模型最佳模拟污染物浓度的方案组合.第一猜测场数据(初始输入数据)采用美国国家环境预报中心(National Centers for Environmental Prediction, 简称NCEP)的最终分析数据ds083.2(http://rda.ucar.edu/datasets/ds083.2/), 时间分辨率为6 h, 空间分辨率为1°×1°;采用NCEP ADP(Automated Data Processing)全球地表和高空观测资料进行客观分析与四维同化(Four-Dimensional Data Assimilation, FDDA);短波辐射方案采用新的Goddard(Chou et al., 1998), 该方案是较为复杂的谱方案;长波辐射方案为RRTM (A rapid radiative transfer model)(Malwer et al., 1997); 地面利用情况数据选择USGS 24类型;近地层参数化方案选用Pleim-Xiu (Xiu et al., 2001).
| 表 1 WRF模型参数方案选择 Table 1 Selected WRF configuration options used in this study |
CMAQ模型中气相化学反应机制选择CB05(Yarwood et al., 2005);气溶胶机理选择AER06, 其中气溶胶热力学模型为ISOPPOPIA, 二次无机气溶胶部分采用NH3-H2SO4-HNO3-H2O液相和气相化学体系;液相化学机制采用更新的RADM模型(Chang et al., 1987; Walcek et al., 1986).模式人为源排放清单来自清华大学编制的MEIC(Multi-resolution emission inventory for China, http://www.meicmodel.org/)清单, 它是我国高分辨率排放清单代表, 能给出不同化学反应机制, 为不同模型提供相应输入, 且该排放清单已被用于空气质量模型, 发现能较好地模拟出污染物浓度(Wang et al., 2014; Zheng et al., 2015).
本研究模拟区域如图 1a所示, 采用双层网格嵌套, 网格水平分辨率分别为36 km×36 km和12 km×12 km.第一层模拟域(D1)包括了中国几乎所有区域, 且包括了东亚(如韩国、朝鲜、日本等诸岛)和南亚一些区域;第二层模拟域(D2)覆盖了本研究中北部湾所有地区及周围部分地区.尽管D2分辨率相对海口市较低, 但由于本研究选用了区域排放清单和1°×1°的再分析数据, 通过测试发现更高分辨率的模型表现并未优于D2分辨率.第一层模拟域可为第二层模拟域提供初始和边界条件.为减少初始条件影响, 本文将从模拟月前一月第23日开始(如模拟2013年12月, 模型从2013年11月23日开始运行).
 |
| 图 1 WRF/CMAQ两层嵌套网格设置(a)及地面气象场(红色圆圈)和空气质量(蓝色三角形)观测数据空间分布(b) Fig. 1 Two nested domains for the WRF/CMAQ (a), spatial distribution of surface meteorological (red circles) and air quality(blue triangles)observation data in D2(b) |
为验证模型的可靠性和准确性, 本文利用地面观测数据(包括气象场观测和化学场观测)对模型进行验证.气象观测数据来源于中国气象局探测中心, 空气质量数据来源于中国环保部数据中心(CNEMC, http://113.108.142.147:20035/emcpublish/).气象场观测数据(红色圆圈)和空气质量观测数据(蓝色三角形)在D2空间分布如图 1b所示.
2.2 情景设置本文重在获得北部湾人为源排放对海口市PM2.5浓度影响, 故设计了1系列数值模拟情景实验(表 2), 采用Zero-Out方法, 获得不同排放情景(即不同污染源)对海口市PM2.5浓度影响, 以期为决策者提供科学建议和技术支撑.
| 表 2 本文模拟情景设置 Table 2 Modeling scenarios used in this study |
本文重在研究不利风向条件下北部湾对海口市PM2.5浓度影响, 引入风向频率参数.根据多年海口市气象资料, 统计出各月影响海口市的主要风向频率, 找出对海口市最不利风场所对应月份.
风向频率是指将风向分8个或16个罗盘方位观测, 累计某一时期内各个方位风向次数, 并以各个风向发生次数占该时期内各方位总次数的百分比表示, 计算方法如式(1)所示.
|
(1) |
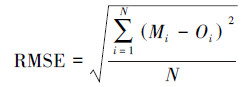
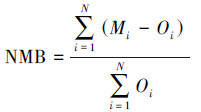
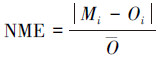
气象场和化学场验证选择了7个统计指标, 这7个指标也是评价大多数气象场和空气质量模型模拟准确度指标, 按照Zhang(2006; 2010a; 2010b; 2013a; 2013b)文献中描述, 分别是平均模拟值(M)、平均观测值(O)、平均误差(MB, Mean Bias)、相关系数(R, Correlation coefficient)、均方根误差(RMSE, Root Mean Square Error)、平均标准偏差(NMB, Normalized Mean Bias)和平均标准误差(NME, Normalized Mean Error), 其计算方法如式(2)~式(8)所示.
|
(2) |

|
(3) |
|
(4) |
|
(5) |
|
(6) |
|
(7) |
|
(8) |
式中, Mi和Oi分别是模拟值与观测值, M和O是模拟与观测的平均值, N为样本数.
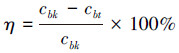
2.3.3 贡献浓度和贡献率本研究采用了Zero-Out方法, 为更好表述各人为源排放区对海口市PM2.5浓度的影响, 定义了贡献浓度(c)和贡献率(η), 其计算方法如式(9)和式(10)所示.

|
(9) |
|
(10) |
式中, cbk代表k情景下第b个网格浓度;cbt代表t情景下第b个网格浓度.
3 结果和讨论(Results and discussion) 3.1 确定不利风向条件时间段将海口市2013—2017年风向按照16方位进行统计, 结果如图 2所示.海南省海口市1月、2月、3月、10月、11月和12月盛行东北风.根据北部湾3个片区相对位置及海南片区内海口市位置(图 1), 北部湾对海口市影响的风向主要来自0°~56.25°、303.75°~360°和191.25°~236.25°, 对应16方位分别为N、NNE、NE、NNW、NW、SSW和SW.通过计算这7个方位的风向频率和, 发现12月在这7个方位的风向频率和最大, 约为45%.因此从纯风向角度考虑, 12月为对海口市最不利风向时间段.
 |
| 图 2 海口市2013—2017年1月—12月平均风向频率图 Fig. 2 Monthly Wind frequency in Haikou from 2013 to 2017 |
根据海口市生态环境保护局公布的海口市环境质量状况(http://hkhbj.gov.cn/hjjc/hjzlzk/default.aspx?pi=1), 2013—2017年海口市月均PM2.5浓度变化如图 3所示.海口市PM2.5浓度呈冬高夏低规律, 其中2013年12月为海口市月均PM2.5浓度最高月, 约为63 μg · m-3, 其次为2014年1月, 约为56 μg · m-3.
 |
| 图 3 海口市2013年1月—2017年12月海口市月均PM2.5浓度变化 Fig. 3 Time series of monthly PM2.5 concentrations in Haikou from January 2013 to October 2017 |
综上分析2013—2017年海口市风向频率和月均PM2.5浓度变化, 选定2013年12月为本研究模拟月, 即为对海口市空气质量最不利风向条件时间段.
3.2 模型模拟验证本研究重点讨论北部湾人为源排放对海口市PM2.5浓度影响, 故主要关注D2(12 km分辨率)模型表现(表 3).D2内气象场模拟结果对观测值有非常好的再现能力, 其中温度(T2)模拟和观测值相关系数为1.0, NMB和NME分别为-0.1%和0.5%;2 m湿度(RH2)模拟和观测相关系数为0.9, NMB和NME分别为-0.1%和11.5%;10 m风速(WSpd10)模拟和观测相关系数为0.7, NMB和NME分别为-1.3%和46%;10 m风向(WDir10)的模拟和观测相关系数为0.3, NMB和NME分别为30.8%和59.4%.
| 表 3 2013年12月D2气象场模拟统计分析 Table 3 Performance statistics of meteorological predictions for D2 in December 2013 |
2013年12月T2的MB(0.2 K)在Emery等(2001)和Tesche等(2002)推荐范围内(±5 K), 且远远小于该推荐值;模拟和观测的T2相关系数达1.0, 表明WRF模型可很好地再现观测温度场.10 m风速统计参数RMSE(1.4 m · s-1)也在Emery(2001)推荐范围内(≤2.0 m · s-1).
图 4显示了2013年12月海口市2 m温度、2 m湿度、10 m风速和风向4个气象参数时间序列. 图 4表明WRF能模拟出海口市各气象参数随时间的变化, 但WRF对温度变化较为缓慢的时间段、2 m湿度极值(2 m湿度的最高值和最低值)及10 m风速的最大值很难再现.这也是导致CMAQ难以模拟PM2.5浓度峰值及模拟PM2.5浓度偏高(表 4)的主要原因.
 |
| 图 4 2013年12月海口市主要气象参数观测值和模拟值时间序列变化 Fig. 4 Time series of observed and simulated meteorological parameters in Haikou in December 2013 |
| 表 4 2013年12月D2 PM2.5模拟统计分析 Table 4 Performance statistics of PM2.5 predictions for D2 in December 2013 |
为验证CMAQ模型模拟PM2.5浓度效果, 与地面观测PM2.5浓度进行比对, 表 4给出D2的评估结果, 模型模拟PM2.5浓度存在高估, 其高估的主要原因:①MEIC是区域尺度排放清单, 分配到城市的排放量有一定高估;②观测数据基于点, 但模型模拟浓度是基于一个单位网格的平均;③WRF模拟风速偏低(表 3).D2模拟和观测的PM2.5浓度空间分布和差值分别如图 5a和5b所示, 可看到模型能够基本再现PM2.5的空间分布, 但差值图表明有些站点被低估, 而有些站点有高估的现象, 可能的原因是污染物排放清单在空间匹配上存在一定偏差.
 |
| 图 5 2013年12月D2范围内PM2.5模拟和观测空间分布(a)及差值(b) Fig. 5 Overlay (a) and mean bias (b) of observed and simulated surface concentrations of PM2.5 in December 2013 with a 12 km-grid resolution. Circles indicate the observations |
图 6显示了2013年12月北部湾两个代表城市(南宁市和海口市)PM2.5模拟浓度和观测浓度时间序列变化, 可看到这两个城市模拟和观测的PM2.5浓度变化一致性较高, 表明该模型可很好地再现PM2.5浓度时空变化.
 |
| 图 6 2013年12月北部湾2个代表城市(南宁市(a)和海口市(b)) PM2.5模拟值和观测值时间序列图 Fig. 6 Temporal variations of daily observed and simulated PM2.5 concentrations of Nanning (a) and Haikou (b) in December 2013 |
基础情景(S0)和海口市(S3)情景相减, 可获得海口市人为源排放对海口市PM2.5浓度影响;同理, 基础情景(S0)和海南片区(S2)情景相减, 可获得海南片区人为源排放对海口市PM2.5浓度影响;基础情景(S0)和北部湾(S1)情景相减, 可获得北部湾人为源排放对海口市PM2.5浓度影响, 这3个人为源排放区对D2模拟域内PM2.5贡献浓度和贡献率如图 7所示.2013年12月, 海口市人为源致D2区域内PM2.5最大贡献浓度和最大贡献率分别为35.2 μg · m-3和41.0%, 平均贡献浓度和平均贡献率分别为0.1 μg · m-3和0.1%;海南片区人为源对D2区域内PM2.5最大贡献浓度和最大贡献率分别为35.2 μg · m-3和41.1%, 平均贡献浓度和平均贡献率分别为0.2 μg · m-3和0.3%;北部湾人为源致D2区域内月均PM2.5最大贡献浓度和最大贡献率分别为110.0 μg · m-3和68.0%;平均贡献浓度和平均贡献率分别为1.6 μg · m-3和2.7%.
 |
| 图 7 不同排放区对2013年12月PM2.5贡献浓度和贡献率空间分布 Fig. 7 The spatial distribution of contribution concentration and contribute rate of PM2.5 in December 2013 from different anthropogenic emissions |
海南片区(S2)和北部湾(S1)情景相减, 可获得广东广西片区人为源排放对D2区域内PM2.5浓度影响;同理, 海口市(S3)和海南片区(S2)情景相减, 可获得海南片区除海口市外其余市县人为源排放对区域内PM2.5浓度影响, 这2个排放区对D2空间内PM2.5贡献浓度和贡献率如图 8所示.2013年12月, 广东广西片区人为源致D2区域内平均PM2.5最大贡献浓度和最大贡献率分别为110.0 μg · m-3和68.0%, 平均贡献浓度和平均贡献率分别为1.4 μg · m-3和2.4%;海南片区除海口市其余市县排放区对D2区域内PM2.5最大贡献浓度和最大贡献率分别为19.4 μg · m-3和29.6%, 平均贡献浓度和平均贡献率分别为0.1 μg · m-3和0.2%.
 |
| 图 8 不同排放区对2013年12月PM2.5贡献浓度和贡献率的空间分布 Fig. 8 The spatial distribution of contribution concentration and contribute rate of PM2.5 in December 2013 from different anthropogenic emissions |
将上述5个人为源排放区对海口市日均PM2.5贡献浓度和贡献率总结如表 5所示, 其中海口市排放区对海口市PM2.5平均贡献浓度和最大贡献浓度分别为35.1 μg · m-3和56.4 μg · m-3, 平均贡献率和最大贡献率分别为40.9%和91.2%;海南片区除海口外其余市县对海口市日均PM2.5平均贡献浓度和平均贡献率均较小, 说明北部湾海南片区内除海口外的其余市县对海口市日均PM2.5浓度几乎无影响, 这也与图 8第二行结果一致.北部湾内广东广西片区对海口市平均贡献浓度为3.8 μg · m-3, 平均贡献率为4.4%, 相比海南片区, 广东广西片区对海口市贡献浓度和贡献率均较低, 平均贡献率约是海南片区平均贡献率的10%, 但相比海南片区除海口外其余市县贡献浓度和贡献率均较高.且广东广西片区最大贡献浓度和最大贡献率分别为18.9 μg · m-3和21.4%, 远高于海南片区除海口外的排放区, 表明广东广西片区对海口市PM2.5浓度影响远大于海南片区除海口外的其余市县.北部湾排放区对海口市PM2.5平均贡献率约为45.0%, 其中海口市自身贡献了大约90%, 广东广西片区贡献了约10%, 海南片区除海口外其余市县贡献率可忽略不计.这些结果表明在北部湾内, 海口市自身贡献最大, 其次是广东广西片区.
| 表 5 2013年12月各排放区对海口市PM2.5贡献浓度和贡献率 Table 5 The contribution concentration and contribution rate of PM2.5 in Haikou in December 2013 |
上述分析得出2013年12月海口市人为源排放区对海口市日均PM2.5浓度贡献率约为41%, 表明约有59%的海口市PM2.5来自区域传输, 而在这59%的区域传输中, 平均8%来自广东广西片区, 其余来自北部湾以外的地区.这些结果表明2013年12月海口市PM2.5的主要源区并非仅仅来源于北部湾地区.
目前我国PM2.5空气质量标准包括日均值和年均值, 图 9给出海口市排放区和北部湾排放区对海口市日均PM2.5浓度贡献随时间变化趋势, 图中阴影部分为2013年12月海口市日均PM2.5浓度超标时间段.2013年12月7—13日、22日、27—28日、31日海口市日均PM2.5浓度超过日均标准值(75 μg · m-3), 但海口市自身贡献率和北部湾贡献率在污染时段呈下降趋势.污染时段, 海口市自身贡献率平均为36%, 北部湾平均贡献率为40%, 均低于这两个排放区对海口市PM2.5浓度贡献率的平均值(41%和45%), 表明污染时段海口市PM2.5浓度区域传输贡献增加.清洁时段, 海口市自身贡献率和北部湾贡献率分别为48%和52%, 均高于平均值, 表明清洁时段海口市PM2.5浓度区域传输贡献下降.
 |
| 图 9 2013年12月海口市日均PM2.5自身贡献率和北部湾贡献率时间序列变化(阴影部分为海口市日均PM2.5浓度超标时段) Fig. 9 Time series of contribution rate of daily PM2.5 in Haikou from Haikou and Beibu gulf in December 2013 |
上文分析发现污染时段2013年12月海口市PM2.5区域传输贡献增加且源区不仅仅来自北部湾, 为分析获得其余源区, 本文利用全球同化数据系统(GDAS)驱动后向轨迹模型(HYSPLIT4.9)计算海口市污染时段(12月7—13日)和清洁时段(12月16—17日)72 h后向轨迹线, 分别如图 10a和10b所示.造成2013年12月海口市PM2.5污染的区域传输来自远距离传输, 12月7—13日间除9日外(图 10a), 其余6 d传输主要来自广东、福建、江西和湖南等地, 但这6 d污染日传输路径共有区域为珠三角区域, 说明珠三角地区也是造成海口市PM2.5污染的关键区域, 这与符传博等(2016)和苏超等(2016)的研究结果一致.冬季, 海口市盛行东北风, 除北部湾对海口市PM2.5浓度影响之外, 位于海口市东北方位的珠三角区域影响也较大.同时分析清洁时段海口市的72 h后向轨迹线, 16日传输主要来自广东和江西, 经过北部湾广东片区, 该日北部湾贡献率为90%, 广东广西片区贡献率约为36%, 表明该日北部湾对海口市PM2.5浓度贡献占主导, 且广东广西片区贡献率远高于12月平均贡献率(4.4%), 这和符传博等(2015)分析的2014年1月无污染时段来自海洋的结论不太一致, 其主要原因:①WRF/CMAQ模型可定量PM2.5区域传输贡献, 但HYSPLIT模型是半定量;②分析时间段不一致.17日主要经过广西片区南宁市, 该日北部湾传输贡献率为67%, 其中广东广西片区贡献率为25%, 同样表明清洁时段北部湾和广东广西片区对海口市PM2.5浓度影响较大.
 |
| 图 10 海口市污染时段(a.12月7—13日)和清洁时段(b.12月16—17日) 72 h后向轨迹 Fig. 10 72 h backward trajectories of Haikou in polluted period (a. from 7th to 13th December) and clean periods (b.from 16th to 17th December) |
值得注意的是, 表 5显示北部湾人为源最大贡献率为93.4%, 发生在12月15日, 该日为清洁时段, 且该日海口市自身贡献率达到最大(91.2%).广东广西片区最大贡献率为21.4%, 发生在12月21日, 该日海口市自身贡献率为36%.表明北部湾人为源对海口市PM2.5浓度贡献是不可忽视的, 特别随着北部湾城市群发展规划(2017)和广西北部湾经济区“十三五”规划(2016)等措施的实施, 一些冶金、石化、建材等产业的壮大和新兴, 势必会增加北部湾人为源排放, 从而影响海口市PM2.5浓度, 这些影响很有可能在不利风向条件下使目前海口市清洁时段变为污染时段, 导致空气质量下降.
本研究给出的2013年12月北部湾人为源对海口市PM2.5浓度的定量分析结果具有不确定性, 主要体现:区域排放清单在城市尺度上存在一定偏差;气象模型WRF的模拟误差;Zero-Out方法的非线性响应问题;CMAQ模型在模拟二次气溶胶方面尚不完善.未来加强上述方面的工作, 特别是北部湾城市尺度排放清单的耦合将使得该定量结果更准确.
4 结论(Conclusions)1) 通过分析2013—2017年海口市风向频率、地面PM2.5浓度观测以及海口市所处北部湾地理位置, 选定2013年12月为对海口市最不利风向时间段.WRF驱动CMAQ模型可基本再现2013年12月北部湾地面气象场和污染物时空变化.
2) 2013年12月北部湾人为源对海口市PM2.5平均贡献浓度和贡献率分别为39.0 μg · m-3和45.4%.其中约90%来自海口市自身人为源, 约10%来自广东广西片区人为源, 海南片区除海口市外其余市县贡献率几乎为0.即在北部湾内, 2013年12月对海口市PM2.5浓度影响主要是海口市自身, 其次是广东广西片区.
3) 2013年12月海口市污染时段, 北部湾和海口市人为源对海口市日均PM2.5浓度贡献率均下降, 表明污染时段造成海口市PM2.5浓度区域传输的源区不仅来自北部湾;通过分析后向轨迹, 发现污染时段均经过一个关键区—珠三角区域, 表明珠三角区域也是造成2013年12月海口市PM2.5污染的主要源区.
4) 2013年12月海口市清洁时段, 北部湾和海口市人为源对海口市PM2.5浓度贡献率均上升, 表明清洁时段北部湾对海口市PM2.5浓度的影响更为显著, 暗示未来北部湾产业规划对海口市PM2.5浓度影响不容忽视, 因为很有可能在不利风向条件下使目前海口市清洁时段变为污染时段, 导致空气质量下降.
安静宇, 李莉, 黄成, 等. 2014. 2013年1月中国东部地区重污染过程中上海市细颗粒物的来源追踪模拟研究[J]. 环境科学学报, 2014, 34(10): 2635–2644.
|
北部湾城市群发展规划. 2016. 国家发展改革委住房城乡建设部
|
Chang J S, Brost R A, Isaksen I S A, et al. 1987. A three-dimensional Eulerian acid deposition model:physical concepts and formulation[J]. Journal of Geophysical Research-atmosphere, 92(D12): 14681–14700.
DOI:10.1029/JD092iD12p14681
|
Che W, Zheng J Y, Wang S S, et al. 2011. Assessment of motor vehicle emission control policies using Model-3/CMAQ model for the Pearl River Delta region, China[J]. Atmospheric Environment, 45(9): 1740–1751.
DOI:10.1016/j.atmosenv.2010.12.050
|
Chou M D, Suarez M J, Ho C H, et al. 1998. Parameterizations for cloud overlapping and shortwave single-scattering properties for use in general circulation and cloud ensemble models[J]. Journal of Climate, 11(2): 202–214.
DOI:10.1175/1520-0442(1998)011<0202:PFCOAS>2.0.CO;2
|
Dockery D W, Pope C A, Xu X, et al. 1993. An association between air-pollution and mortality in 6 United States cities[J]. The New England Journal of Medicine, 329(24): 1753–1759.
DOI:10.1056/NEJM199312093292401
|
Emery C, Tai E, Yarwood G. 2001. Enhanced meteorological modeling and performance evaluation for two texas episodes[Z]. Prepared for the Texas Natural Resource Conservation Commission, ENVIRON International Corporation, Novato, CA, USA
|
符传博, 唐家翔, 丹利, 等. 2015. 2013年冬季海口市一次气溶胶粒子污染事件特征及成因解析[J]. 环境科学学报, 2015, 35(1): 72–79.
DOI:10.11654/jaes.2015.01.011 |
符传博, 唐家翔, 丹利, 等. 2016. 2014年海口市大气污染物演变特征及典型污染个例分析[J]. 环境科学学报, 2016, 36(6): 2160–2169.
|
广西北部湾经济区"十三五规划". 2016. 广西壮族自治区人民政府办公厅文件
|
Han Z W. 2010. Direct radiative effect of aerosols over East Asia with a Regional coupled Climate/Chemistry model[J]. Meteorologische Zeitschirift, 19(3): 287–298.
DOI:10.1127/0941-2948/2010/0461
|
Han Z W, Xiong Z, Li J W. 2011. Direct climatic effect of aerosols and interdecadal variations over east asia investigated by a regional coupled climate-chemistry/aerosol model[J]. Atmospheric and Oceanic Science Letter, 4(6): 299–303.
DOI:10.1080/16742834.2011.11446947
|
Han Z W, Li J W, Xia X G, et al. 2012. Investigation of direct radiative effects of aerosols in dust storm season over East Asia with an online coupled regional climate-chemistry-aerosol mode l[J]. Atmospheric Environment, 54: 688–699.
DOI:10.1016/j.atmosenv.2012.01.041
|
He H, Wang Y S, Ma Q X, et al. 2014. Mineral dust and NOx promote the conversion of SO2 to sulfate in heavy pollution days[J]. Science Report, 4(1): 4172.
|
Hong S Y, Lim J O J. 2006. The WRF Single-Moment 6-Class Microphysics Scheme (WSM6)[J]. Journal of the Korean Meteorological Society, 42: 129–151.
|
Jiang J K, Zhou W, Cheng Z, et al. 2014. Particulate matter distributions in china during a winter period with frequent pollution episodes (January 2013)[J]. Aerosol Air Quality Research, 15(2): 494–503.
|
Kain J S. 2004. The Kain-Fritsch convective parameterization:an update[J]. Journal of Applied Meteorology, 43(1): 170–181.
DOI:10.1175/1520-0450(2004)043<0170:TKCPAU>2.0.CO;2
|
Liu X Y, Zhang Y, Zhang Q, et al. 2016. Application of online-coupled WRF/Chem-MADRID in East Asia:Model evaluation and climatic effects of anthropogenic aerosols[J]. Atmospheric Environment, 124: 321–336.
DOI:10.1016/j.atmosenv.2015.03.052
|
Malwer E J, Taubman S J, Brown P D, et al. 1997. Radiative transfer for inhomogeneous atmosphere:RRTM, a validated correlated-k model for the longwave[J]. Journal of Geophysical Research-atmosphere, 102: 16663–16682.
DOI:10.1029/97JD00237
|
Pleim J E. 2007. A combined local and nonlocal closure model for the atmospheric boundary layer, Part Ⅰ:Model description and testing[J]. Journal of Applied Meteorology & Climate, 46(9): 1383–1395.
|
苏超, 田良. 2016. 海口市空气质量的特征及其与气象条件的关系[J]. 海南大学学报自然科学版, 2016, 34(2): 185–192.
|
Tesche T W, McNally D E, Tremback C. 2002. Operational evaluation of the MM5 meteorological model over the continental United States: protocol for annual and episodic evaluation[Z]. Prepared for US EPA by Alpine Geophysics, LLC, Ft. Wright, KY, and ATMET, Inc., Boulder
|
Walcek C J, Taylor G R. 1986. A theoretical method for computing vertical distributions of acidity and sulfate production within cumulus clouds[J]. Journal of the Atmospheric Sciences, 43(43): 339–355.
|
Wang L T, Wei Z, Yang J, et al. 2014. The 2013 severe haze over southern Hebei, China:model evaluation, source apportionment, and policy implications[J]. Atmospheric Chemistry and Physics, 13(11): 28395–28451.
|
Wang L T, Xu J, Yang J, et al. 2012. Understanding haze pollution over the southern Hebei area of China using the CMAQ model[J]. Atmospheric Environment, 56(5): 69–79.
|
Wang M Y, Cao C X, Li G S, et al. 2015. Analysis of a severe prolonged regional haze episode in the Yangtze River Delta, China[J]. Atmospheic Environment, 102: 112–121.
DOI:10.1016/j.atmosenv.2014.11.038
|
谢鹏, 刘晓云, 刘兆荣, 等. 2009. 我国人群大气颗粒物污染暴露-反应关系的研究[J]. 中国环境科学, 2009, 29(10): 1034–1040.
DOI:10.3321/j.issn:1000-6923.2009.10.006 |
Xiu A, Pleim J E. 2001. Development of a land surface model, Part Ⅰ:Application in a mesoscale meteorological model[J]. Journal of Applied Meteorology, 40: 192–209.
DOI:10.1175/1520-0450(2001)040<0192:DOALSM>2.0.CO;2
|
Yang Y R, Liu X G, Qu Y, et al. 2015. Formation mechanism of continuous extreme haze episodes in the megacity Beijing, China, in January 2013[J]. Atmospheric Research, 155: 192–203.
DOI:10.1016/j.atmosres.2014.11.023
|
Yarwood G, Rao S, Yocke M, et al. 2005. Updates to the Carbon Bond Chemical mechanism: CB05. Final Report to the U. S. EPA, RT-0400675. [R/OL]
|
Zhang Q, Streets D G, Carmichael G R, et al. 2009. Asian emissions in 2006 for the NASA INTEX-B mission[J]. Atmospheric Chemistry and Physics, 9(1): 5131–5153.
|
Zhang R, Jing J, Tao J, et al. 2013. Chemical characterization and source apportionment of PM2.5 in Beijing:seasonal perspective[J]. Atmospheric Chemistry and Physics, 13(14): 7053–7074.
DOI:10.5194/acp-13-7053-2013
|
Zhang Y, Liu P, Pun B, et al. 2006. A comprehensive performance evaluation of MM5-CMAQ for the Summer 1999 Southern Oxidants Study episode-Part Ⅰ:Evaluation protocols, databases, and meteorological predictions[J]. Atmospheric Environment, 40(26): 4825–4838.
DOI:10.1016/j.atmosenv.2005.12.043
|
Zhang Y, Pan Y, Wang K, et al. 2010a. WRF/Chem-MADRID:Incorporation of an aerosol module into WRF/Chem and its initial application to the TexAQS2000 episode[J]. Journal of Geophysical Research-Atmospheres, 115: D18202.
DOI:10.1029/2009JD013443
|
Zhang Y, Sartelet K, Wu S Y, et al. 2013a. Application of WRF/Chem-MADRID and WRF/Polyphemus in Europe-Part 1:Model description, evaluation of meteorological predictions, and aerosol-meteorology interactions[J]. Atmospheric Chemistry and Physics, 13(14): 6807–6843.
DOI:10.5194/acp-13-6807-2013
|
Zhang Y, Sartelet K, Zhu S, et al. 2013b. Application of WRF/Chem-MADRID and WRF/Polyphemus in Europe-Part 2:Evaluation of chemical concentrations and sensitivity simulations[J]. Atmospheric Chemistry and Physics, 13(14): 6845–6875.
DOI:10.5194/acp-13-6845-2013
|
Zhang Y, Wen X Y, Jang C J, et al. 2010b. Simulating chemistry-aerosol-cloud-radiation-climate feedbacks over the continental U.S. using the online-coupled Weather Research Forecasting Model with chemistry (WRF/Chem)[J]. Atmospheric Environment, 44(29): 3568–3582.
DOI:10.1016/j.atmosenv.2010.05.056
|
Zheng B, Zhang Q, Zhang Y, et al. 2015. Heterogeneous chemistry:a mechanism missing in current models to explain secondary inorganic aerosol formation during the January 2013 haze episode in North China[J]. Atmospheric Chemistry and Physics, 14(15): 2031–2049.
|
Zhuang B L, Li S, Wang T J, et al. 2013a. Direct radiative forcing and climate effects of anthropogenic aerosols with different mixing states over China[J]. Atmospheric Environment, 79(11): 349–361.
|
Zhuang B L, Liu Q, Wang T J, et al. 2013b. Investigation on semi-direct and indirect climate effects of fossil fuel black carbon aerosol over China[J]. Theoretical & Applied Climatology, 114(3/4): 651–672.
|