 2017, Vol. 37


2. 天津市环境监测中心, 天津 300191;
3. 天津市气象科学研究所, 天津 300074;
4. 南开大学环境科学与工程学院, 国家环境保护城市空气颗粒物污染防治重点实验室, 天津 300071
2. Tianjin Environmental Monitoring Center, Tianjin 300191;
3. Tianjin Institute of Meteorological Science, Tianjin 300074;
4. State Environmental Protection Key Laboratory of Urban Ambient Air Particulate Matter Pollution Prevention and Control, College of Environmental Science and Engineering, Nankai University, Tianjin 300071
颗粒物是大气环境中重要的污染物之一,因其对气候、环境和人类健康均有重大影响而受到国内外学者的广泛关注(Menon et al., 2002; Andre, 2005; Fu et al., 2008; Deng et al., 2011).颗粒物在大气中的行为和环境效应不仅与颗粒物的浓度有关,还与颗粒物的化学组分及粒径分布密切相关,并且表现出显著的时空分布特征(Seinfeld et al., 1998; Salma et al., 2002; Mather et al., 2003; Liu et al., 2008; 陶燕等, 2014),因此,有关颗粒物的浓度、化学组分及粒径分布特征得到了广泛的研究(Liu et al., 2008; Tan et al., 2009; Kumar et al, 2010; Yang et al., 2012; Cao et al, 2012; Zhang et al, 2013; Sun et al., 2014; Salameh et al., 2015; 常清等, 2015).在相关研究中,多关注垂直方向颗粒物质量浓度及其来源(徐宏辉等,2008;Zhang et al., 2011; Xiao et al., 2012; Sun et al., 2013; Wu et al., 2015),有关颗粒物化学组成及粒径垂直分布的研究非常有限,无法全面清晰地了解颗粒物的环境效应.本文对比分析了天津市污染日和清洁日不同粒径颗粒物浓度及其化学组成的垂直分布特征,以期为天津市大气污染防治工作提供科学依据.
2 实验与方法(Experiment and methods) 2.1 研究区域天津市位于北纬38°34′~40°15′、东经116°43′~118°04′,地处华北平原东北部,是环渤海地区的经济、金融中心,工业发达,面积为11946 km2,人口为14×106人.考虑到冬季污染日天津市边界层高度较低(李梦等,2015),采样点高度分别设置在天津市大气边界层气象铁塔第1层观测平台(距离地面10 m)和第4层观测平台(距离地面220 m).该观测站西面和南面主要为住宅区,东临友谊路,其北距城市快速路约150 m,属于居民与交通混合区.采样点分布见图 1.
 |
| 图 1 天津市采样点位分布示意图 Fig. 1 Location of the sampling station in Tianjin |
利用Andersen八级撞击式采样器(E-0162) 采集颗粒物样品,粒径范围依次为0.4~0.7、0.7~1.1、1.1~2.1、2.1~3.3、3.3~4.7、4.7~5.8、5.8~9.0和9.0~10 μm,采样流量为28.3 L·min-1,采样滤膜为直径81 mm的石英膜(Pallflex Life Science),采样时间为2013年12月23日-2014年1月18日,为满足检测限要求,每个样品采集时间为48 h,采样后的膜样品用铝箔包装置于冰箱中(-4 ℃)避光保存至分析.
采样前将石英滤膜置于马弗炉中450 ℃灼烧4 h消除本底值的影响,采样前后滤膜均在恒温恒湿条件下(T=(20±1) ℃,RH=50%±5%)平衡48 h,使用电子天平(瑞士Mettler Toledo公司,天平精度为0.00001 g)对石英膜进行称重;采用美国戴安公司的DX-120型离子色谱分析样品中水溶性离子(SO42-、NO3-、Cl-、F-、NH4+、Na+、K+、Mg2+、Ca2+等)的质量浓度;采用美国沙漠研究所的DRI2001A型碳分析仪分析样品中EC(元素碳)和OC(有机碳)的质量浓度.由于撞击式采样器采集的颗粒物在滤膜边缘分布不均匀,为最大限度地减少OC/EC的分析误差,在取样前充分考虑样品在采样膜的分布特性,首先在靠近滤膜中心区域选取分析样,其次统计分析样中颗粒物点的数量占整个膜样品的比例,依照此比例来推算整个膜样品中OC/EC的含量.
采样期间无降水,平均温度、相对湿度、能见度、风速和风向等气象参数见图 2(数据来自天津市气象局气象铁塔观测数据,风向玫瑰图中数据表示不同风向出现的频率).因Andersen采样器没有PM2.5切割级,因此,将PM2.1作为粗细颗粒物的分界点,其中,PM0.4~2.1为细粒子,PM2.1~10为粗粒子.定义PM2.1>75 μg·m-3为细颗粒物污染日(简称污染日),PM2.1<75 μg·m-3为细颗粒物清洁日(简称清洁日).采样期间,共得到13组有效数据,分别为8个污染日、5个清洁日.
 |
| 图 2 采样期间的平均温度、相对湿度、能见度及风速和风向玫瑰图 Fig. 2 Air temperature, relative humidity, visibility, wind speed and wind direction during the sampling period |
采样期间颗粒物浓度垂直分布见图 3.污染日10、220 m处PM10浓度均值分别为(278.68±78.46)、(268.09±92.59) μg·m-3;清洁日10、220 m处PM10浓度均值分别为(194.34±79.24)、(164.88±0.38) μg·m-3.污染日和清洁日下,不同粒径颗粒物浓度分布均呈双峰形,峰值出现在1.1~2.1和9~10 μm粒径段.污染日最大浓度峰值出现在1.1~2.1 μm粒径段,清洁日则出现在9.0~10 μm粒径段.
 |
| 图 3 污染日和清洁日颗粒物浓度垂直分布 Fig. 3 Vertical of mass distribution of particulate matters on pollution and clear days |
从颗粒物浓度的垂直分布上看,污染日和清洁日下,PM10浓度均随高度的增加而降低,下降率分别为3.8%、15.1%,污染日PM10浓度垂直分布递减缓慢,清洁日垂直分布递减明显.冬季污染日边界层高度低(李梦等,2015),且垂直方向存在逆温,逆温层下颗粒物浓度可进行一定的混合,因此,PM10浓度随高度的降低比较缓慢;清洁日边界层高度较高,各层水平风速较大,尤其高层更加明显,造成颗粒物浓度差异明显,这与相关研究相似(Zhang et al., 2011; Xiao et al., 2012; 丁国安等,2005).
从PM0.4~2.1/PM10的比值看,污染日10、220 m处PM0.4~2.1/PM10的值分别为0.51、0.55,清洁日10、220 m处PM0.4~2.1/PM10的值分别为0.32、0.30.说明与清洁日相比,污染日细颗粒物所占比重增加,颗粒物污染呈现细颗粒与粗颗粒污染并重态势.
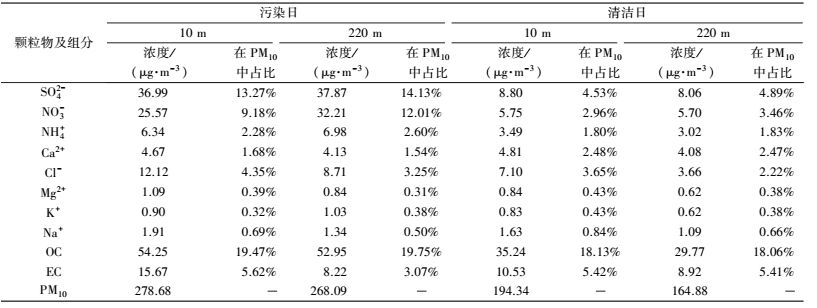
3.2 颗粒物化学组成及粒径分布特征 3.2.1 离子组分浓度及粒径分布特征采样期间,不同高度颗粒物中水溶性离子浓度及在PM10中的占比见表 1,浓度粒径分布见图 4.从垂直分布上看,污染日SO42-、NO3-、NH4+等二次离子浓度及百分占比随高度的上升而增加,Ca2+、Cl-、Mg2+、Na+等一次离子浓度及百分占比随高度的上升而降低,K+浓度及百分占比随着高度的上升略有增加;清洁日SO42-、NO3-、NH4+的浓度随着高度的上升而降低,但百分占比随着高度的上升而增加,其余离子浓度及百分占比均随着高度的上升而略降.
| 表 1 污染日和清洁日颗粒物及组分垂直分布 Table 1 Vertical distribution of particulate matters and their components on pollution and clear days |
 |
| 图 4 污染日(a, b)和清洁日(c, d) 10 m和220 m高度离子浓度粒径分布 Fig. 4 Mass size distribution of water-soluble ions at heights of 10 m and 220 m on pollution days(a, b) and clear days(c, d) |
SO42-和NO3-是颗粒物中含量较高的二次离子组分,Cl-是颗粒物中含量较高的一次离子组分.与清洁日相比,污染日SO42-、NO3-、Cl-浓度及百分占比均增加明显.硫酸盐的占比越高,说明颗粒物的老化时间越长(Moffet et al., 2008;周敏等,2013),硫酸盐的累积增长主要与燃煤区域的输送有关(Calvo et al., 2013),冬季Cl-主要来自燃煤排放,NO3-主要来自燃煤和机动车排放,说明天津市冬季污染日的主要来源为燃煤、机动车及二次离子,并且220 m高度受本地排放和区域传输共同影响;污染日Ca2+、Mg2+等离子浓度和百分占比变化不明显,Ca2+、Mg2+主要来自土壤、扬尘等源类,说明上述源类在污染日与清洁日贡献变化不大.
从粒径分布上看,污染日SO42-、NO3-、NH4+等二次离子及Cl-、K+最大浓度峰值出现在1.1~2.1 μm粒径段,Ca2+、Mg2+、Na+等离子最大浓度峰值出现在9.0~10 μm粒径段;清洁日SO42-、NO3-、NH4+等二次离子及Cl-、K+最大浓度峰值出现在0.7~1.1 μm粒径段,与污染日粒径分布略有不同;Ca2+、Mg2+、Na+等离子最大浓度峰值出现在9.0~10 μm粒径段,与污染日离子组分粒径分布相似,说明二次离子主要富集于细粒子,一次离子主要富集于粗粒子.
与清洁日相比,污染日SO42-、NO3-、NH4+等二次离子最大浓度峰移至1.1~2.1 μm粒径段,处于“液滴”模态.颗粒物中二次离子主要是大气中的气态前体物通过气态均相氧化或液相非均相氧化反应生成(唐孝炎等,2006),采样期间,污染日气象条件相对稳定,相对湿度偏高(达70%左右),说明气态前体物在静稳、高湿的气象条件下,通过液相反应加强,这与相关研究相似(常青等,2015).
NO3-主要来自燃煤和机动车,SO42-主要来自燃煤,NO3-/SO42-可用来定性分析机动车与燃煤对颗粒物的相对贡献(Gao et al., 2011).污染日10、220 m处NO3-/SO42-分别为0.69、0.85,清洁日10、220 m处NO3-/SO42-分别为0.65、0.71,说明污染日流动源的贡献相对增加.从垂直分布上看,污染日和清洁日NO3-/SO42-均随着高度的上升而增加,这与相关研究相似(Wu et al., 2015).从NO3-/SO42-的粒径分布上看(图 5),污染日10、220 m分布均呈现出“M”型,表现为两端高、中间低的特点,而清洁日分布呈现出整体下降趋势.无论在污染日还是清洁日,低层机动车排放对亚微米模态(<1 μm)贡献明显,而对于粗粒径段,燃煤源的贡献则大于机动车.220 m高度处NO3-/SO42-在细粒子段、粗粒子段均较为突出,可能与区域传输有关.
 |
| 图 5 污染日和清洁日NO3-/SO42-的粒径分布 Fig. 5 Size distribution of NO3- /SO42- on pollution and clear days |
采样期间,不同高度颗粒物中碳组分浓度及在PM10中的占比见表 1,浓度粒径分布见图 6.从垂直分布上看,污染日OC浓度随着高度的上升而降低,但在PM10中百分占比随高度的上升而升高,EC浓度和百分占比均随高度的上升而降低;清洁日OC、EC浓度随高度的上升而降低,但百分占比基本保持稳定.EC具有良好的稳定性,OC既有一次排放,又有二次反应生成,OC与EC的浓度比值常用来判断是否有二次有机物的形成,如OC/EC的比值大于2,可认为存在二次污染(Turpin et al., 1995).采样期间,污染日10、220 m处OC/EC的比值分别为3.46、6.44,清洁日10、220 m处OC/EC的比值分别为3.35、3.34,说明采样期间均存在有二次有机碳的生成.污染日220 m处OC/EC的比值远高于10 m处,从一定程度上反映出220 m高度处二次污染重;清洁天日OC/EC的比值随高度的上升基本保持稳定,这说明清洁天气下220 m高度与10 m高度二次污染情况相似.
 |
| 图 6 污染日(a, b)和清洁日(c, d)10 m和220 m高度有机碳和元素碳浓度粒径分布 Fig. 6 Mass size distribution of organic and elemental carbon at heights of 10 m and 220 m on pollution days(a, b) and clear days(c, d) |
从粒径分布上看,污染日和清洁日OC最大浓度峰值均出现在1.1~2.1 μm粒径段,EC的最大浓度峰值均出现在0.7~1.1 μm粒径段,说明OC、EC主要富集于细粒子,且EC的峰值粒径小于OC.
4 结论(Conclusions)1) 采样期间,污染日10、220 m处PM10浓度均值分别为(278.68±83.87)、(268.09±98.98)μg·m-3,清洁日10、220 m处PM10浓度均值分别为(194.34±86.80)、(164.88±77.10)μg·m-3.不同粒径颗粒物浓度分布均呈双峰形,污染日最大浓度峰值出现在1.1~2.1 μm粒径段,清洁日出现在9.0~10 μm粒径段. PM10浓度均随高度的增加而降低,污染日下降缓慢,清洁日下降较大.
2) 污染日SO42-、NO3-、NH4+等二次离子浓度及占比均随高度的上升而增加,Ca2+、Cl-、Mg2+、Na+等一次离子浓度及占比随高度的上升而降低;清洁日SO42-、NO3-、NH4+的浓度随着高度的上升而降低,但百分占比随着高度的上升而增加,其余离子浓度及百分占比均随着高度的上升而略降.与清洁日相比,污染日SO42-、NO3-、Cl-浓度及百分占比均增加明显,说明燃煤、机动车及二次离子为污染日颗粒物的主要来源,并在220 m高度受本地排放和区域传输共同影响,土壤、扬尘等源类在污染日与清洁日贡献变化不大.
3) 污染日SO42-、NO3-、NH4+等二次离子及Cl-、K+最大浓度峰值出现在1.1~2.1 μm粒径段,清洁日出现在0.7~1.1 μm粒径段;污染日和清洁日Ca2+、Mg2+、Na+等离子最大浓度峰值均出现在9.0~10 μm粒径段.污染日二次离子主要处于“液滴”模态,说明气态前体物在静稳、高湿的气象条件下,通过液相反应加强.
4) 污染日和清洁日下NO3-/SO42的比值均随着高度的上升而增加,低层机动车排放对亚微米模态(<1 μm)贡献明显,而对于粗粒径段,燃煤源的贡献则大于机动车,220 m高度处NO3-/SO42-的比值在细粒子段、粗粒子段均较为突出,可能与区域传输有关.
5) 采样期间均存在有二次有机碳的生成,污染日220 m高度处二次污染重;清洁天日OC/EC的比值随高度的上升基本保持稳定,这说明清洁天气下220 m高度与10 m高度二次污染情况相似.污染日和清洁日OC、EC主要富集于细粒子,且EC的峰值粒径小于OC.
| [${referVo.labelOrder}] | Andre N. 2005. Air pollution-related illness:effects of particles[J]. Science, 308(5723): 804–806. DOI:10.1126/science.1108752 |
| [${referVo.labelOrder}] | Ajay Kumar M K, Mishra J K, Divkar S R, et al. 2010. Impact of particle size on distribution of major ions in acid-and water-soluble components of PM10 atmospheric aerosols in the coastal region of Mumbai[J]. Atmospheric Research, 98(2/4): 406–415. |
| [${referVo.labelOrder}] | Calvo A I, Alves C, Castro A, et al. 2013. Research on aerosol sources and chemical composition:Past, current and emerging issues[J]. Atmospheric Research, 120-121: 1–28. DOI:10.1016/j.atmosres.2012.09.021 |
| [${referVo.labelOrder}] | Cao J J, Wang Q Y, Chow J C, et al. 2012. Impacts of aerosol compositions on visibility impairment in Xi'an, China[J]. Atmospheric Environment, 59: 559–566. DOI:10.1016/j.atmosenv.2012.05.036 |
| [${referVo.labelOrder}] | 常清, 杨复沫, 李兴华, 等. 2015. 北京冬季雾霾天气下颗粒物及其化学组分的粒径分布特征研究[J]. 环境科学学报, 2015, 35(2): 363–370. |
| [${referVo.labelOrder}] | Deng X J, Tie X X, Wu D, et al. 2008. Long-term trend of visibility and its characterizations in the Pearl River Delta(PRD) region, China[J]. Atmospheric Environment, 42(7): 1424–1435. DOI:10.1016/j.atmosenv.2007.11.025 |
| [${referVo.labelOrder}] | 丁国安, 陈尊裕, 高志球, 等. 2005. 北京城区低层大气PM10和PM2.5垂直结构及其动力特征[J]. 中国科学D辑地球科学, 2005, 35(增刊Ⅰ): 31–44. |
| [${referVo.labelOrder}] | Fu Q Y, Zhuang G S, Wang J, et al. 2008. Mechanism of formation of the heaviest pollution episode ever recorded in the Yangtze River Delta, China[J]. Atmospheric Environment, 42(9): 2023–2036. DOI:10.1016/j.atmosenv.2007.12.002 |
| [${referVo.labelOrder}] | Gao X, Yang L, Cheng S, et al. 2011. Semi-continuous measurement of water-soluble ions in PM2.5 in Jinan, China:temporal variations and source apportionments[J]. Atmospheric Environment, 45(33): 6048–6056. DOI:10.1016/j.atmosenv.2011.07.041 |
| [${referVo.labelOrder}] | 李梦, 唐贵谦, 黄俊, 等. 2015. 京津冀冬季大气混合层高度与大气污染的关系[J]. 环境科学, 2015, 36(6): 1935–1943. |
| [${referVo.labelOrder}] | Liu S, Hu M, Slanina S, et al. 2008. Size distribution and source analysis of ionic compositions of aerosols in polluted periods at Xinken in Pearl River Delta(PRD) of China[J]. Atmospheric Environment, 42(25): 6284–6295. DOI:10.1016/j.atmosenv.2007.12.035 |
| [${referVo.labelOrder}] | Liu X G, Zhang Y H, Cheng Y F, et al. 2012. Aerosolhygroscopicity and its impact on atmospheric visibility and radiative forcing in Guangzhou during the 2006 PRIDE-PRD campaign[J]. Atmospheric Environment, 60(6): 59–67. |
| [${referVo.labelOrder}] | Mather T, Allen A G, Oppenheimer C, et al. 2003. Size-resolved characterisation of soluble ions in the particles in the tropospheric plume of Masaya volcano, Nicaragua:origins and plume processing[J]. Journal of Atmospheric Chemistry, 46(3): 207–237. DOI:10.1023/A:1026327502060 |
| [${referVo.labelOrder}] | Menon S, Hansen J, Nazarenko L, et al. 2002. Climate effects of black carbon aerosols in China and India[J]. Science, 297(5590): 2250–2253. DOI:10.1126/science.1075159 |
| [${referVo.labelOrder}] | Moffet R C, de Foy B, Molina L T, et al. 2008. Measurement of ambient aerosols in northern Mexico city by single particle mass spectrometry[J]. Atmospheric Chemistry and Physics, 8(16): 6052–6058. |
| [${referVo.labelOrder}] | Salma I, Balashazy I, Winkler Heil R, et al. 2002. Effect of particle mass size distribution on the deposition of aerosols in the human respiratory system[J]. Aerosol Science, 33(1): 119–132. DOI:10.1016/S0021-8502(01)00154-9 |
| [${referVo.labelOrder}] | Seinfeld J H, Pandis S N. 1998. Atmospheric and Chemistry and Physics:from Air Pollution to Climate Change[M]. New York: Wiley-Inter Science. |
| [${referVo.labelOrder}] | Sun X, Yin Y, Sun Y W, et al. 2013. Seasonal and vertical variations in aerosol distribution over Shijiazhuang, China[J]. Atmospheric Environment, 81(4): 245–252. |
| [${referVo.labelOrder}] | Tan J H, Duan J C, Chen D H, et al. 2009. Chemical characteristics of haze during summer and winter in Guangzhou[J]. Atmospheric Research, 94(2): 238–245. DOI:10.1016/j.atmosres.2009.05.016 |
| [${referVo.labelOrder}] | 唐孝炎, 张远航, 邵敏. 2006. 大气环境化学(第二版)[M]. 北京: 北京高等教育出版社. |
| [${referVo.labelOrder}] | Sun K, Qu Y, Wu Q, et al. 2014. Chemical characteristics of size-resolved aerosols in winter in Beijing[J]. Journal of Environmental Sciences, 26(8): 1641–1650. DOI:10.1016/j.jes.2014.06.004 |
| [${referVo.labelOrder}] | Salameh D, Detournay A, Pey J, et al. 2015. PM2.5 chemical composition in five European Mediterranean cities:a 1-year study[J]. Atmospheric Research, 155: 102–117. DOI:10.1016/j.atmosres.2014.12.001 |
| [${referVo.labelOrder}] | Turpin B J, Huntzicker J J. 1995. Identification of secondary organic aerosol episodes and quantitation of primary and secondary organic aerosol concentrations during scaqs[J]. Atmospheric Environment, 29(23): 3527–3544. DOI:10.1016/1352-2310(94)00276-Q |
| [${referVo.labelOrder}] | 陶燕, 刘亚梦, 米生权, 等. 2014. 大气细颗粒物的污染特征及对人体健康的影响[J]. 环境科学学报, 2014, 34(3): 592–597. |
| [${referVo.labelOrder}] | 徐宏辉, 王跃思, 温天雪, 等. 2008. 北京秋季大气气溶胶浓度的垂直分布[J]. 中国环境科学, 2008, 28(1): 2–6. |
| [${referVo.labelOrder}] | Wu H, Zhang Y F, Han S Q, et al. 2015. Vertical characteristics of PM2.5 during the heating season in Tianjin, China[J]. Science of the Total Environment, 523: 152–160. DOI:10.1016/j.scitotenv.2015.03.119 |
| [${referVo.labelOrder}] | Xiao Z M, Wu J H, Han S Q, et al. 2012. Vertical characteristics and source identification of PM10 in Tianjin[J]. Journal of Environmental Sciences, 24(1): 112–115. DOI:10.1016/S1001-0742(11)60734-1 |
| [${referVo.labelOrder}] | Yang L X, Zhou X H, Wang Z, et al. 2012. Airbornefine particulate pollution in Jinan, China:Concentrations, chemical compositions and influence on visibility impairment[J]. Atmospheric Environment, 55: 506–514. DOI:10.1016/j.atmosenv.2012.02.029 |
| [${referVo.labelOrder}] | Zhang G H, Bi X H, Chan L Y, et al. 2013. Size-segregated chemical characteristics of aerosol during haze in an urban area of the Pearl River Delta region, China[J]. Urban Climate, 4: 74–84. DOI:10.1016/j.uclim.2013.05.002 |
| [${referVo.labelOrder}] | Zhang Y F, Xu H, Tian Y Z, et al. 2011. The study on vertical variability of PM10 and the possible sources on a 220 m tower, in Tianjin, China[J]. Atmospheric Environment, 45(34): 6133–6140. DOI:10.1016/j.atmosenv.2011.08.040 |
| [${referVo.labelOrder}] | 周敏, 陈长虹, 乔利平, 等. 2013. 2013年1月中国中东部大气重污染期间上海颗粒物的污染特征[J]. 环境科学学报, 2013, 33(11): 3118–3126. |