 2017, Vol. 37


2. 福建农林大学海峡两岸水土保持协同创新中心, 福州 350002
2. Co-innovation center for soil and water conservation in red soil region of the Cross-straits, Fujian Agriculture and Forestry University, Fuzhou 350002
PM2.5是指空气动力学直径小于或等于2.5 μm的颗粒物(Particulate Matter, PM)(Shahid et al., 2016), 其对全球大气环境、气候变化、生态系统和人类健康有显著影响(Keshtkar et al., 2007; Miura et al., 1997).生物质燃烧是PM2.5的重要来源, Zhang等(2013)研究表明每年约97%的PM2.5来源于生物质和矿物质燃烧.秸秆燃烧是生物质燃烧的一个重要组成部分, 研究显示, 全球1979、1990和2001年的生物质燃烧量分别为6800、8680和8600 Tg (Andreae et al., 2001), 其中农作物秸秆占10%左右(Van der Werf et al., 2010).秸秆燃烧排放大量的PM2.5, 促进环境阴霾的形成, 严重影响区域空气能见度. Cao等(2005)研究表明PM2.5等颗粒物对太阳光具有很强的吸收和散射能力, 被认为是导致地球温暖化和降低能见度的元凶之一.大量的PM严重刺激眼、鼻、咽喉以及皮肤, 损伤肺粘膜而引发哮喘, 甚至引起白血病和癌症(Organization, 2006; Naeher et al., 2007; Kulle, 2008).此外, 不同作物秸秆燃烧排放的PM2.5化学组分有所不同, 稻谷、玉米、油料等作物燃烧排放的PM2.5颗粒物中, OC (organic carbon)、EC (elemental carbon)和一些化学元素如Al、Ca、Fe、Si、Mg、Cd和Hg等浓度含量有明显差异(Zong et al. 2016;Zhang et al., 2013;Ni et al., 2015;Li et al., 2009).
中国是一个农业大国, 农作物秸秆资源更加丰富, 年产量占全球农作物秸秆总量的17.29%(Bi et al., 2010), 占亚洲的63.4%(Yevich et al., 2003).华东地区是我国主要粮食产区, 小麦、玉米、稻谷、豆类等产量占全国的23.4%(2001-2015统计年鉴), 大量的秸秆需要在农作物收获后和再次轮作前被清理(Gupta et al., 2004).大量调查表明中国农作物秸秆利用率不高, 大量的秸秆被丢弃或就地焚烧(Bhatia et al., 2013). Cao等(2011)研究表明2007年中国秸秆燃烧PM2.5排放量为1.32 Mt. Zhang等(2016)指出中国每年有1.04 Mt PM2.5是来源于农作物秸秆野外焚烧.此外, 苏继峰等(2012)和朱佳雷等(2012)利用卫星遥感火点数据分析了长三角地区秸秆露天焚烧对周边环境的影响.何敏等(2015)运用卫星遥感火点数据对四川省秸秆露天焚烧排放污染物的空间分布特征进行了探讨.目前有关农作物秸秆燃烧颗粒物排放量的研究多为单一年份研究, 缺乏长时间尺度动态变化的分析, 此外估算污染物总量时, 多用单一排放因子代表各类农作物排放因子甚至忽略室内外燃烧排放因子的差异, 易造成较大估算误差.
本文综合国内外相关研究及中国统计资料对华东地区过去15年间的农作物秸秆燃烧释放PM2.5的时空变化进行分析.主要研究目标为:①估测出2000-2014年华东各区域农作物秸秆燃烧类型和总量;②估算各区域PM2.5的排放总量;③定量判断各区域污染物时空变化, 为相关模型研究和政府大气环境污染防控提供科学依据.
2 资料和方法(Data and methods)本研究以华东6个省、市(山东、江苏、安徽、上海、浙江和福建)为研究区域, 根据不同农作物秸秆燃烧排放因子及各地区秸秆产量, 估测华东地区2000-2014年秸秆燃烧释放PM2.5的总量及时空变化.
2.1 资料来源目前华东地区农作物秸秆处理主要分为3种形式:直接丢弃、露天焚烧和居室内燃烧.其中露天燃烧的秸秆量来源于中国能源统计年鉴, 居民室内作为燃料燃烧的秸秆数据来自中国能源统计年鉴(2001-2015).农作物产量数据来自中国统计年鉴(2001-2015).卫星火点数据来源于MODIS (Moderate Resolution Imaging Spectrometer)林火数据产品, MODIS林火产品在监测植被火灾方面具有良好的可靠性(Justice et al., 2002; Amraoui et al., 2015).本研究使用的是1 km精度的每日尺度MOD14A1产品.研究提取了2000-2014年华东地区卫星火点数据并与植被类型图(1 km精度)进行叠加, 提取农田火点数据, 数据包含了每个火点地理坐标和时间.数据统计表明2000-2014年间华东地区农作物秸秆室外燃烧火点个数为1, 767, 077次.本研究计算需要的谷草比采用Liu等(2007)和Yuan等(2002)估算中国大陆生物质量时采用的谷草比的平均值(表 1).目前中国大陆秸秆露天焚烧的统计资料比较缺乏, 因此, 本研究采用田贺忠等(2011)露天秸秆燃烧比例统计数据(表 2).不同农作物秸秆燃烧效率采用Zarate等(2000)和Wang等(2012)的研究结论, 其中各农作物平均露天燃烧效率为80%;室内燃烧采用Zhang等(2008)研究结论, 平均燃烧效率为92.5%.
| 表 1 各种作物干物质质量与作物产量的比值 Table 1 Residue to product ratio of various crops |
| 表 2 各地区秸秆不同燃烧比例的分类 Table 2 Classification of straw combustion ratio in different regions |
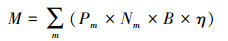
秸秆室内外燃烧量计算公式见式(1)(Lu et al., 2011).
|
(1) |
式中:M为作物类型;P为第m种作物的产量(t);N为第m种作物的谷草比;B为秸秆作为燃料燃烧和露天焚烧的比例;η为露天秸秆的燃烧效率或室内燃烧效率.
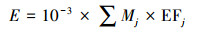
2.3 秸秆燃烧排放污染物计算依据查阅相关统计资料和文献获得的基础数据和排放因子, 分省区计算各个区域排放的PM2.5总量.计算公式见式(2)(Lu et al., 2011).
|
(2) |
式中: E为PM2.5排放量(t);Mj为第j种生物质的燃烧量(t);EFj为第j种物质燃烧后PM2.5的排放因子(g·kg-1).
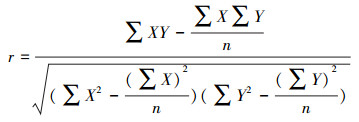
2.4 烟气排放量变化趋势及显著性 2.4.1 Pearson相关系数方法Pearson相关系数方法是一种统计学方法, 可以定量地衡量变量之间的相关关系, Pearson相关系数取值为[-1, +1], 相关系数为+1或-1时, 表示完美线性相关关系, 相关系数为0时, 表示没有线性相关关系.
Pearson相关系数的计算公式如式(3)所示.
|
(3) |
式中, 变量X表示x轴上的所有坐标点的集合, 变量Y表示y轴上所有坐标点的集合, n表示点的个数, r为相关系数.
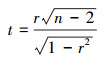
|
(4) |
式中, r表示相关系数, n表示点的个数, t表示t-检验的t值.
2.4.2 Mann趋势检验法(Mann, 2004)Mann趋势检验法是一种非参数统计检验方法.该方法优点不需要遵循一定分布, 不受少量异常值的干扰, 更适用于时间序列变化的数据趋势检验(Hamed et al., 1988).公式如下:
对于时间序列xi, 在i时刻(i=1, 2, …, n-1), 有
| $ $ | (5) |
可见, ri是i时刻以后的数值xj(j=i+1, …, n)大于该时刻值xi的样本个数.
计算统计量
|
(6) |
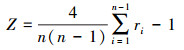
显见, 对于递增直线, ri序列为n-1, n-2, …, 1, 这时Z=1, 反之Z=-1, Z值在[-1, +1]
给定显著性水平α, 假定α=0.05, 则判据
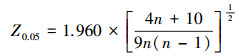
|
(7) |
若|Z|>Z0.05, 则认为变化趋势在α=0.05显著性水平下显著.
2.5 PM2.5的空间分布农作物秸秆野外焚烧具有较强的空间异质性, 传统统计方法很难准确揭示火点的空间分布.卫星遥感数据很好的保留了数据的空间信息同时具有分辨率高、定位准确和探测快速等特点, 目前广泛应用火点空间分布和烟气排放等领域的研究(何敏等, 2015).本研究基于MODIS林火数据产品和植被分布图, 提取作物秸秆火点数据.具体方法如下:
① 以省为单位, 统计各省范围内火点总数.
② 利用ARCGIS将整个研究区域网格化(10 km×10 km), 并提取各网格内火点数量, 根据式(8)获取每个网格空间权重.

|
(8) |
式中, Ei为i网格的分配权重, FCi为i网格内农作物室外燃烧火点个数, FCk为k省或市总火点个数.
③ 根据各区域室外秸秆焚烧排放PM2.5总量, 结合网格权重得到基于遥感卫星火点PM2.5网格排放量.
2.6 排放因子的确定针对不同农作物和燃烧类型选用不同的排放因子是精确估测PM2.5排放总量的重要前提.本文综合国内学者研究结果, 对众多研究结果取平均值作为本研究的秸秆燃烧排放因子.由于排放因子受到农作物品种、区域环境等因素影响, 因此本文综合国内秸秆室内外燃烧的排放因子(表 3).
| 表 3 不同秸秆燃烧排放因子 Table 3 Emission factors of PM2.5 from different types of straw burning |
根据统计年鉴统计算出华东地区主要农作物2000-2014年秸秆总产量.图 1显示各区域农作物秸秆产量和农作物秸秆种类所占比例存在显著差异.华东地区2000-2014年各区域农作物秸秆总产量为2033.2 Mt, 其中稻谷、小麦、玉米、豆类和油菜秸秆总产量分别为671.6、725.5、437.6、76.3和122.2 Mt.各农作物秸秆年平均产量为44.8、48.4、29.2、5.1和8.1 Mt. Cao等(2008)估算了中国大陆2000-2003农作物秸秆焚烧量, 其中华东地区年均农作物秸秆产量约为180.0 Mt, 略高于本文研究年平均秸秆产量135.6 Mt, 原因为Cao等统计的是所有农作物秸秆总量, 而本文对象为稻谷、小麦、玉米、豆类和油菜等主要农作物秸秆. Zhang等(2008)研究表明华东地区农作物秸秆总产量为100 Mt, 低于本研究的年平均产量, 原因为Zhang等研究没有包含油菜和豆类秸秆.
 |
| 图 1 2000-2014年华东地区农作物秸秆总量区域分布 Fig. 1 Regional distribution of total production of crop straw in Eastern China during 2000-2014 |
基于中国统计年鉴数据, 分区域统计华东地区2000-2014年15年不同农作物秸秆燃烧总量(表 4).华东地区15年间主要农作物秸秆室内燃烧总量为127984.65 Wt (8532.31 Wt·a-1), 其中稻谷44757.83 Wt、小麦45050.49 Wt、玉米24057.64 Wt、豆类5026.60 Wt和油菜秸秆9092.09 Wt;农作物秸秆野外焚烧总量为32678.59 Wt (2178.57 Wt·a-1), 其中稻谷、小麦、玉米、豆类和油菜秸秆分别为:10803.92、11027.18、8090.11、1190.68、1566.71 Wt.估算结果显示2000-2014间农作物秸秆室内年均燃烧量为8532.31 Wt, 占总秸秆量的79.66%, 该结论与Zhang等(2008)研究结果一致.
| 表 4 估算各省室内外农作物燃料质量 Table 4 Estimations of indoor and outdoor burning amount in different provinces |
图 2表明2000-2014年各区域PM2.5排放总量有较大差异.华东地区单位面积PM2.5排放量从高到低依次是:江苏、安徽、山东、上海、浙江和福建.各农作物秸秆燃烧排放PM2.5所占比例也存在差异, 华东地区2000-2014年各区域农作物秸秆燃烧排放PM2.5总量为851.95 Wt, 年均排放量分别为56.80 Wt, 陆炳等(2011)研究2007年中国农作物秸秆燃烧, 其中华东地区农作物秸秆燃烧排放PM2.5量为879.2 kt, 显著高于本研究结论, 主要是陆炳等估算是所有农作物秸秆燃烧排放PM2.5的总量, 本研究仅涉及油菜、豆类、小麦等5种主要农作物.
 |
| 图 2 2000-2014年华东地区农作物秸秆燃烧排放污染物总量区域分布 Fig. 2 Regional distribution of total emissions of pollutants from straw burning in Eastern China during 2000-2014 |
图 2显示上海农作物秸秆燃烧排放PM2.5总量为5.02 Wt (0.33 Wt·a-1), 稻谷、小麦和油菜秸秆燃烧排放PM2.5占94.5%, 其它两种农作物秸秆燃烧不足6%;江苏排放总量为267.27 Wt (17.82 Wt·a-1), 稻谷秸秆燃烧排放PM2.5占该区域44.16%, 次之为小麦的26.21%, 剩余3种植物占29.63%;浙江排放总量为53.71 Wt (3.58 Wt·a-1), 稻谷和油菜秸秆燃烧排放PM2.5占88.48%, 其余3种作物仅占11.52%;安徽排放总量为266.64 Wt (17.78 Wt·a-1), 稻谷、小麦和油菜秸秆燃烧排放PM2.5占85.90%, 其余两种作物仅占14.10%;福建排放总量为26.47 Wt (1.76 Wt·a-1), 稻谷秸秆燃烧排放PM2.5占90.08%, 其余4种作物仅占9.92%;山东排放总量为232.83 Wt (15.52 Wt·a-1), 小麦和玉米秸秆燃烧排放PM2.5占95.71%, 其余3种仅占4.29%. 朱佳雷等(2012)研究表明长三角地区江苏、安徽、浙江和上海地区农作物燃烧排放PM2.5量分别为:62.3、65.2、14.3和1.7 Wt都高于本研究结果, 因为朱佳雷等研究是统计所有农作物秸秆燃烧为基础, 本研究仅统计稻谷、小麦、玉米等5种主要作物秸秆.
3.4 华东地区农作物秸秆燃烧PM2.5空间分布基于研究区域火点分布情况及PM2.5的空间排放, 运用ARCGIS把华东地区依GWS-84投影划分为0.1° × 0.1°的网格, 将农作物秸秆2000-2014年室外燃烧火点和PM2.5分配到各区域.图 3a显示2000-2014年各区域秸秆室外燃烧火点总量空间分布, 火点在区域上分布是不均匀, 图 3a显示山东南部、安徽北部、江苏东北部、浙江东北部和上海市火点较密集, 福建省全省、浙江中部和南部、安徽南部和山东中部地区作物秸秆室外燃烧火点较少.秸秆野外焚烧受农作物面积、农户收入和区位条件等影响(何敏等, 2015).
 |
| 图 3 2000-2014年华东地区秸秆室外燃烧火点总量空间分布(a)和室外燃烧排放PM2.5总量空间分布(b) Fig. 3 Spatial distributions of fire point of straw burning (a) and total emissions of PM2.5 from straw burning (b) in Eastern China in 2000-2014 |
图 3b显示, 山东省秸秆燃烧PM2.5排放有较多的高值区域, 单位网格PM2.5最大的排放量多集中在山东省;安徽省北部、江苏中部和北部、浙江东北部和上海区域PM2.5排放较多, 而福建全省、浙江中南部、安徽中南部和江苏大部分区域秸秆燃烧排放PM2.5量较少.该研究结果与苏继峰等(2012)和朱佳雷等(2012)研究长三角地区秸秆燃烧污染物排放空间分布趋势一致.
3.5 华东地区农作物秸秆燃烧PM2.5时间变化图 4为2000-2014年华东地区各农作物秸秆燃烧排放PM2.5的时间变化趋势.结果表明, 上海、福建和浙江总体呈下降趋势, 山东、江苏和安徽总体呈上升趋势, 主要由于2000-2014年上海、福建和浙江农作物播种面积总体呈递减趋势;山东、江苏和安徽农作物播种面积总体呈增加趋势(2000-2014). 黄利民等(2006), 陈瑜琦等(2008)和何敏等(2008)研究表明浙江、福建和上海农作物播种面积总体呈递减趋势, 区域农作物面积变化受经济水平、人均收入和农业劳动力等因素影响.本研究中安徽、山东和江苏变化趋势与其他学者研究结果一致(Ohara et al., 2007; Klimont et al., 2002; Sahai et al., 2007; Hayashi et al., 2014).
 |
| 图 4 2000-2014年华东地区秸秆燃烧排放PM2.5总量时间变化(EPM2.5为PM2.5排放量) Fig. 4 Annual variation of PM2.5 emission from straw burning in Eastern China during 2000-2014 |
图 5表明2000-2014年华东各地区农作物秸秆室外燃烧PM2.5排放比存在明显季节性差异.安徽、山东和江苏在6月, 10月排放量较大, 其中6月排放量分别占全年的71.2%、49.6%和53.0%;上海和浙江的排放峰值分别出现在5月和7-8月份, 其5月排放比分别为:34.9%和25.4%, 7月为:25.9%和25.4%;福建PM2.5排放比率保持平稳趋势.各区域秸秆室外燃烧排放PM2.5的季节性差异主要由于区域农作收获季节不同造成(Zhang et al., 2016).本研究关于PM2.5排放的季节差异与王书肖等(2008)和Zhang等(2016)的研究一致.
 |
| 图 5 2000-2014年华东地区各月份室外秸秆燃烧PM2.5排放比例(月排放量/年排放量) Fig. 5 Monthly distributions of PM2.5 emissions ratios from open straw burning in Eastern China during 2000-2014 |
运用Pearson相关系数和Mann变化趋势显著性检验分析华东地区PM2.5总量. 图 6为2000-2014年华东地区农作物秸秆燃烧排放PM2.5的动态变化, 显示农作物秸秆燃烧释放的PM2.5在时间和空间上不均衡分布. Mann趋势显著性检验结果表明PM2.5在山东、江苏和安徽呈显著增长趋势, 上海、浙江和福建呈显著降低趋势. Pearson相关系数法得出2000-2014年各污染物在华东地区与时间序列呈线性相关, 且达到显著水平(p < 0.05).
 |
| 图 6 2000-2014年华东地区秸秆燃烧排放PM2.5趋势检验 (注:▲显著增加; ▼显著降低; ρ:Pearson相关系数; *0.05水平上显著(双尾检验) Fig. 6 Trend test of PM2.5 emission from straw burning in Eastern China during 2000-2014 |
由于统计资料的缺乏, 目前只能根据中国统计年鉴(2000-2014)查到2004-2010年的工业粉尘排放量.查询结果显示2004-2010年华东地区工业粉尘排放随时间变化总体呈下降趋势, 与Liu等(2012)研究结果一致. 图 7显示2004-2010年, 安徽秸秆燃烧排放PM2.5占年工业粉尘排放比率变化趋势, 呈先降低后上升趋势;上海、浙江和福建变化趋势, 总体趋势保持平稳;江苏和山东秸秆燃烧排放PM2.5占工业粉尘排放比率总体成上升趋势.
 |
| 图 7 2004-2010年华东地区农作物秸秆燃烧排放PM2.5占工业粉尘排放比率变化 Fig. 7 Annual variation of the ratio of PM2.5 emission from straw burning to that from industrial particulate matters in Eastern China during 2004-2010 |
1) 华东地区2000-2014年农作物秸秆总产量为2033.2 Mt, 农作物秸秆--水稻秸秆、玉米秸秆、小麦秸秆、油菜秸秆和豆类秸秆总量分别为:671.6、725.5、437.6、76.3和122.2 Mt.
2) 华东地区农作物秸秆燃烧释放的不同污染物在时间和空间上具有明显差异.2000-2014年污染物PM2.5在山东、江苏和安徽呈显著增长趋势, 上海、福建和浙江呈显著降低趋势.
3) 单位网格PM2.5最大的排放量多集中山东;安徽北部、江苏中部和北部、浙江东北部和上海区域PM2.5排放相对较多, 而福建全省、浙江中南部、安徽中南部和江苏大部分区域秸秆燃烧排放PM2.5量相对较少.
4) 华东地区农作物秸秆室外燃烧排放PM2.5呈季节性差异;安徽、山东和江苏PM2.5排放高峰分别出现在5月和10月;上海和浙江的排放高峰为5月和7-8月份.
5) 稻谷、小麦、玉米、豆类和油菜秸秆燃烧对污染物PM2.5贡献率分别是32.45%、30.18%、18.95%、3.77%和14.65%, 稻谷和小麦秸秆对华东地区PM2.5的贡献率较大.
6) 华东2004-2010年农作物秸秆燃烧颗粒物与工业粉尘排放比山东、安徽和江苏总体呈上升趋势;上海、福建和浙江总体保持平稳趋势.
| [${referVo.labelOrder}] | Amraoui M, Pereira M G, DaCamara C C, et al. 2015. Atmospheric conditions associated with extreme fire activity in the Western Mediterranean region[J]. The Science of the Total Environment, s524-525 : 32–39. |
| [${referVo.labelOrder}] | Andreae M O, Merlet P. 2001. Emission of trace gases and aerosols from biomass burning[J]. Global Biogeochemical Cycles, 15(4) : 955–966. DOI:10.1029/2000GB001382 |
| [${referVo.labelOrder}] | Bhatia A, Jain N, Pathak H. 2013. Methane and nitrous oxide emissions from Indian rice paddies, agricultural soils and crop residue burning[J]. Greenhouse Gases Science & Technology, 3(3) : 196–211. |
| [${referVo.labelOrder}] | Bi Y, Wang Y, Gao C. 2010. Straw Resource Quantity and its Regional Distribution in China[J]. Journal of Agricultural Mechanization Research, 3(3) : 1–7. |
| [${referVo.labelOrder}] | Cao G L, Zhang X Y, Gong S L, et al. 2011. Emission inventories of primary particles and pollutant gases for China[J]. Chinese Science Bulletin, 56(8) : 781–788. DOI:10.1007/s11434-011-4373-7 |
| [${referVo.labelOrder}] | Cao J J, Wu F, Chow J C, et al. 2005. Characterization and source apportionment of atmospheric organic and elemental carbon during fall and winter of 2003 in Xi'an, China[J]. Atmospheric Chemistry & Physics, 5(11) : 3127–3137. |
| [${referVo.labelOrder}] | Cao G L, Zhang X, Sunling G, et al. 2008. Investigation on emission factors of particulate matter and gaseous pollutants from crop residue burning[J]. Journal of Environmental Sciences, 20(1) : 50–55. DOI:10.1016/S1001-0742(08)60007-8 |
| [${referVo.labelOrder}] | Cao G L, Lei S. 2007. Quantitive Appraisal of Biomass Energy and Its Geographical Distribution in China[J]. Journal of Natural Resources, 22(1) : 9–19. |
| [${referVo.labelOrder}] | Cao G L, Zhang X Y, Wang Y Q, et al. 2008. Estimation of emissions from field burning of crop straw in China[J]. Chinese Science Bulletin, 53(5) : 784–790. DOI:10.1007/s11434-008-0145-4 |
| [${referVo.labelOrder}] | 陈瑜琦, 李秀彬, 朱会义. 2008. 浙江省近期农作物播种面积的变化及其主导因素分析[J]. 资源科学, 2008, 30(4) : 609–614. |
| [${referVo.labelOrder}] | Gupta P K, Sahai S, Singh N, et al. 2004. Residue burning in rice-wheat cropping system:Causes and implications[J]. Currentence, 87(12) : 1713–1717. |
| [${referVo.labelOrder}] | Hamed K H, Rao A R. 1998. A modified Mann-Kendall trend test for autocorrelated data[J]. Journal of Hydrology, 204(1/4) : 182–196. |
| [${referVo.labelOrder}] | Hayashi K, Ono K, Kajiura M, et al. 2014. Trace gas and particle emissions from open burning of three cereal crop residues:Increase in residue moistness enhances emissions of carbon monoxide, methane, and particulate organic carbon[J]. Atmospheric Environment, 95(1) : 36–44. |
| [${referVo.labelOrder}] | 何敏, 王幸锐, 韩丽, 等. 2015. 四川省秸秆露天焚烧污染物排放清单及时空分布特征[J]. 环境科学, 2015, 36(4) : 1208–1216. |
| [${referVo.labelOrder}] | 黄利民, 刘成武. 2006.近20多年来中国农作物播种面积的变化特征[C] "自然地理学与生态建设"学术研讨会 |
| [${referVo.labelOrder}] | Justice C O, Giglio L, Korontzi S, et al. 2002. The MODIS fire products[J]. Remote Sensing of Environment, 83(1) : 244–262. |
| [${referVo.labelOrder}] | Jing C, Zhi G R, Chen Y J, et al. 2014. A Preliminary Study on Brown Carbon Emissions from Open Agricultural Biomass Burning and Residential Coal Combustion in China[J]. Research of Environmental Sciences, 27(5) : 455–461. |
| [${referVo.labelOrder}] | Keshtkar H, Ashbaugh L L. 2007. Size distribution of polycyclic aromatic hydrocarbon particulate emission factors from agricultural burning[J]. Atmospheric Environment, 41(13) : 2729–2739. DOI:10.1016/j.atmosenv.2006.11.043 |
| [${referVo.labelOrder}] | Klimont Z, Streets D G, Gupta S, et al. 2002. Anthropogenic emissions of non-methane volatile organic compounds in China[J]. Atmospheric Environment, 36(8) : 1309–1322. DOI:10.1016/S1352-2310(01)00529-5 |
| [${referVo.labelOrder}] | Kulle T J. 2008. Acute Odor and Irritation Response in Healthy Nonsmokers with Formaldehyde Exposure[J]. Inhalation Toxicology, 5(3) : 323–332. |
| [${referVo.labelOrder}] | Li X, Wang S, Duan L, et al. 2007. Particulate and trace gas emissions from open burning of wheat straw and corn stover in China[J]. Environmental Science & Technology, 41(17) : 6052–6058. |
| [${referVo.labelOrder}] | Li X H, Wang S X, Lei D, et al. 2009. Characterization of non-methane hydrocarbons emitted from open burning of wheat straw and corn stover in China[J]. Environmental Research Letters, 4(4) : 940–941. |
| [${referVo.labelOrder}] | Liu R J, Zhang Z H. 2012. Decomposition of Impact Factors of Industrial Dust Emission in China[J]. Environmental Science & Technology, 35(12) : 244–248. |
| [${referVo.labelOrder}] | 刘刚, 沈镭. 2007. 中国生物质能源的定量评价及其地理分布[J]. 自然资源学报, 2007, 22(1) : 9–19. |
| [${referVo.labelOrder}] | 陆炳, 孔少飞, 韩斌, 等. 2011. 2007年中国大陆地区生物质燃烧排放污染物清单[J]. 中国环境科学, 2011, 31(2) : 186–194. |
| [${referVo.labelOrder}] | Lu Z, Zhang Q, Streets D G. 2011. Sulfur dioxide and primary carbonaceous aerosol emissions in China and India, 1996-2010[J]. Atmospheric Chemistry & Physics, 11(18) : 9839–9864. |
| [${referVo.labelOrder}] | Mann M E. 2004. On smoothing potentially non-stationary climate time series[J]. Geophysical Research Letters, 31(7) : 10–1029. |
| [${referVo.labelOrder}] | Miura Y, Kanno T. 1997. Emissions of trace gases (CO2, CO, CH4 and N2O) resulting from rice straw burning[J]. Soil Science & Plant Nutrition, 43(4) : 849–854. |
| [${referVo.labelOrder}] | Naeher L P, Michael B, Michael L, et al. 2007. Woodsmoke health effects:a review[J]. Inhalation Toxicology, 19(1) : 67–106. DOI:10.1080/08958370600985875 |
| [${referVo.labelOrder}] | Ni H, Han Y, Cao J, et al. 2015. Emission characteristics of carbonaceous particles and trace gases from open burning of crop residues in China[J]. Atmospheric Environment, 123 : 399–406. DOI:10.1016/j.atmosenv.2015.05.007 |
| [${referVo.labelOrder}] | Ohara T, Akimoto H, Kurokawa J, et al. 2007. An Asian emission inventory of anthropogenic emission sources for the period 1980-2020[J]. Atmospheric Chemistry & Physics, 7(3) : 6843–6902. |
| [${referVo.labelOrder}] | Organization W H. 2006. WHO air quality guidelines for particulate matter, ozone, nitrogen dioxide and sulfur dioxide:Summary of risk assessment[M].World Health Organization.1-20 |
| [${referVo.labelOrder}] | Qin Y, Xie S D. 2011. Historical estimation of carbonaceous aerosol emissions from biomass open burning in China for the period 1990-2005[J]. Environmental Pollution, 159(12) : 3316–3323. DOI:10.1016/j.envpol.2011.08.042 |
| [${referVo.labelOrder}] | Sahai S, Sharma C, Singh D P, et al. 2007. A study for development of emission factors for trace gases and carbonaceous particulate species from in situ burning of wheat straw in agricultural fields in india[J]. Atmospheric Environment, 41(39) : 9173–9186. DOI:10.1016/j.atmosenv.2007.07.054 |
| [${referVo.labelOrder}] | Shahid I, Kistler M, Mukhtar A, et al. 2016. Chemical characterization and mass closure of PM10 and PM2.5at an urban site in Karachi-Pakistan[J]. Atmospheric Environment, 128 : 114–123. DOI:10.1016/j.atmosenv.2015.12.005 |
| [${referVo.labelOrder}] | 苏继峰, 朱彬, 康汉青, 等. 2012. 长江三角洲地区秸秆露天焚烧大气污染物排放清单及其在空气质量模式中的应用[J]. 环境科学, 2012, 33(5) : 1418–1424. |
| [${referVo.labelOrder}] | 唐喜斌, 黄成, 楼晟荣, 等. 2014. 长三角地区秸秆燃烧排放因子与颗粒物成分谱研究[J]. 环境科学, 2014, 35(5) : 1623–1632. |
| [${referVo.labelOrder}] | 田贺忠, 赵丹, 王艳. 2011. 中国生物质燃烧大气污染物排放清单[J]. 环境科学学报, 2011, 31(2) : 349–357. |
| [${referVo.labelOrder}] | Van der Werf G, Randerson J T, Giglio L, et al. 2010. Global fire emissions and the contribution of deforestation, savanna, forest, agricultural and peat fires (1997-2009)[J]. Atmospheric Chemistry & Physics, 10(23) : 11707–11735. |
| [${referVo.labelOrder}] | 王书肖, 张楚莹. 2008. 中国秸秆露天焚烧大气污染物排放时空分布[J]. 中国科技论文, 2008, 3(5) : 329–333. |
| [${referVo.labelOrder}] | Wang Q, Geng C, Lu S H, et al. 2012. Emission factors of gaseous carbonaceous species from residential combustion of coal and crop residue briquettes[J]. Frontiers of Environmental Science & Engineering, 7(1) : 66–76. |
| [${referVo.labelOrder}] | Wei W, Zhang W, Hu D, et al. 2012. Emissions of carbon monoxide and carbon dioxide from uncompressed and pelletized biomass fuel burning in typical household stoves in China[J]. Atmospheric Environment, 56 : 136–142. DOI:10.1016/j.atmosenv.2012.03.060 |
| [${referVo.labelOrder}] | Yevich R, Logan J A. 2003. An assessment of biofuel use and burning of agricultural waste in the developing world[J]. Global Biogeochemical Cycles, 17(4) : 1084–1086. |
| [${referVo.labelOrder}] | Yuan Z, Wu C Z, Huang H, et al. 2002. Research and development on biomass energy in China[J]. International Journal of Energy Technology & Policy, 1(1) : 108–144. |
| [${referVo.labelOrder}] | Zarate I O D, Ezcurra A, Lacaux J P, et al. 2000. Emission factor estimates of cereal waste burning in Spain[J]. Atmospheric Environment, 34(19) : 3183–3193. DOI:10.1016/S1352-2310(99)00254-X |
| [${referVo.labelOrder}] | Zhang H, Ye X, Cheng T, et al. 2008. A laboratory study of agricultural crop residue combustion in China:Emission factors and emission inventory[J]. Atmospheric Environment, 42(36) : 8432–8441. DOI:10.1016/j.atmosenv.2008.08.015 |
| [${referVo.labelOrder}] | Zhang L, Liu Y, Hao L. 2016. Contributions of open crop straw burning emissions to PM2.5 concentrations in China[J]. Environmental Research Letters, 11(1) : 014014. DOI:10.1088/1748-9326/11/1/014014 |
| [${referVo.labelOrder}] | Zhang Y, Shao M, Lin Y, et al. 2013. Emission inventory of carbonaceous pollutants from biomass burning in the Pearl River Delta Region, China[J]. Atmospheric Environment, 76 : 189–199. DOI:10.1016/j.atmosenv.2012.05.055 |
| [${referVo.labelOrder}] | Zong Z, Wang X, Tian C, et al. 2016. Biomass burning contribution to regional PM2.5 during winter in the North China[J]. Atmospheric Chemistry & Physics : 1–41. |
| [${referVo.labelOrder}] | 朱佳雷, 王体健, 邓君俊, 等. 2012. 长三角地区秸秆焚烧污染物排放清单及其在重霾污染天气模拟中的应用[J]. 环境科学学报, 2012, 32(12) : 3045–3055. |