工业革命以来,人为活动排放大量的二氧化硫(SO2).20世纪60年代中期起,全球SO2年排放量就持续超过100 Tg(Smith et al.,2011).大气中的SO2经过气相反应和液相反应,形成硫酸盐气溶胶,并通过大范围长距离迁移造成区域乃至全球影响(Langner et al.,1991; Takemura et al.,2005; Tarrason et al.,1998).硫酸盐气溶胶不仅严重影响近地面空气质量,还通过直接辐射效应(散射太阳辐射)和间接辐射效应(气溶胶-云相互作用)影响地球系统的能量收支平衡(Haywood et al.,2000; Kiehl et al.,2000).作为最重要的制冷效应气候胁迫因子,硫酸盐气溶胶直接辐射强迫全球平均为(-0.35±0.13)W·m-2(Myhre et al.,2013),在强度上与CH4(+0.48±0.05)W·m-2或对流层O3(+0.35 [-0.1,+0.3])W·m-2基本相当,约为CO2(+1.66±0.17)W·m-2的1/4,约为BC(+0.2±0.15)W·m-2的2倍,但方向相反,可以在一定程度上缓解温室效应,对全球气候变化产生重要影响(Forster et al.,2007).与此同时,对于硫酸盐气溶胶辐射效应(尤其是间接辐射效应)的科学认知,目前还远不如温室气体.IPCC第5次评估报告指出对气溶胶间接辐射效应认知度的评级为“ low confidence”,这给全球气候变化的现状评估和未来预测都带来极大的不确定性(Boucher et al.,2013; Gunnar Myhre et al.,2013).
近年来,在硫酸盐气溶胶高浓度地区,针对硫酸盐浓度及硫沉降开展区域模型模拟的研究较多,如中国(Ge et al.,2014; Qiao et al.,2015; Wang et al.,2013; Yang et al.,2015)、印度(Bandyopadhyay,2009)、巴基斯坦(Muhammad Zeeshaan Shahid,2015)、波兰(Kryza et al.,2010)、英国(Dore et al.,2015)、美国东部(Mathur et al.,2008)等,为了解区域污染的时空分布特征及区域SO2的排放控制提供了丰富的研究成果.硫酸盐的长距离传输及跨区域影响方面,也有一些文献报道.Koch等(2007)研究了东南亚对全球硫酸盐的贡献,结果表明,东南亚贡献了全球硫酸盐气溶胶的10%并将其中的2/3输送到了北半球.Quinn等(2009)的研究表明中纬度地区排放的大气污染物(包括硫)是北极雾霾的主要来源.Fairlie等(2009)的研究则讨论了美国俄亥俄州硫排放对美国巴尔的摩的硫酸盐气溶胶浓度的影响.Aikawa等(2010)的研究估算了中国排放对日本硫酸盐气溶胶的影响.但是,由于SO2排放清单的更新较慢,一定程度上影响了前述研究的时效性.而且区域间的影响无疑是相互交叉的,仅强调某区域对另一区域的影响略显片面.
因此,本研究采用目前较新的全球SO2排放清单(HTAP-v2),使用比较流行的大气化学模式Mozart-4(The Model for Ozone and Related chemical Tracers,version4),模拟全球SO2浓度、硫酸盐浓度及硫沉降的空间分布和季节变化.并采用联合国气候变化框架条约(United Nations Framework Convention on Climate Change-UNFCCC)推荐的Normalized Residual Attribution Method(NRAM)方法研究全球各大区域间的跨界传输及交叉影响.
2 数据与方法(Data and methodology) 2.1 数据本研究涉及的数据有:
(1) 2010年全球SO2网格化排放清单HTAP_v2,空间分辨率为0.1°×0.1°.该清单由MICS-Asia、EPA-US/Canada、TNO等清单综合集成,包括航空、海运、电力、工业、陆路交通和居民生活等SO2排放源(HTAP 2010 Part A,2010).
(2) 全球海洋二甲基硫(DMS-dimethyl sulfide)排放清单.根据该清单,2010年全球DMS排放总量为28.10 Tg S(Lana et al.,2011).
(3) 美国国家环境预报中心(NCEP:http://www.ncep.noaa.gov)的风场、降雨等气象数据,主要用于Mozart-4的基础数据更新.
(4) 地面实测大气SO2和硫酸盐浓度数据,主要用于模型验证.实测数据包括:美国国家环保局空气质量系统(AQS)实测数据(http://www.epa.gov;SO2实测数据461个、硫酸盐实测数据65个)、欧洲监测与评估项目(EMEP)实测数据(http://www.emep.int;SO2实测数据84个、硫酸盐实测数据38个)、东亚酸雨网实测数据(EANET)(http://www.eanet.asia;SO2实测数据38个、硫酸盐实测数据36个).
2.2 全球分区综合考虑排放和自然地理因素,本研究将全球陆地划分为8个大区(表 1).
| 表 1 全球分区 Table 1 Individual regions of the globe |
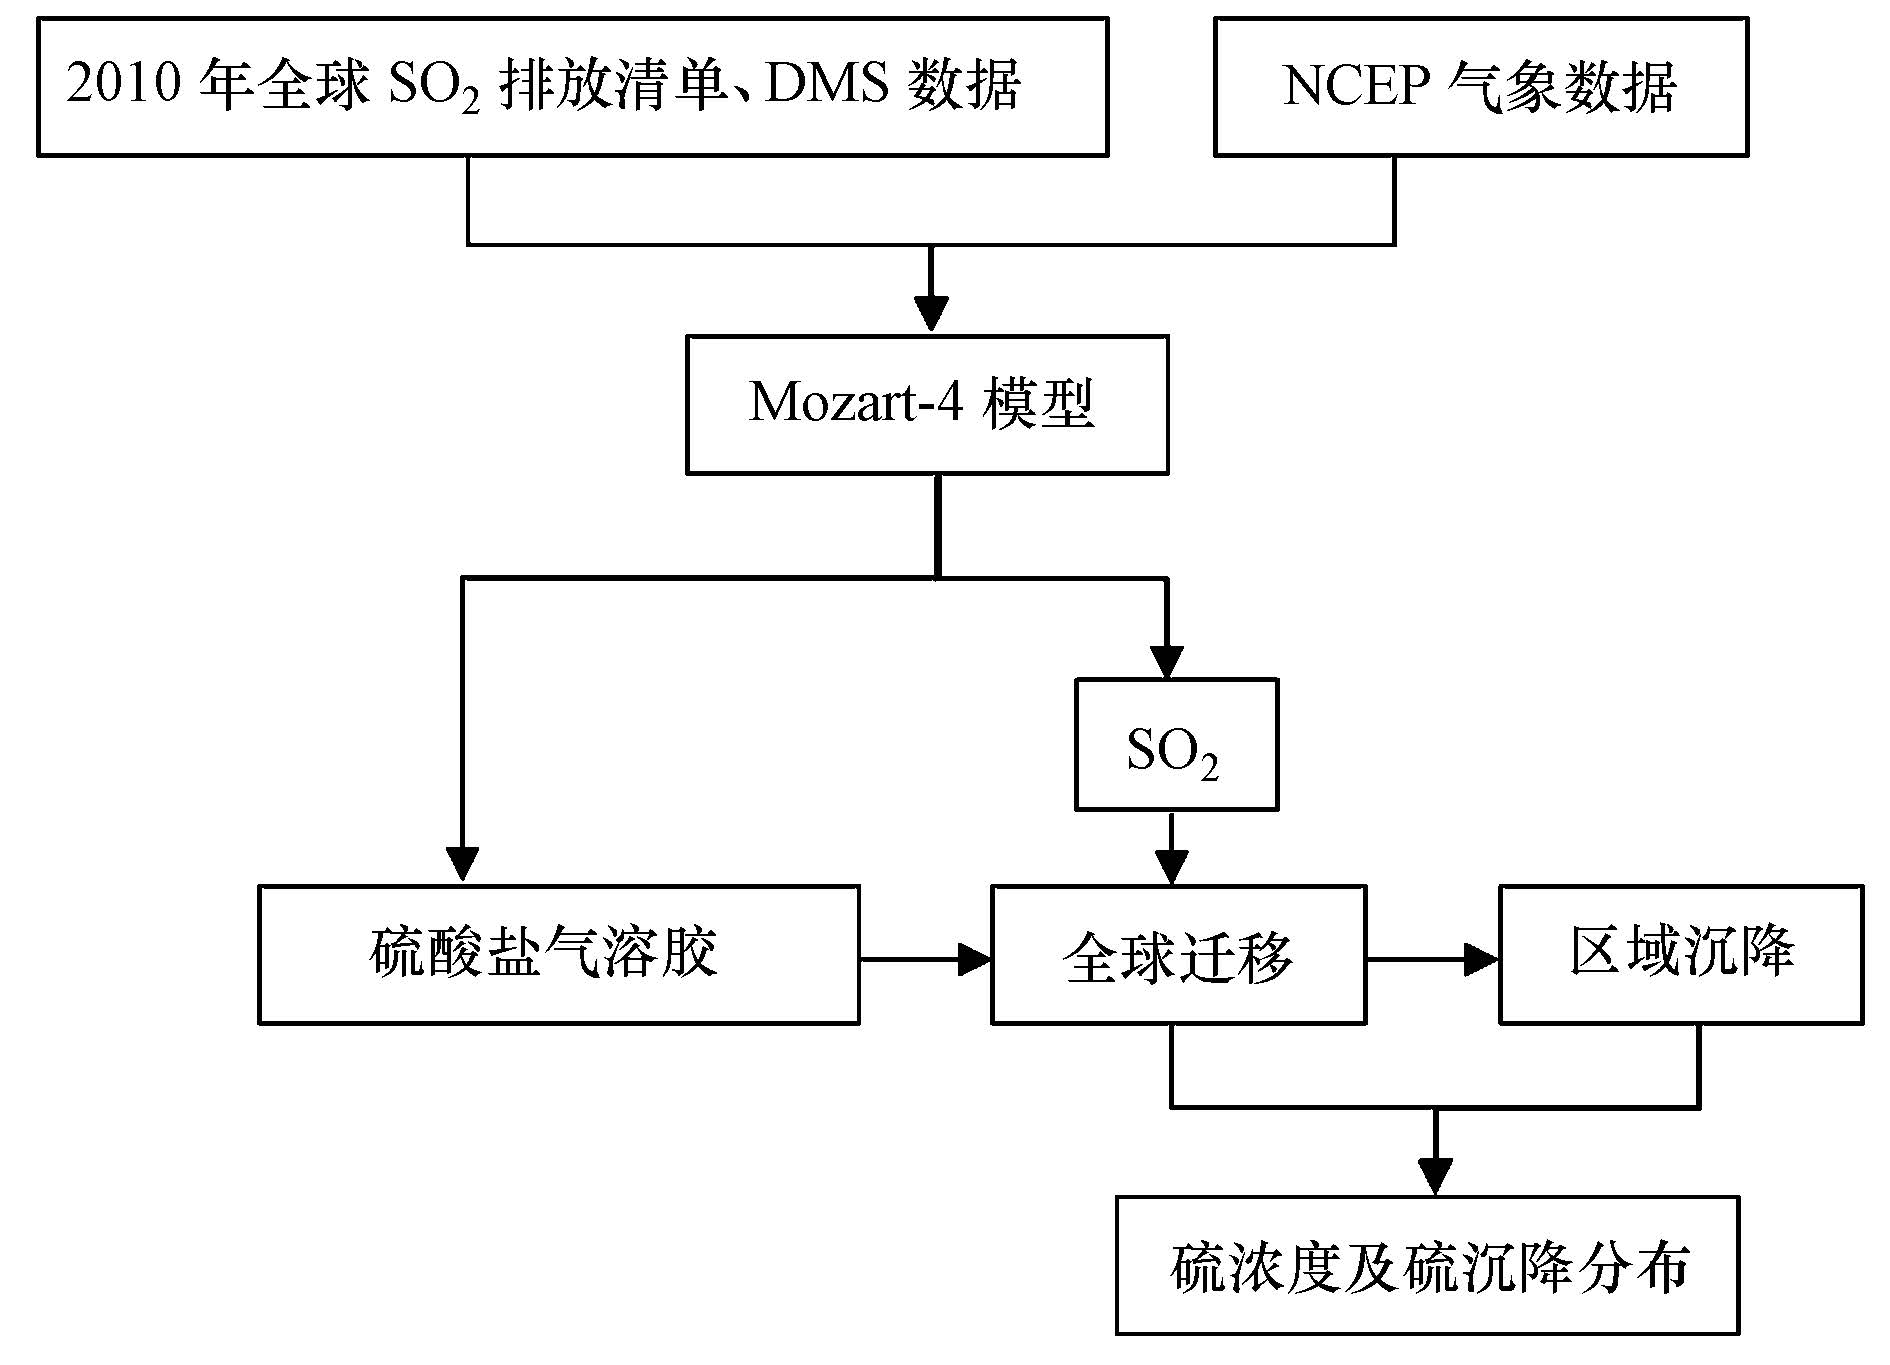
本研究采用美国国家大气研究中心(NCAR)的大气化学模式Mozart-4进行相关模拟计算(Emmons et al.,2010).该模型综合考虑SO2向硫酸盐转化的化学反应过程、硫酸盐气溶胶的全球迁移传输过程、硫的干湿沉降过程,被广泛应用于全球和区域尺度的气溶胶综合效应研究.模型分辨率为1.875°×1.875°、垂直分28层.近地面层上界为地表大气压99.5%处,约75 m.最顶层上界为地表大气压0.27%处,约15000 m(Emmons et al.,2010).除排放清单及气象数据,其他数据采用模型自带数据包.该模拟计算的技术路线如图 1所示:
 |
| 图 1 全球硫循环模拟技术路线 Fig. 1 Framework for modeling global sulfur cycle |
研究不同区域间的交叉影响,核心是多区域贡献的非线性解析问题.本研究采用UNFCCC推荐的NRAM方法,根据Mozart-4模型多次模拟结果解析区域间的交叉影响(Trudinger et al.,2005).NRAM方法说明:先对全球排放进行模拟,再“除去某区域的排放”(all-but-one)进行模拟.公式表示如下:

|
式中:Qj(t)为j区对全球浓度的贡献;θ为浓度计算模型;E(0... t)为全球排放;Ej(0... t)为除去j 区后的排放.
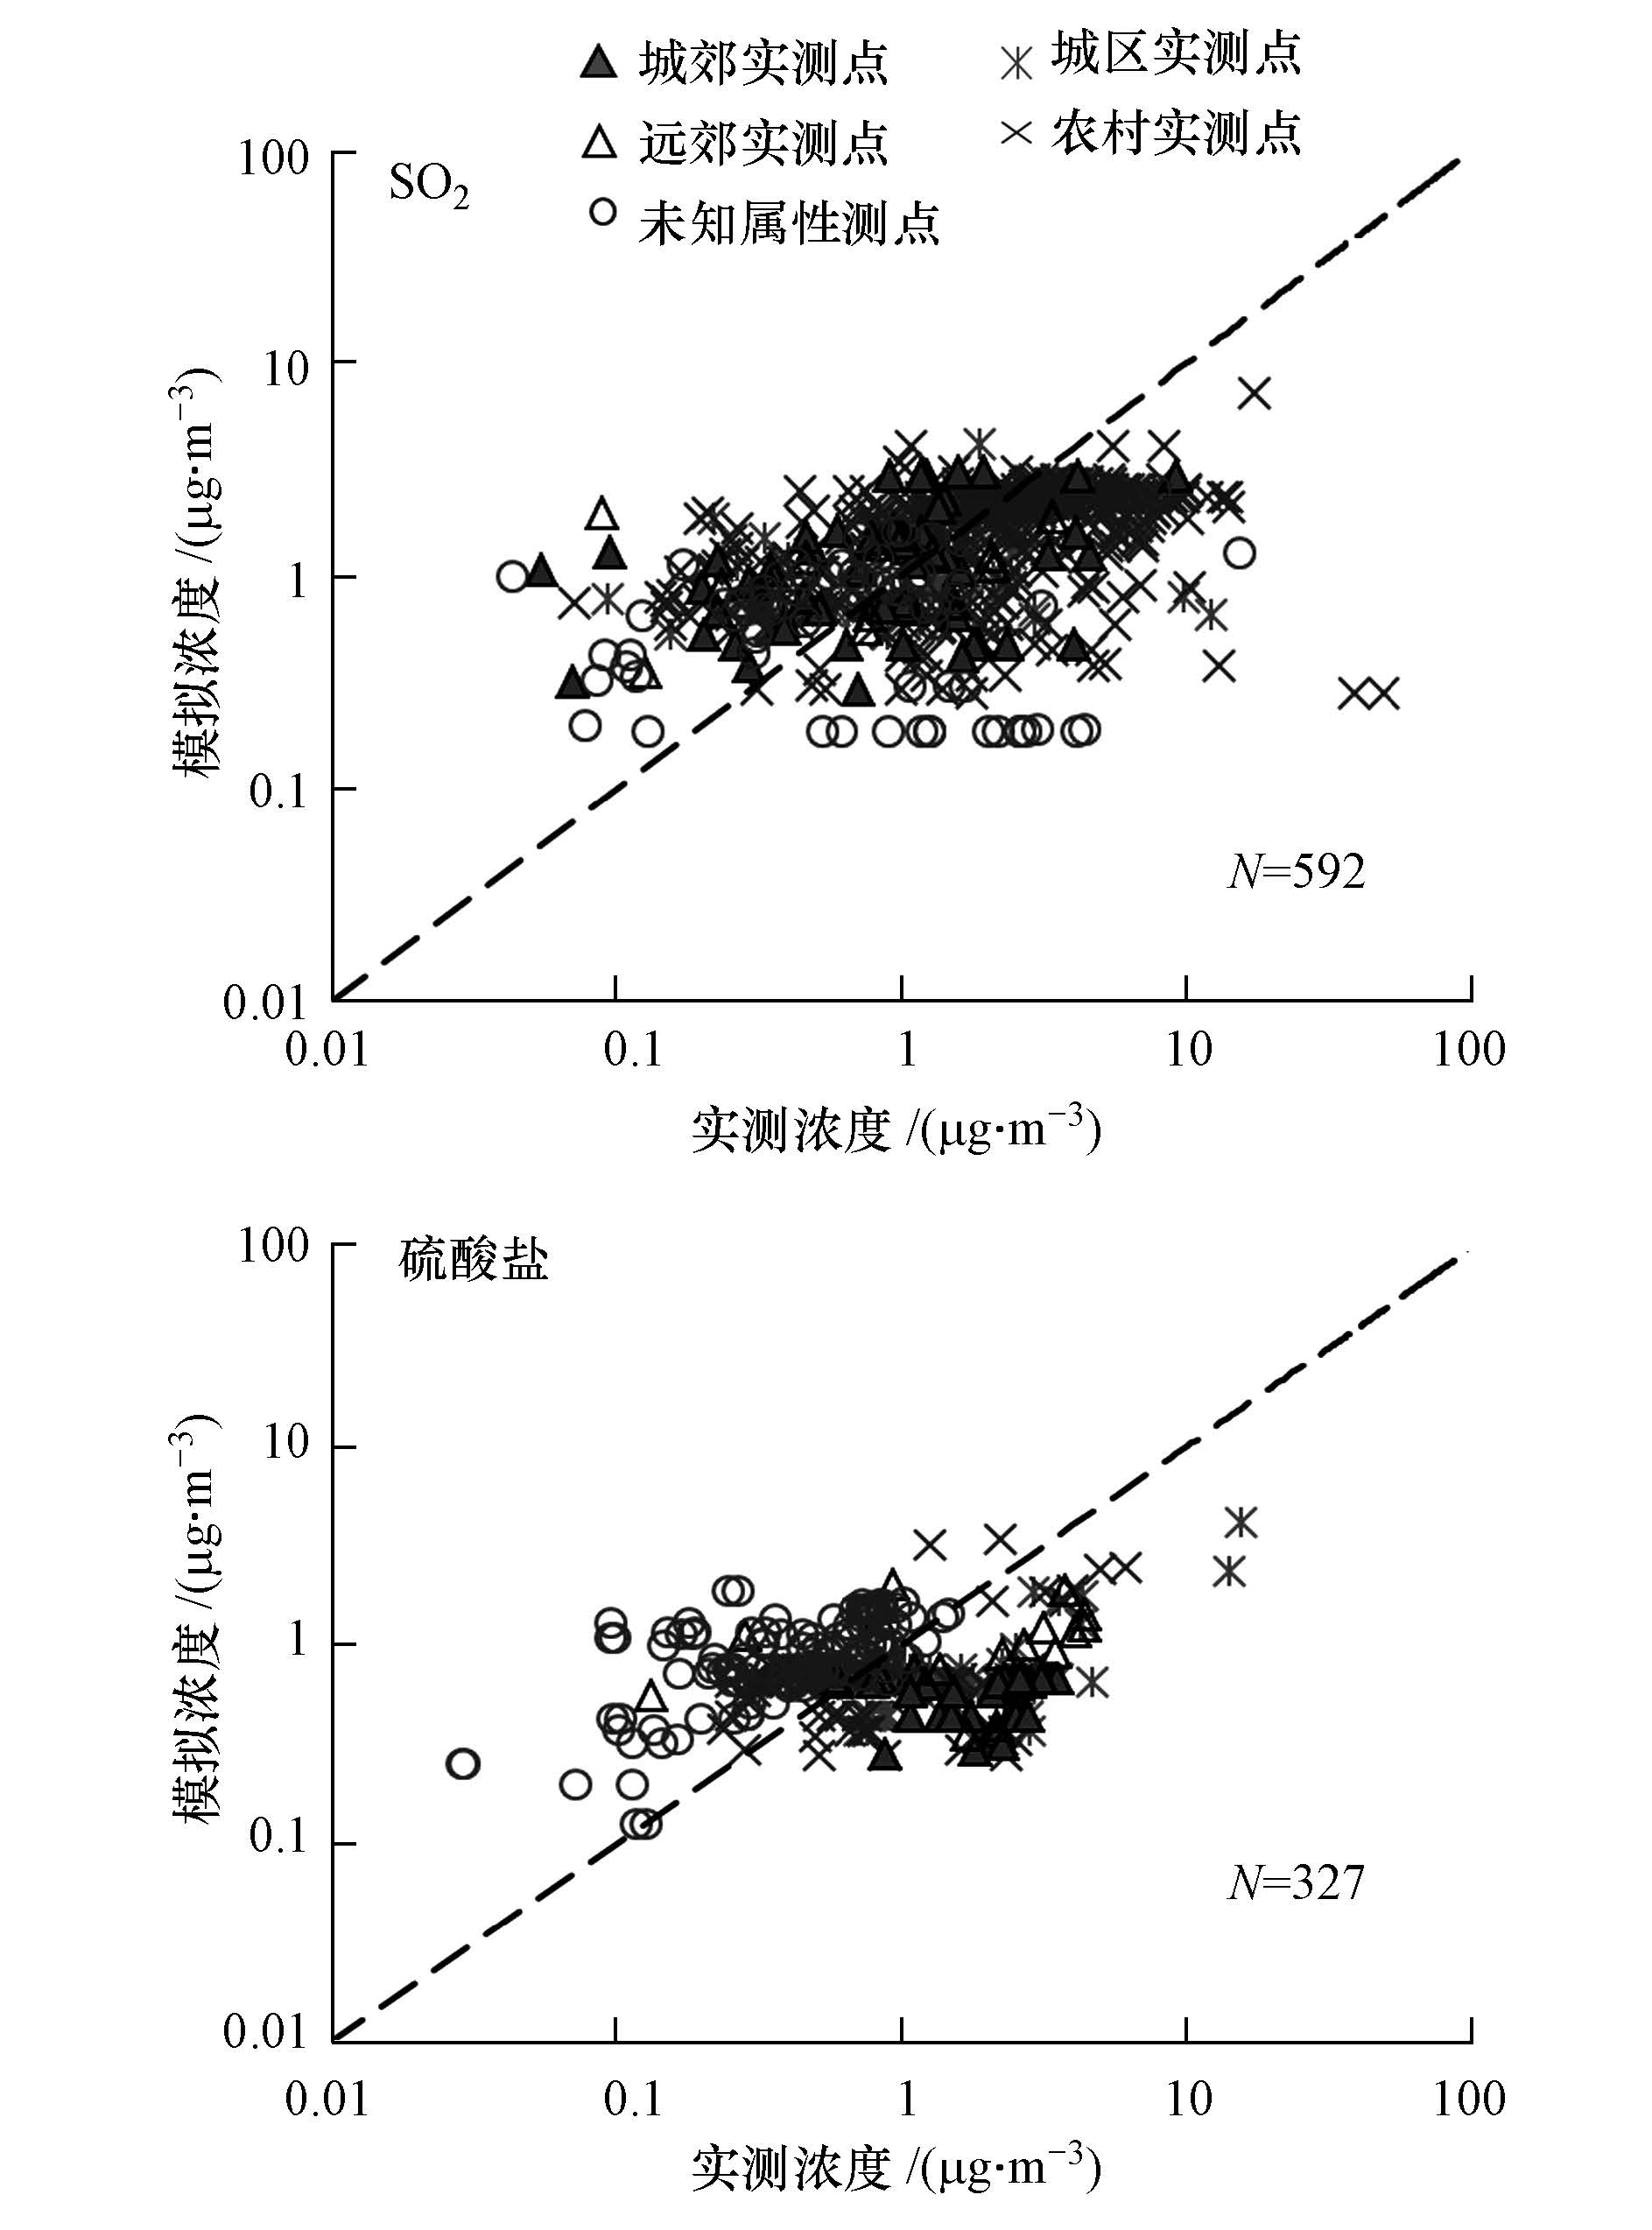
3 结果与讨论(Results and discussion) 3.1 模型验证为验证Mozart-4在本研究中的精度,根据图 1所示技术路线,模拟2010年全球大气SO2近地面浓度、硫酸盐近地面浓度,并取各网格点年均值与相应实测值比对,相应实测值为对应网格中实测数据的平均值.验证结果如图 2所示(图中黑色虚线为1∶1参考线).
 |
| 图 2 Mozart-4模拟SO2及硫酸盐浓度与实测浓度 Fig. 2 Comparison of observations and modeled SO2 and sulfate concentrations from Mozart-4 |
从图 2可以看出,尽管大网格全球尺度模拟时常见的“低值高估、高值低估”的现象依然存在,但模拟值与实测值吻合较好,未见明显的系统误差.
3.2 全球大气硫循环将Mozart-4模型计算结果全年统计,2010年全球大气硫循环如表 2所示.需说明的是,文中统一采用TgS作为大气硫循环的统计结果单位、采用μgS·m-2作为硫酸盐或SO2柱浓度的统计结果单位.
| 表 2 2010年全球大气硫循环 Table 2 Global atmospheric sulfur cycle of 2010 |
2010年全球大气硫排放80.76 TgS,总沉降量为79.66 TgS.大气硫沉降以湿沉降为主,约占2/3(66.86%),其中SO2湿沉降16.31%、硫酸盐湿沉降50.53%.大气硫的干沉降量约占总沉降的1/3(33.14%),其中SO2干沉降27.14%、硫酸盐干沉降6.02%.另一方面,大气硫沉降中硫酸盐(56.55%)略高于SO2(43.45%).但硫酸盐主要以湿沉降形式离开大气,SO2主要以干沉降形式离开大气.此外,大气硫残留量1.1 TgS,约占总排放量的1.36%,可以估算大气硫的平均生命周期约为4.97d,与文献报道结果大致相符(Langner et al.,1991; Tarrason et al.,1998).
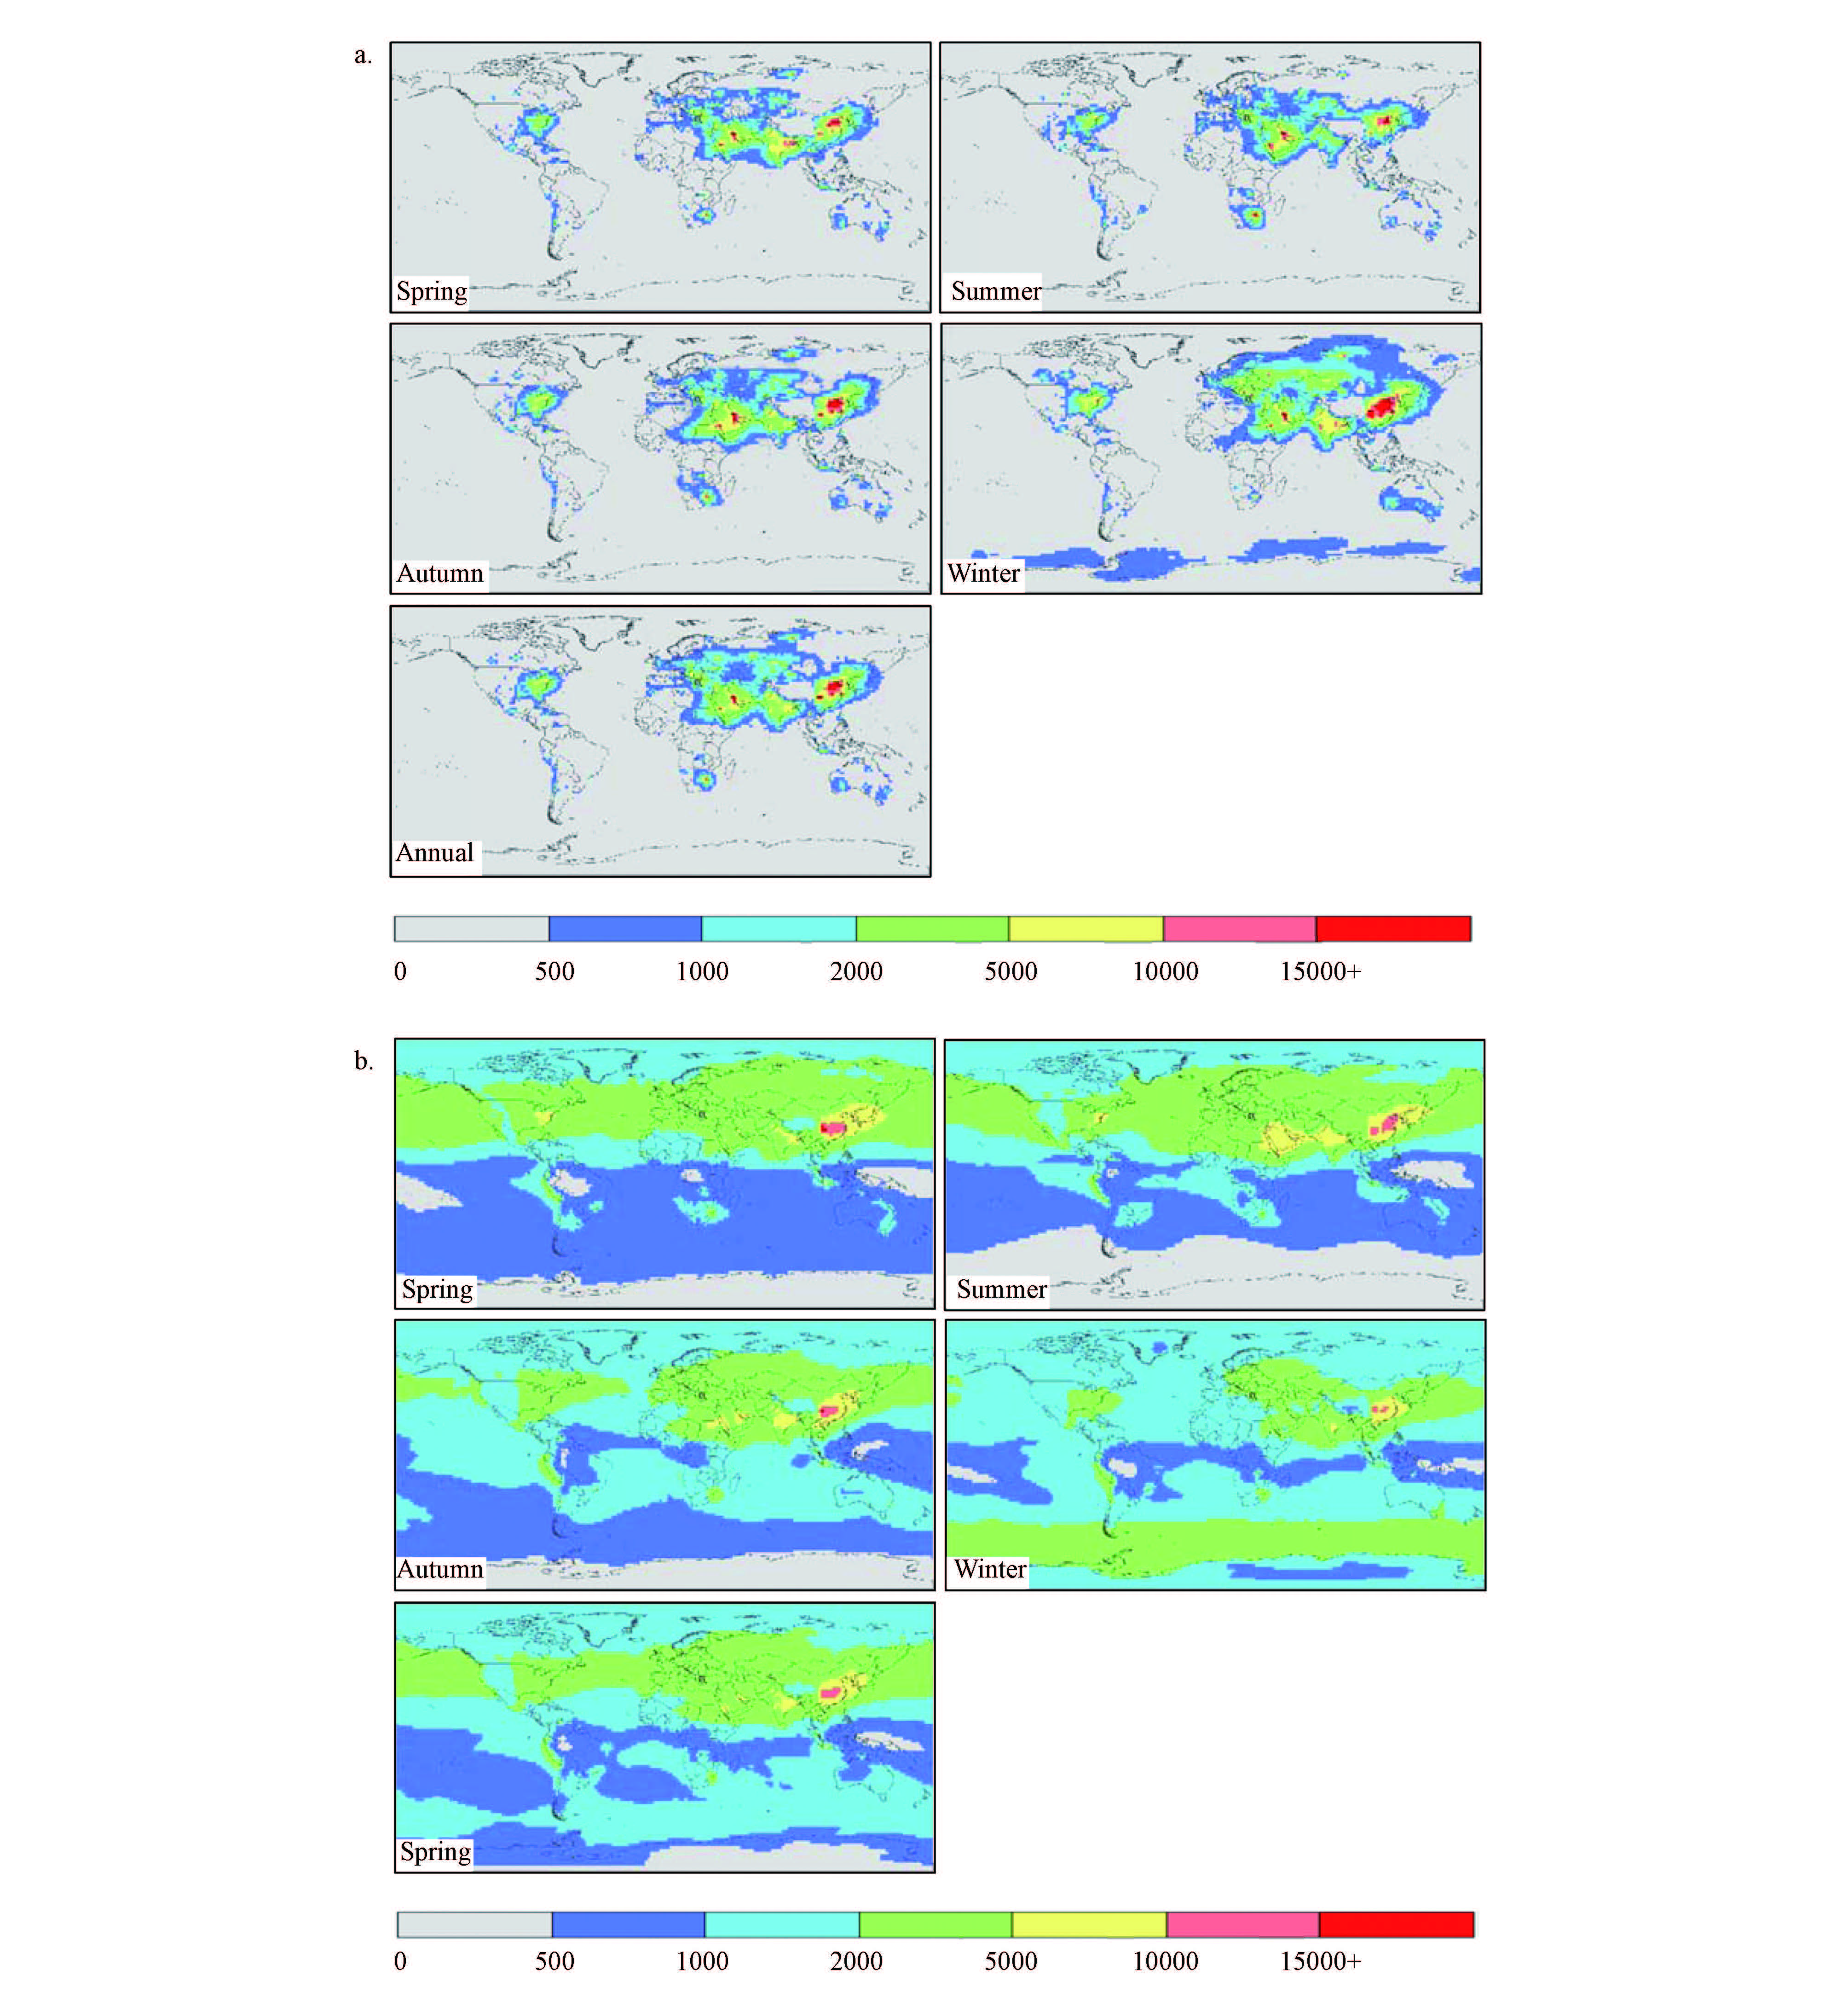
3.3 大气SO2及硫酸盐柱浓度篇幅所限,本研究仅讨论全球SO2及硫酸盐的大气柱浓度.图 3分别为全球SO2和硫酸盐大气柱浓度的4季及年均分布图.
 |
| 图 3 2010年全球SO2大气柱浓度(a)和硫酸盐柱浓度(b),μgS·m-2 Fig. 3 Global column concentration of atmospheric SO2(a)and sulfate concentration(b)for 2010,μgS·m-2 |
从图 3可以看出,硫酸盐的全球迁移与混合程度远高于SO2,亦即地表排放的SO2更多表现为局部或区域影响,而硫酸盐则具明显的全球影响.
图 3a中所示大气SO2柱浓度以中东及南亚(年均3629.27 μgS·m-2)、东亚(年均2808.38 μgS·m-2)两区最高,这可能与该两区域全球最高的SO2排放强度直接相关.南美的大气SO2柱浓度最低(年均181.06 μgS·m-2),仅为中东及南亚的1/20.由春、夏、秋、冬4季分布图可知,全球大气SO2柱浓度在春、夏、秋3季的浓度分布差异不大,冬季(12月、1-2月)高值区域(>10000 μgS·m-2)和中值区域(1000~10000 μgS·m-2)有明显扩大的趋势.全球陆地8个区域大气SO2柱浓度均表现出冬季(北半球12月、1-2月,南半球6-8月)最高、夏季(北半球6-8月,南半球12月、1-2月)最低的规律.这可能是因为北半球冬季的低温导致SO2向硫酸盐的转化率低,SO2浓度则相应较高.研究表明,北半球中纬度地区冬季SO2氧化率仅为夏季的1/6~1/7(Tarrason et al.,1998).
图 3b中所示大气硫酸盐柱浓度显示,全球硫酸盐柱年均值都超过500 μgS·m-2.其中,东亚区域最高(年均4556.58 μgS·m-2),南美最低(年均1014.33 μgS·m-2).北半球5个区域的大气硫酸盐柱都超过2000 μgS·m-2,南半球3个区域也都超过1000 μgS·m-2,最高值(>10000 μgS·m-2)出现在东亚东北部.与SO2相反,北半球5个区域中,秋、冬两季硫酸盐柱浓度均值普遍低于春、夏两季.中东及南亚、东亚、欧洲、中北美、中亚及俄罗斯的夏季硫酸盐柱浓度均值依次为5260、5220、3160、2350、2610 μgS·m-2,冬季则依次为2770 、3490 、2080、1650、1980 μgS·m-2.在南半球的夏季(12月,1-2月),南美、非洲的硫酸盐柱浓度均值分别为1128和2138 μgS·m-2,冬季 (6-8月)则分别为866和1305 μgS·m-2.东南亚及大洋洲的硫酸盐柱浓度浓度均值夏季(992.94 μgS·m-2)略低于冬季(1354.58 μgS·m-2),春、秋两季差异不大.
3.4 全球大气硫迁移2010年全球硫迁移通量分区域统计如表 3所示(净通量为+表示净输出,净通量为-表示净输入),表 3显示,全球陆地区域中仅非洲和中亚及俄罗斯两个区域表现为净输入,其他6个区域均表现为净输出,且以东亚净输出最高.海洋区域则为最大的硫净输入区域,净输入量高达9.26 TgS.为进一步展现全球各区域之间的硫迁移细节,表 4列出各区域间的硫输入与输出通量,由表 4可知,东亚、中北美、中东及南亚3个区域对海洋的输出最高.除开海洋区域,中东及南亚的主要向非洲输出,北美主要向欧洲和中亚及俄罗斯输出,欧洲则主要向中亚及俄罗斯输出,东亚的主要输出区域亦为中亚及俄罗斯.陆地8个区域中,东亚(7区)、中东及南亚(6区)、中北美(1区)的总输出列前三,这与该3区域的SO2年排放排名相符.非洲(3区)总输入最高,主要来自海洋(9区)和中东及南亚(6区).中亚及俄罗斯(5区)的总输入也较高,主要来自欧洲(4区)、东亚(7区)、中东及南亚(6区).
| 表 3 2010年全球硫迁移分区统计 Table 3 Outflow and inflow of sulfur for individual regions of the globe in 2010 |
| 表 4 2010年全球各区域间的硫输入与输出通量 Table 4 Sulfur flux among individual regions of the globe in 2010 |
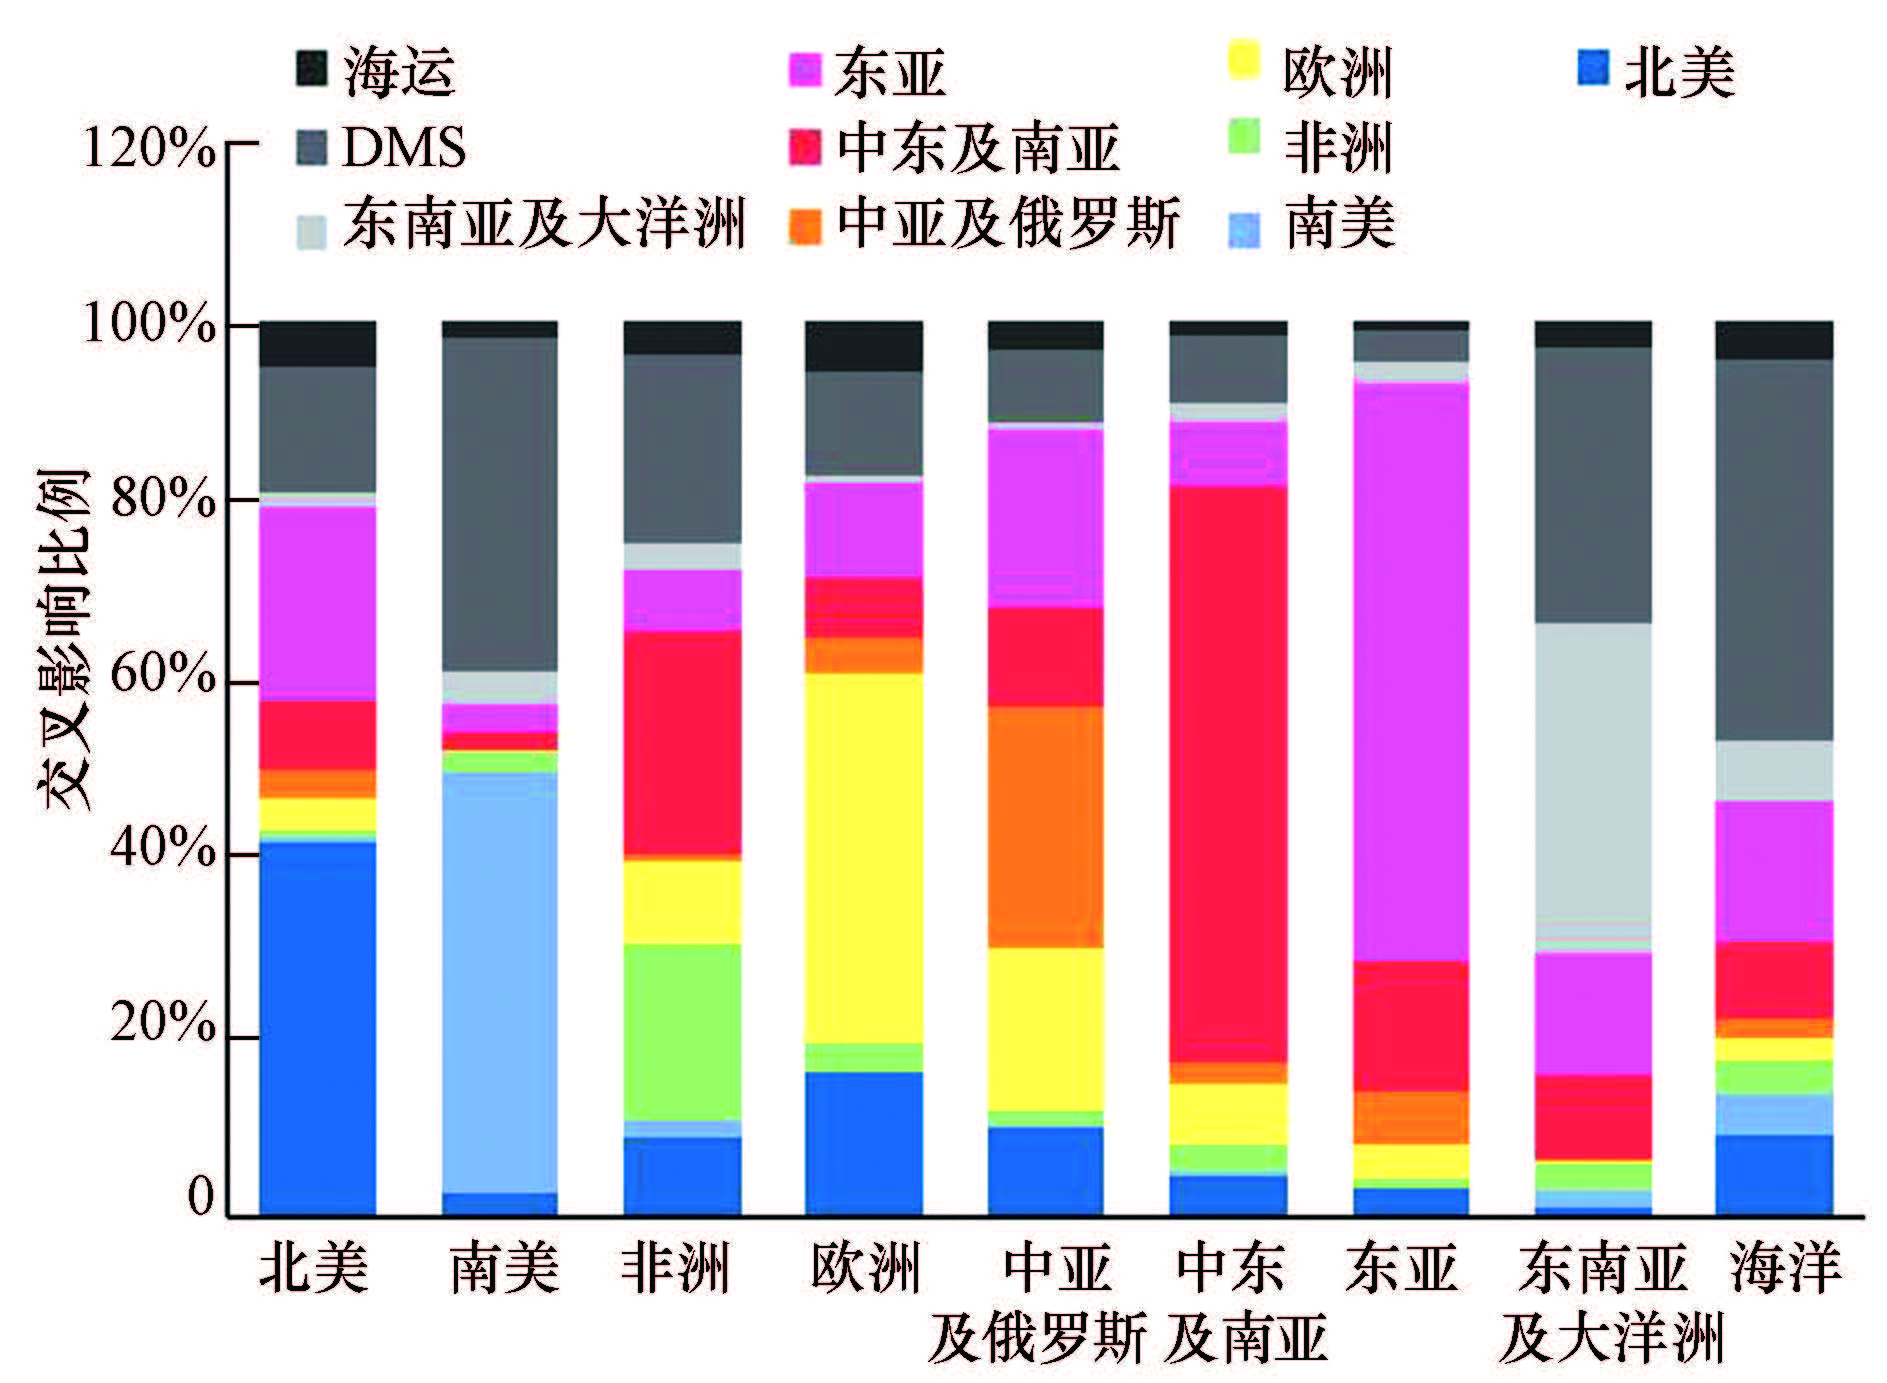
如前所述,由于硫酸盐的全球迁移与混合程度远高于SO2,大气SO2浓度主要受本地排放主导,硫沉降也更多表现为局部或区域影响.区域交叉影响更多体现在大气硫酸盐柱浓度上.本研究采用NRAM方法,根据Mozart-4模型多次模拟结果解析区域间的交叉影响(Trudinger and Enting,2005).结果见图 4.
 |
| 图 4 2010年全球各区域硫酸盐柱浓度的交叉影响 Fig. 4 Cross attribution of atmospheric column concentration among individual regions of the globe in 2010 |
由图 4可知,对于全球SO2排放强度最高的两区域而言,东亚区域的大气硫酸盐柱浓度主要是本地贡献(64.45%),区外贡献为35.55%(中东及南亚贡献14.72%,中亚及俄罗斯贡献5.90%);中东及南亚区域类似,其大气硫酸盐柱浓度的本地贡献为64.29%,区外贡献为35.71%(海洋DMS贡献7.48%,东亚贡献7.16%,欧洲贡献6.83%).受外区域影响最高的是非洲,区外贡献比例高达80.54%,其中中东及南亚贡献24.99%,海洋DMS排放贡献21.02%,欧洲贡献9.34%.中亚及俄罗斯的区外贡献比例也高达73.00%,主要来自东亚(19.77%)、欧洲(17.94%)、中东及南亚(11.37%).欧洲的区外贡献比例也较高(58.73%),主要来自中北美(16.04%)、海洋DMS排放(11.55%)和东亚(10.42%).中北美的大气硫酸盐柱浓度受区外影响约为58.34%,主要来自东亚(21.45%)和海洋DMS排放(14.16%).南美主要受海洋DMS排放的影响,比例高达37.11%.海洋大气硫酸盐浓度受全球陆地的影响为57.31%,主要来自东亚(15.72%)、中北美(9.51%)、中东及南亚(8.72%)、东南亚及大洋洲(6.56%).另一方面,海洋DMS排放对南美和东南亚及大洋洲的大气硫酸盐柱浓度影响最大,分别高达37.11%和25.52%.
4 结论(Conclusions)综上所述,本研究结论如下:2010年大气硫的平均生命周期约为4.97 d.大气硫沉降以湿沉降为主(66.86%)、以硫酸盐形式为主(56.55%).全球大气SO2柱浓度和硫酸盐柱浓度均以东亚和中东及南亚最高,南美最低,与区域排放强度直接相关.冬季大气SO2柱浓度高、夏季大气硫酸盐柱浓度高,主要与SO2的氧化率有关.东亚、中东及南亚是全球硫净输出最高的区域,非洲、中亚及俄罗斯是全球硫净输入最高的区域.全球各区域间的交叉影响主要体现在大气硫酸盐柱浓度上.受外区域影响最高的是非洲、中亚及俄罗斯,海洋DMS排放影响最大的区域是南美、东南亚及大洋洲.
| [1] | Aikawa M, Ohara T, Hiraki T, et al. 2010. Significant geographic gradients in particulate sulfate over Japan determined from multiple-site measurements and a chemical transport model: Impacts of transboundary pollution from the Asian continent[J]. Atmospheric Environment , 44 (3) : 381–391. DOI:10.1016/j.atmosenv.2009.10.025 |
| [2] | Bandyopadhyay A. 2009. Prediction of ground level concentration of sulfur dioxide using ISCST3 model in Mangalore industrial region of India[J]. Clean Technologies and Environmental Policy , 11 (2) : 173–188. DOI:10.1007/s10098-008-0188-x |
| [3] | Boucher O, Randall D, Artaxo P, et al. 2013. Clouds and Aerosols: In Climate Change 2013: The Physical Science Basis Contribution of Working Group I to the Fifth Assessment Report of the Intergovernmental Panel on Climate Change[M]. Cambridge, United Kingdom and New York, NY, USA: Cambridge University Press . |
| [4] | Dentener F, Keating T, Akimoto H. 2010. Hemispheric transport of air pollution 2010 PART A: Ozone and particulate matter air pollution studies No.17[M]. New York and Geneva: United Nations Publication . |
| [5] | Dore A J, Carslaw D C, Braban C, et al. 2015. Evaluation of the performance of different atmospheric chemical transport models and inter-comparison of nitrogen and sulphur deposition estimates for the UK[J]. Atmospheric Environment , 119 (2015) : 131–143. |
| [6] | Emmons L K, Walters S, Hess P G, et al. 2010. Description and evaluation of the Model for Ozone and Related chemical Tracers, version 4 (MOZART-4)[J]. Geoscientific Model Development , 3 (1) : 43–67. DOI:10.5194/gmd-3-43-2010 |
| [7] | Fairlie T D, Szykman J, Gilliland A, et al. 2009. Lagrangian sampling of 3-D air quality model results for regional transport contributions to sulfate aerosol concentrations at Baltimore, MD, in summer 2004[J]. Atmospheric Environment , 43 (20) : 3275–3288. DOI:10.1016/j.atmosenv.2009.02.026 |
| [8] | Forster P, Ramaswamy V, Artaxo P, et al. 2007. Changes in Atmospheric Constituents and in Radiative Forcing. In: Climate Change 2007: The Physical Science Basis. Contribution of Working Group I to the Fourth Assessment Report of the Intergovernmental Panel on Climate Change[M]. Cambridge, United Kingdom and New York, NY, USA: Cambridge University Press . |
| [9] | Ge B Z, Wang Z F, Xu X B, et al. 2014. Wet deposition of acidifying substances in different regions of China and the rest of East Asia: Modeling with updated NAQPMS[J]. Environmental Pollution , 187 : 10–21. DOI:10.1016/j.envpol.2013.12.014 |
| [10] | Haywood J, Boucher O. 2000. Estimates of the direct and indirect radiative forcing due to tropospheric aerosols: A review[J]. Reviews of Geophysics , 38 (4) : 513–543. DOI:10.1029/1999RG000078 |
| [11] | Kiehl J T, Schneider T L, Rasch P J, et al. 2000. Radiative forcing due to sulfate aerosols from simulations with the National Center for Atmospheric Research Community Climate Model, Version 3[J]. Journal of Geophysical Research: Atmospheres , 105 (D1) : 1441–1457. DOI:10.1029/1999JD900495 |
| [12] | Koch D, Bond T C, Streets D, et al. 2007. Global impacts of aerosols from particular source regions and sectors[J]. Journal of Geophysical Research: Atmospheres , 112 (D2) . |
| [13] | Kryza M, Blas M, Dore A J, et al. 2010. Fine-resolution modeling of concentration and deposition of nitrogen and sulphur compounds For Poland-application of the FRAME model[J]. Archives of Environmental Protection , 36 : 49–61. |
| [14] | Lana A, Bell T G, Simó R, et al. 2011. An updated climatology of surface dimethlysulfide concentrations and emission fluxes in the global ocean[J]. Global Biogeochemical Cycles , 25 (1) . |
| [15] | Langner J, Rodhe H. 1991. A global three-dimensional model of the tropospheric sulfur cycle[J]. Journal of Atmospheric Chemistry , 13 (3) : 225–263. DOI:10.1007/BF00058134 |
| [16] | Mathur R, Roselle S, Pouliot G, et al. 2008. Diagnostic analysis of the three-dimensional sulfur distributions over the eastern United States using the CMAQ model and measurements from the ICARTT field experiment, in: Air Pollution Modeling and Its Application XIX[M]. Springer, Netherlands . |
| [17] | Shahid M Z, Liao H. 2015. Seasonal Variations of Aerosols in Pakistan: Contributions of Domestic Anthropogenic Emissions and Transboundary Transport[J]. Aerosol and Air Quality Research , 15 : 1580–1600. |
| [18] | Myhre G, Samset B H, Schulz M, et al. 2013. Radiative forcing of the direct aerosol effect from AeroCom Phase Ⅱ simulations[J]. Atmospheric Chemistry and Physics , 13 : 1853–1877. DOI:10.5194/acp-13-1853-2013 |
| [19] | Myhre G, Shindell D, Bréon F M, et al. 2013. Anthropogenic and natural radiative forcing. In Climate Change 2013: The Physical Science Basis. Contribution of Working Group I to the Fifth Assessment Report of the Intergovernmental Panel on Climate Change[M]. Cambridge University Press, Cambridge: United Kingdom and New York, NY, USA . |
| [20] | Qiao X, Tang Y, Hu J, et al. 2015. Modeling dry and wet deposition of sulfate, nitrate, and ammonium ions in Jiuzhaigou National Nature Reserve, China using a source-oriented CMAQ model: Part I[J]. Base case model results [J]. Science of The Total Environment , 532 : 831–839. |
| [21] | Quinn P K, Bates T S, Schulz K, et al. 2009. Decadal trends in aerosol chemical composition at Barrow, Alaska: 1976-2008[J]. Atmospheric Chemistry and Physics , 9 : 8883–8888. DOI:10.5194/acp-9-8883-2009 |
| [22] | Smith S J, Aardenne V J, Klimont Z, et al. 2011. Anthropogenic sulfur dioxide emissions: 1850-2005[J]. Atmospheric Chemistry and Physics , 11 : 1101–1116. DOI:10.5194/acp-11-1101-2011 |
| [23] | Takemura T, Nozawa T, Emori S, et al. 2005. Simulation of climate response to aerosol direct and indirect effects with aerosol transport-radiation model[J]. Journal of Geophysical Research: Atmospheres , 110 (2) : 169–190. |
| [24] | Tarrason L, Iversen T. 1998. Modelling intercontinental transport of atmospheric sulphur in the northern hemisphere[J]. Tellus B , 50 (4) : 331–352. DOI:10.1034/j.1600-0889.1998.t01-3-00002.x |
| [25] | Trudinger C, Enting I. 2005. Comparison of formalisms for attributing responsibility for climate change: Non-linearities in the Brazilian Proposal approach[J]. Climatic Change , 68 (1) : 67–99. |
| [26] | Wang X, Wang T, Pathak R K, et al. 2013. Size distributions of aerosol sulfates and nitrates in Beijing during the 2008 Olympic Games: Impacts of pollution control measures and regional transport[J]. Advances in Atmospheric Sciences , 30 (2) : 341–353. DOI:10.1007/s00376-012-2053-4 |
| [27] | Yang G P, Zhang S H, Zhang H H, et al. 2015. Distribution of biogenic sulfur in the Bohai Sea and northern Yellow Sea and its contribution to atmospheric sulfate aerosol in the late fall[J]. Marine Chemistry , 169 : 23–32. DOI:10.1016/j.marchem.2014.12.008 |
 2016, Vol. 36


