地下流体化学组分记录了流体的来源、运移及岩石圈的重要信息,通过对地下流体离子浓度及同位素组分的分析,可以判断其水质类型、成因、水循环深度以及水—岩反应程度等地球化学特征(杜建国等,2003),进而研究地下流体与地质构造之间的关系(苏鹤军等,2010)。水化学分析方法能够指示地下水的成因与补给过程,前人在地下水的成因、形成过程和水岩平衡作用(张炜斌等,2013;孙小龙等,2016)、地震前后的水化学变化特征(Woith et al, 2013;陈志等,2014)等方面开展了详细研究,认为该方法在判定地下水异常与地震孕育过程的构造活动以及地震的发生等关系中能够发挥重要作用。
在常用水化学分析方法中,图解法种类较多,如:反映水化学类型的Ternary图、Piper图等,反映水化学变化趋势的空间序列图、时间序列图、散点图以及Schoeller图等,反映地下水成因与补给过程的Gibbs图和Giggenbach图等(张磊等,2019),其中Na-K-Mg三角图常被用来评价水—岩平衡状态和区分不同类型的水样(Giggenbach,1988),目前一般采用“AQUACHEM水质数据分析软件”等绘制Na-K-Mg三角图。然而,由于尚未开发独立程序绘制该图件,在实际工作中往往需要结合其他数据进行联立分析,给数据分析工作带来不便。
Matlab拥有矩阵运算、算法实现、图形产出以及与其他编程语言相连接的功能,广泛应用于工程计算、控制设计、信号分析、图像处理等领域(何案华等,2019)。本文基于Matlab特性,以海南岛境内温泉(深井)数据分析为例,采用Matlab完成Na-K-Mg三角图绘制,以便利用Matlab平台与其他数据结合进行综合分析。
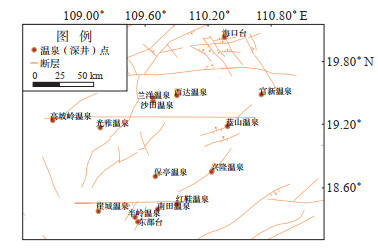
1 海南温泉(深井)资料选取海南岛陆温泉发育,沿区域构造断裂分布,多属构造地热温泉,分布广且出水温度高。选择昌江—琼海、九所—陵水等EW向断裂、文昌—琼海—三亚NE向断裂带以及琼北地热田附近的15个温泉(含2口深井),于2020—2021年进行水样采集,检测常规阴阳离子组分、氢氧稳定同位素和二氧化硅等组分的含量,开展温泉温度、水化学特征与地震关系的研究。取样点分布见图 1。

|
图 1 海南岛取样温泉点(深井)分布 Fig.1 Distribution diagram of sampling hot spring spots (deep wells) in Hainan Island |
根据水样检测单位要求对15个温泉(井)取样,进行水化学组分常量元素、SiO2和氢氧同位素测定。其中,在中国地震局地震预测重点实验室使用戴安ICS-900离子色谱仪,测试水样中K+、Na+、Mg2+、Ca2+和Li+阳离子组分,以及F-、Cl-、Br-、NO3-、SO42-、HCO3-和CO32-阴离子组分。在应急管理部国家自然灾害防治研究院进行SiO2和氢氧同位素测定,采用GBW04458、GBW04459、GBW04460校准,使用LGR 912-0008氢氧稳定同位素分析仪测定氢氧同位素。
2 水的平衡性分析Giggenbach(1988)基于Benjamin等(1983)的Na-K温标公式和Fournier等(1991)略作修改的K-Mg温标公式,提出以Na/1000、K/100和Mg为3个顶点绘制Na-K-Mg三角图,将地下水划分为完全平衡、部分平衡的地下热水和未成熟水(即处于岩石溶解、淋滤过程中的水)。具体公式如下:
完全平衡线方程为
| ${C_{{\rm{Na}}}} = 457 \times C_{\rm{K}}^{0.37} \times C_{{\rm{Mg}}}^{0.315} $ | (1) |
式中,CNa、CK、CMg分别表示为Na、K与Mg离子的质量浓度,单位为mg/L。
平衡下限方程为
| $ {C_{{\rm{Na}}}} = 100 \times C_{\rm{K}}^{0.37} \times C_{{\rm{Mg}}}^{0.315} $ | (2) |
K-Mg温标计算公式如下
| $ {L_{{\rm{km}}}} = \log C_K^2/{C_{{\rm{Mg}}}} = 14.0 - (4410/T) $ | (3) |
式中,T为热力学温度,单位K。
由式(1)—(3)可见,CNa和CMg均可转化为以CK的表示方式,若设定CK为1,即可实现Na、K、Mg三者的量化关系,则由式(3)可得
| $ C_{\rm{K}}^2/{C_{{\rm{Mg}}}} = {\mathop{\rm power}\nolimits} (10, 14.0 - (4410/T)) $ | (4) |
则有
| $ {C_{{\rm{Mg}}}} = \frac{{C_{\rm{K}}^2}}{{{\mathop{\rm power}\nolimits} (10, 14.0 - (4410/T))}} $ | (5) |
经过转换,由式(1)、式(5)即可绘出完全平衡线,由式(2)、式(5)即可绘出平衡下限线。Matlab实现过程如下:
%画外围大三角形
plot([0 1], [0 0], ’linewidth’, 2);
plot([0 0.5], [0 sind(60)], ’linewidth’, 2);
plot([0.5 1], [sind(60) 0], ’linewidth’, 2);
%画三角形里面的虚线
for x=0.1:0.1:0.9
plot([x 0.5+x*cosd(60)], [0, tand(60)*((1-x)/2)], ’--’, ’color’, [0.9 0.9 0.9]);
plot([x 0.5*x], [0, x*sind(60)], ’--’, ’color’, [0.9 0.9 0.9]);
plot([x/2 0.5+(1-x)/2], [x/2*tand(60) x/2*tand(60)], ’--’, ’color’, [0.9 0.9 0.9]);
end
%标注三解坐标
for x=0:0.1:1
text(x, -0.01, sprintf(‘%.1f’, x), ’HorizontalAlignment’, ’center’, ’fontsize’, 10, ’fontweight’, ’bold’);
text(0.5, -0.05, ’$\sqrt{Mg}$’, ’HorizontalAlignment’, ’center’, ’fontsize’, 15, ’fontweight’, ’bold’, ’Interpreter’, ’latex’);
text(1-x*cosd(60)+0.015, x*sind(60), sprintf(‘%.1f’, x), ’Rotation’, -60, ’HorizontalAlignment’, ’center’, ’fontsize’, 10, ’fontweight’, ’bold’);
text(0.76, 0.5*sind(60)+0.09, ’Na/1000’, ’Rotation’, -60, ’HorizontalAlignment’, ’center’, ’fontsize’, 15, ’fontweight’, ’bold’);
text(x*cosd(60)-0.015, x*sind(60), sprintf(‘%.1f’, 1-x), ’Rotation’, 60, ’HorizontalAlignment’, ’center’, ’fontsize’, 10, ’fontweight’, ’bold’);
text(0.24, 0.5*sind(60)+0.09, ’K/100’, ’Rotation’, 60, ’HorizontalAlignment’, ’center’, ’fontsize’, 15, ’fontweight’, ’bold’);
end
%平衡上限
t=80:20:360;
Lkm=14.0-4410./(t+273.15);
K2_Mg=power(10, Lkm);
K=ones(1, length(t));
Mg=K./K2_Mg;
Na=457.*power(K, 0.37).*power(Mg, 0.315);
S=Na./1000+K./100+sqrt(Mg);
Na_concentration=Na./1000./S;
K_concentration=K./100./S;
Mg_concentration=sqrt(Mg)./S;
y1=Na_concentration*sind(60);
x1=Mg_concentration+y1/tand(60);
plot(x1, y1, ’o-’, ’linewidth’, 2, ’markerfacecolor’, [0.7 0.7 0.7], ’markeredgecolor’, [0.7 0.7 0.7], ’MarkerSize’, 5, ’color’, [0.7 0.7 0.7]);
%平衡下限
Na=100.*power(K, 0.37).*power(Mg, 0.315);
S=Na./1000+K./100+sqrt(Mg);
Na_concentration=Na./1000./S;
K_concentration=K./100./S;
Mg_concentration=sqrt(Mg)./S;
y2=Na_concentration*sind(60);
x2=Mg_concentration+y2/tand(60);
plot(x2, y2, ’^-’, ’linewidth’, 2, ’markerfacecolor’, [0.7 0.7 0.7], ’markeredgecolor’, [0.7 0.7 0.7], ’MarkerSize’, 5, ’color’, [0.7 0.7 0.7]);
%标注温度值
for i=1:length(x1)
plot([x1(i) x2(i)], [y1(i) y2(i)], ’--’, ’color’, [0.7 0.7 0.7]);
text(x1(i), y1(i)+0.02, [sprintf(‘%.0f’, t(i)) ‘\circ’], ’HorizontalAlignment’, ’center’, ’color’, [0.4 0.4 0.4]);
end
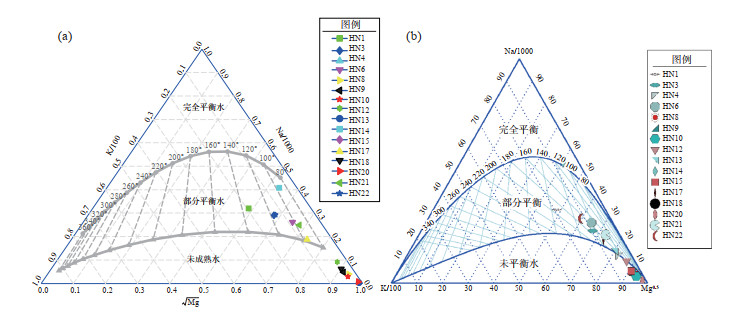
基于上述代码即可绘制Na-K-Mg三角图,并可通过完全平衡线、平衡下限划分为完全平衡水、部分平衡水和未成熟水3个区,并将采集样品数据叠加绘制在该三角图上,即清晰可见样品分布情况。
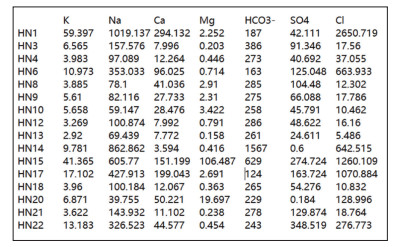
水样数据文件按图 2格式进行存储,包含一行标题,其中第1列表示台站编号或台站名称,第2—8列依次为K、Na、Ca、Mg、HCO3、SO4和Cl。Matlab实现过程如下:

|
图 2 水样文件存储格式 Fig.2 The storage format of a water sample file |
[codes K Na Ca Mg HCO3 SO4 Cl]=textread(‘water_sample.txt’, ’%s %f %f %f %f %f %f %f’, ’headerlines’, 1); %要有文字数据标题%
S=Na./1000+K./100+sqrt(Mg);
Na_concentration=Na./1000./S;
K_concentration=K./100./S;
Mg_concentration=sqrt(Mg)./S;
y3=Na_concentration*sind(60);
x3=Mg_concentration+y3/tand(60);
markers = [‘o’, ’s’, ’d’, ’^’, ’v’, ’>’, ’<’, ’p’, ’h’];
colors=[‘r’ ‘g’ ‘b’ ‘c’ ‘m’ ‘y’ ‘k’]; %plot所包含的所有颜色
h=[];
for i=1:length(x3)
h(i)=plot(x3(i), y3(i), ’marker’, markers(rem(i, length(markers))+1), ’markerfacecolor’, colors(rem(i, length(colors))+1), ’markeredgecolor’, colors(rem(i, length(colors))+1), ’MarkerSize’, 12, ’HitTest’, ’off’);
end
legend(h, codes);
程序可自动分配各水样的标识,最终输出产品,与利用苏鹤军等(2010)所研发Matlab和GMT结合方法绘制的Na-K-Mg三角图进行对比,结果见图 3,可见二者所得结果相同。

|
图 3 海南水样的Na-K-Mg三角图 (a)Matlab绘制图件(单位:mg/L);(b) 据苏鹤军等(2010)研发方法绘制图件(单位:mg/L) Fig.3 Na-K-Mg triangular diagram of the water samples in Hainan |
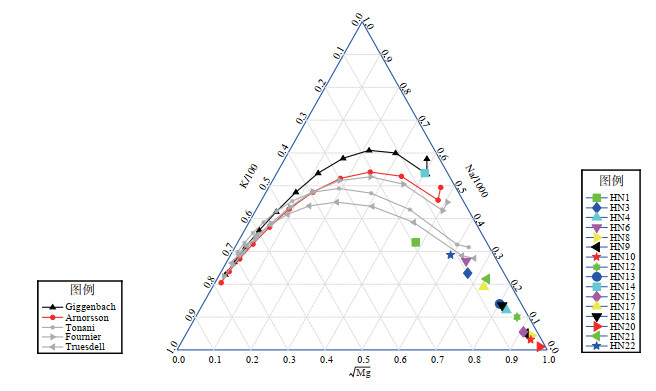
王欣等(2019)认为,Na-K-Mg三角图中“完全平衡曲线”具有不确定性,因选用的Na-K温标公式、K-Mg温标公式以及与热水相接触的矿物类型不同而不同。在利用阳离子温标计算热储温度时,应首先利用Na-K-Mg三角图判断其基于何种“完全平衡曲线”平衡,处于平衡状态即可利用该曲线对应的温标公式计算热储温度,且应选择该点靠近“完全平衡曲线”对应的温标公式计算更为合理。据此,在Na-K-Mg三角图中绘出不同Na-K温标曲线,根据三角图中台站数据位置来选择Na-K温标公式,进而计算台站热储温度。Matlab实现过程如下:
%K-Mg温标公式
t=75:25:350;
K=ones(1, length(t)); %由于最终转化成Mg与K、以及Na与K的关系,因些可假定K为一固定值进行参考
x1=7.35-2300./(t+273.15);
x2=4.03-1077./(t+273.15);
index1=find(x1>1.25);
index2=find(x2<1.25);
x=[x2(index2) x1(index1)];
K_sqrt_Mg=power(10, x);
sqrt_Mg=K./K_sqrt_Mg; %计算出Mg的开方相对于K的含量
% Giggenbach (1988) Na-K温标公式
Na_K=power(10, 1390./(t+273.15)-1.75);
Gi_Na=K.*Na_K;
% Arnorsson (1983) Na-K温标公式
if(t<250)
Na_K=power(10, 993./(t+273.15)-0.933);
else
Na_K=power(10, 1319./(t+273.15)-1.699);
end
Ar_Na=K.*Na_K;
% Tonani(1980) Na-K温标公式
Na_K=power(10, 883./(t+273.15)-0.78);
T0_Na=K.*Na_K;
% Fournier(1979) Na-K温标公式
Na_K=power(10, 1217./(t+273.15)-1.483);
Fo_Na=K.*Na_K;
% Truesdell(1976) Na-K温标公式
Na_K=power(10, 885.6./(t+273.15)-0.8573);
Tr_Na=K.*Na_K;
%分别计算上述公式中Na K Mg相对含量
S=Gi_Na./1000+K./100+sqrt_Mg;
Gi_Na_concentration=Gi_Na./1000./S;
Gi_K_concentration=K./100./S;
Gi_Mg_concentration=sqrt_Mg./S;
S=Ar_Na./1000+K./100+sqrt_Mg;
Ar_Na_concentration=Ar_Na./1000./S;
Ar_K_concentration=K./100./S;
Ar_Mg_concentration=sqrt_Mg./S;
S=T0_Na./1000+K./100+sqrt_Mg;
T0_Na_concentration=T0_Na./1000./S;
T0_K_concentration=K./100./S;
T0_Mg_concentration=sqrt_Mg./S;
S=Fo_Na./1000+K./100+sqrt_Mg;
Fo_Na_concentration=Fo_Na./1000./S;
Fo_K_concentration=K./100./S;
Fo_Mg_concentration=sqrt_Mg./S;
S=Tr_Na./1000+K./100+sqrt_Mg;
Tr_Na_concentration=Tr_Na./1000./S;
Tr_K_concentration=K./100./S;
Tr_Mg_concentration=sqrt_Mg./S;
%将上述不同公式分别用不同颜色画出
y=Gi_Na_concentration*sind(60);
x=Gi_Mg_concentration+y/tand(60);
h1=plot(x, y, ’^-’, ’linewidth’, 2, ’markerfacecolor’, [0 0 0], ’markeredgecolor’, [0 0 0], ’MarkerSize’, 7, ’color’, [0 0 0]);
y=Ar_Na_concentration*sind(60);
x=Ar_Mg_concentration+y/tand(60);
h2=plot(x, y, ’or-’, ’linewidth’, 2, ’markerfacecolor’, ’r’, ’markeredgecolor’, ’r’, ’MarkerSize’, 7);
y=T0_Na_concentration*sind(60);
x=T0_Mg_concentration+y/tand(60);
h3=plot(x, y, ’*-’, ’linewidth’, 2, ’markerfacecolor’, [0.7 0.7 0.7], ’markeredgecolor’, [0.7 0.7 0.7], ’MarkerSize’, 7, ’color’, [0.7 0.7 0.7]);
y=Fo_Na_concentration*sind(60);
x=Fo_Mg_concentration+y/tand(60);
h4=plot(x, y, ’>-’, ’linewidth’, 2, ’markerfacecolor’, [0.7 0.7 0.7], ’markeredgecolor’, [0.7 0.7 0.7], ’MarkerSize’, 7, ’color’, [0.7 0.7 0.7]);
y=Tr_Na_concentration*sind(60);
x=Tr_Mg_concentration+y/tand(60);
h5=plot(x, y, ’<-’, ’linewidth’, 2, ’markerfacecolor’, [0.7 0.7 0.7], ’markeredgecolor’, [0.7 0.7 0.7], ’MarkerSize’, 7, ’color’, [0.7 0.7 0.7]);
h=[h1 h2 h3 h4 h5];
legend(h, {‘Giggenbach’, ’Arnorsson’, ’Tonani’, ’Fournier’, ’Truesdell’}, ’location’, ’west’);
基于以上代码,将海南岛温泉水样数据在三角图中进行叠加绘制,得到图 4。

|
图 4 海南水样的三角图(不同Na-K温标公式) Fig.4 The triangular diagram of the water samples in Hainan (different Na-K temperature scale formulas) |
由图 4可知,仅编号为HN14的水样可利用阳离子温标进行热储温度计算。据王欣等(2019)的观点,按Giggenbach(1988)的Na-K温标即可计算热储温度,公式如下
| $ T = \frac{{1390}}{{\lg \left({{C_{{\rm{Na}}}}/{C_{\rm{K}}}} \right) + 1.75}} - 273.15 $ | (6) |
代入数据,可得
| $ T = \frac{{1390}}{{\lg (862.862/9.781) + 1.75}} - 273.15 = {102.97^\circ }{\rm{C}} $ | (7) |
本研究应用Matlab编程实现Na-K-Mg三角图的绘制,并应用海南温泉(深井)水样进行实例分析,得出以下认识:
(1)采用Matlab程序绘制Na-K-Mg三角图,图件界面简单、标识清晰,与已有方法的产品输出结果一致,且可实现多个点位的同步绘制,可利用Matlab源代码便捷地与其他数据展开综合分析和制图。
(2)文中所用海南温泉(深井)水样阴、阳离子分析误差(δ)小于5%,数据可靠性较高。其中HN14、HN15和HN20为井水,其他为温泉水。通过对化学组分、氢氧稳定同位素等的分析,采用Matlab程序绘制Na-K-Mg三角图,显示海南温泉水样均为部分成熟水和未成熟水,与张颖(2019)的结论一致:海南岛陆地区温泉均为大气降水经地表入渗后,受到大地热流的加热,沿断裂带上涌到地表,在上涌过程中受到浅层冷水混入而形成。
另外,HN15和HN20为全井下套管的混合裂隙井水,是未经深部循环的水,与地表水相连,属于未成熟水;HN14为一口深度706 m的深井,位于琼北断陷盆地,主要监测第7含水层的变化,该井为全井下套管,密封性好,符合完全平衡水的储存条件。
综上所述,基于Matlab编程绘制Na-K-Mg三角图,可信性、实用性较高,方便快捷、简单易懂。
陈志, 杜建国, 周晓成, 等. 2012年6月30日新源MS 6.6地震前后北天山泥火山及温泉的水化学变化[J]. 地震, 2014, 34(3): 97-107. |
杜建国, 刘丛强. 同位素地球化学在地震研究方面的作用[J]. 地震, 2003, 23(2): 99-107. DOI:10.3969/j.issn.1000-3274.2003.02.012 |
何案华, 王言章. Matlab在地下流体数据分析中的基础应用[J]. 大地测量与地球动力学, 2019, 39(9): 966-970. DOI:10.14075/j.jgg.2019.09.018 |
苏鹤军, 张慧, 史杰. 祁连山断裂带中东段地下水地球化学特征研究[J]. 西北地震学报, 2010, 32(2): 122-128. |
孙小龙, 王广才, 邵志刚, 等. 海原断裂带土壤气与地下水地球化学特征研究[J]. 地学前缘, 2016, 23(3): 140-150. |
王欣, 漆继红, 许模, 等. Na-K-Mg三角图修正与Na-K温标选取[J]. 煤田地质与勘探, 2019, 47(2): 121-128. |
张磊, 刘耀炜, 任宏微, 等. 水化学分析方法在地下水异常核实中的应用[J]. 地震, 2019, 39(1): 29-38. |
张炜斌, 杜建国, 周晓成, 等. 首都圈西部盆岭构造区地热水水文地球化学研究[J]. 矿物岩石地球化学通报, 2013, 32(4): 489-496. |
张颖. 海南岛温泉特征及成因研究[D]. 北京: 中国地质大学(北京), 2019.
|
Benjamin T, Charles R, Vidale R. Thermodynamic parameters and experimental data for the Na-K-Ca-geothermometer[J]. J Volcanol Geoth Res, 1983, 15(1/3): 167-186. |
Fournier R O, SoreyM L, Mariner R H, et al. Chemical and isotopic prediction of aquifer temperatures in the geothermalsystem at Long Valley, California[J]. Journal of Volcanology and Geothermal Research, 1979, 5(1/2): 17-34. |
Fournier R O, PANG Zhonghe. Geothermometer: Analysis of Na-K-Mg relationship in geothermal water[J]. Foreign Geology (Beijing), 1991(5): 34-37. |
Giggenbach W F. Geothermal solute equilibria.Derivation of Na-K-Mg-Ca geoindicators[J]. Geochimica et Cosmochimica Acta, 1988, 52(12): 2749-2765. |
Woith H, Wang R J, Maiwald U, et al. On the origin of geochemical anomalies in groundwaters induced by the Adana 1998 earthquake[J]. Chemical Geology, 2013, 339: 177-186. |
 2022, Vol. 43

