 2017, Vol. 32

2. 中国科学院计算地球动力学重点实验室, 中国科学院大学, 北京 100049
3. 中国地质科学院, 北京 100037
 , HU Dao-gong1 , ZHANG Huai2 , FAN Tao-yuan1 , ZHANG Yao-ling1 , LI Bing1,3 , SHI Yao-lin2
2. Key Laboratory of Computational Geodynamics, Chinese Academy of Sciences, Beijing 100049, China
3. Chinese Academy of Geological Sciences, Beijing 100037, China
约50 Ma以来,印度板块和欧亚大陆板块的持续碰撞挤压造就了世界上最高的高原——青藏高原(Yin and Harrison, 2000).青藏高原的隆升和扩展不仅导致亚洲大陆内部发生强烈构造变形,同时对周边的地貌格局和环境变化也产生了重大影响.青藏高原东北缘主要是指东昆仑山断裂带以北的柴达木盆地,祁连山地区以及西秦岭以北至河西走廊之间的部分.该区域地处青藏地块、塔里木盆地、阿拉善—鄂尔多斯地块和四川盆地的交汇地带,构造变形及地震地质灾害均非常强烈,是青藏高原隆升后向周缘扩展的前缘位置(图 1)(Yuan et al., 2013).因此,对该区岩石圈结构和变形的研究有助于理解青藏高原的横向扩展方式和动力学变形机制.

|
图 1 青藏高原东北缘构造地质背景 彩色方块代表不同地点的热流值,白色箭头代表相对于稳定的欧亚大陆板块GPS观测的地表运动速度值(Gan et al., 2007),黄色圆点代表 1976—2011年间MW≥5.0地震的震中分布(数据来自哈佛地震目录),红色实线代表活动断裂分布(Deng et al., 2003). Figure 1 Tectonic setting of the northeastern Tibetan plateau Squares indicate the heat flow values at different sites. White arrows represent the GPS velocity relative to the Eurasian plate (Gan et al., 2007). Yellow dots indicate the epicenters of the earthquakes (MW≥5.0) based on the Harvard CMT catalogue (1976—2010). Red lines represent active faults (Deng et al., 2003). |
黏性模型认为青藏高原整体演化特征是由南向北逐级隆升和扩展的(England and McKenzie, 1982; England and Houseman, 1986; Houseman and England, 1986).同时,随着印度板块的不断向北推移,受到挤压的亚洲岩石圈地幔可能发生了南向俯冲(Tapponnier et al., 1990; Willett and Beaumont, 1994; Gao et al., 1999; Tapponnier et al., 2001; Zhao et al., 2010).而青藏高原东北缘可能是亚洲岩石圈地幔的俯冲下插地带.因此近年来,国内外学者从地表地质到深部构造对该区进行了深入观测和研究.
地表构造方面,从柴达木盆地北缘到阿拉善地块南缘发育了一系列逆冲断裂带,在祁连山地区形成了明显的盆山地貌格局,从祁连山经海原断裂到西秦岭,断裂带性质由逆冲性质逐渐转变为走滑性质(Zheng et al., 2013c).年代学数据表明,青藏高原东北缘祁连山西侧的主要山体起始隆升时间由中间向南北两侧逐渐变新,特别是在河西走廊以北的阿拉善地块南部发现了最年轻的活动构造(Zheng et al., 2013a, b),表明青藏高原东北缘目前仍在不断的增生扩展,而浅部地壳的缩短变形甚至扩展到了阿拉善地块南部.
深部结构方面,柴达木盆地的地壳厚度约45 km,在祁连山中部地壳厚度增厚至60 km左右,而在阿拉善地块南部地壳厚度又减薄至45~50 km (图 2)(Liu et al., 2006; 孙玉军等,2013;Tian and Zhang, 2013; Zhang et al., 2013;Tian et al., 2014).从阿拉善—鄂尔多斯地块到青藏高原东北缘祁连山地区地壳逐渐增厚,在部分特殊地段,如西秦岭和海原断裂带中段,深部地球物理剖面显示Moho面深度发生陡变(Ye et al., 2015).同时,地球物理剖面显示从阿拉善—鄂尔多斯地块到祁连山地区,岩石圈和软流圈界面(LAB)也逐渐增厚(Feng et al., 2014; Shen et al., 2015; Ye et al., 2015),可能暗示着亚洲岩石圈地幔南向俯冲到祁连山地块之下,但是目前有限的深部地球物理数据也显示亚洲岩石圈地幔的下插深度和下插前缘非常有限(Shen et al., 2015).由于祁连山地块的隆升时代较新(张培震等; 2006; Zheng et al., 2006),另一种解释为该区的亚洲岩石圈地幔可能正在发生俯冲,即处于发生俯冲下插的初期状态(Tapponnier et al., 2001).大尺度的深部地球物理层析成像结果表明,在青藏高原东北缘岩石圈地幔呈现低速异常,可能意味着亚洲岩石圈地幔并未发生俯冲(Liang et al., 2012; 赵文津等, 2014;Liang et al., 2016).从地震目录来看,青藏高原东北缘也并不存在明显的俯冲地震带(图 2).因此从目前获得的深部结构来看,在青藏高原东北缘亚洲岩石圈地幔是否发生俯冲或俯冲下插的程度还存在很大的争议(Jiménez-Munt et al., 2008).

|
图 2 A-A′,B-B′剖面上的地形、地震分布、地表热流及岩石圈结构特征 灰色区域代表距离剖面线60 km范围内的地形最大和最小高度范围,蓝色实线代表该范围内的地形海拔平均值.绿色方块代表该范围内的地表热流值.黑色圆点代表 3级以上地震目录分布(1970—2006年)(Engdahl et al, 1998; Wei et al, 2012).蓝色虚线代表Moho面(数据来自Crust1.0模型).黑色虚线代表软流圈和岩石圈界面(LAB)(Shen et al, 2015). Figure 2 The distribution of elevation variation, earthquakes, surface heat flow and lithospheric structure along the AA' and BB' profiles The gray areas in the profiles are limited by the maximum and minimum elevations within a 60 km wide swath along the profiles. Solid blue lines represent the average elevations along the profiles. Green squares indicate the surface heat flow values along the profiles. Black dots indicate the distribution of relocated earthquakes (M≥3.0) along the two profiles during 1970—2006)(Engdahl et al, 1998; Wei et al, 2012).Dash blue lines indicate the Moho surface based on the Crust1.0 model.Black Dashed lines represent the LAB(lithosphere-asthenosphere boundary) (Shen et al, 2015). |
青藏高原在横向扩展过程中,多种因素都有可能对岩石圈形变方式产生影响.那么,青藏高原东北缘岩石圈有哪些可能的动力学变形方式?本文围绕这一问题,结合地表地形、岩石圈结构和地表热流观测,利用数值模拟的方法,通过建立合理的有限元模型重点探讨岩石圈流变强度差异对青藏高原东北缘岩石圈变形特征的影响.在此基础上,重点探讨亚洲大陆岩石圈地幔发生俯冲和不发生俯冲与地壳变形特征及岩石圈热状态的关系,从而为青藏高原东北缘的岩石圈变形模式提供参考.
1 青藏高原东北缘地表和深部形变特征青藏高原东北缘地处青藏地块、塔里木盆地、阿拉善—鄂尔多斯地块和四川盆地的交接带,GPS观测显示,相对于稳定的西伯利亚地块,在东昆仑断裂带南部地表运动速度为15~20 mm/a,而跨越柴达木盆地,在祁连山地区的GPS运动速度逐渐减小到5 mm/a左右,在祁连山地区的逆冲断裂带上应变分配相对均匀,GPS速度大小由南西向北东大致呈线性降低趋势,但从跨越海原断裂带的速度剖面来看,海原断裂带的应变率分配相对较高(Zhang et al., 2004; Cui et al., 2009; 郑文俊等, 2009;葛伟鹏等, 2013).从平面上看,在祁连山西段GPS速度方向与逆冲断裂带近似垂直,地壳以缩短增厚变形为主,而祁连山东段至西秦岭地区,GPS速度方向与活动断裂走向有一定夹角,断裂以走滑活动为主,这表明青藏高原东北缘地壳在受到强烈挤压缩短变形后向东偏转迁移(崔笃信等, 2009; 王琼等, 2013).
地表热流显示(图 1和图 2),从柴达木—祁连山西段—阿拉善和祁连山东段—鄂尔多斯的两个剖面来看,地表热流大多数在30~100 mW·m-2(胡圣标等, 2001), 但在祁连山中部缺少相应的观测数据.最新的地表热流观测显示在共和盆地有两个热流高值区,热流值达到约150 mW·m-2,这可能与局部的深部构造相关(姜光政等, 2016).从地震分布来看(图 1和图 2),整个祁连山地区地震活动性非常强烈,特别是沿着海原断裂带和祁连山北缘—河西走廊一带,曾经发生了一系列5级以上地震,而在阿拉善地块和鄂尔多斯地块内部则相对较少,跨越祁连山地区的地震分布剖面并未显示出亚洲岩石圈地幔的俯冲特征.
国内外学者对该地区的地壳和岩石圈结构开展了丰富的地球物理研究,但由于探测分辨率和众多影响因素使得对结果有多种解释.就地壳结构来看,祁连山地块的地壳厚度达到60 km左右,而柴达木盆地和阿拉善—鄂尔多斯地块的地壳厚度在40~45 km (Tian et al., 2014),但仅从地壳结构特征很难准确得出深部岩石圈地幔的变形特征.从地球物理方法得到的LAB(岩石圈-软流圈界面)来看,不同研究结果相差巨大(图 2).最新的研究结果显示从阿拉善—鄂尔多斯地块到柴达木—祁连山地块,LAB(岩石圈-软流圈界面)都由100 km逐渐增厚至150 km左右,这暗示着伴随着青藏高原向北的扩展,与其相邻的亚洲岩石圈地幔可能发生了南向俯冲(Shen et al., 2015; Ye et al., 2015).但是深部结果存在一定的不确定性,同时从发生俯冲的形态来看,亚洲岩石圈地幔南向俯冲距离非常有限.
2 数值模型 2.1 数值方法本研究采用黏塑性的本构关系对岩石圈形变进行研究.采用有限元的数值方法对以下方程进行求解.
平衡方程(动量守恒方程)为

|
(1) |
不可压缩条件为

|
(2) |
其中P是压力;vj是速度矢量;ηeff是等效黏滞性系数;ρ=ρ0[1-α(T-T0)][1+β(P-P0)],为温度T和压力P条件下的物质密度,ρ0是在温度T0=298 K、压力P0=0.1 MPa情况下的参考密度,α和β分别为热膨胀系数和压缩系数,本研究中分别取α=3×10⁻⁵ K-1,β=1.0×10⁻⁵ MPa-1. gj=[0, g]T为重力加速度.
黏塑性本构关系为
|
(3) |
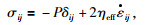
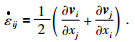
σij为应力张量(本研究中遵循弹性力学的定义,拉伸为正,压缩为负),δij是Kronecker delta函数.其中应变率张量
|
(4) |
本研究中采用Mises屈服准则来判断变形是否进入屈服状态(Fullsack, 1995; Stockmal et al., 2007),公式为

|
(5) |
其中J2= 
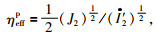
黏滞性系数在数值计算中是一个关键性参数,其与物质属性、温度和应变率是相关的.本研究中主要考虑不同块体岩石圈在碰撞初期的演化特征,在该过程中温度变化对黏滞性系数的影响不大,因此未考虑温度变化对黏滞性的影响.但当发生塑性形变时,黏滞性系数与应变率相关,对于没有进入塑性屈服状态的变形,黏滞性系数ηeff不发生变化,当满足塑性屈服状态,等效黏滞性系数ηeffp为
|
(6) |
其中
温度场计算采用热对流-扩散方程(能量守恒方程),公式为

|
(7) |
其中T为温度;ρ和c分别为密度和热容;k为热传导系数;v为速度矢量,通过方程(1)和(2)求解得到.Q为生热率,本研究中考虑了两部分生热率Q=Qr+σij
总结前人的研究成果,本研究基于黏塑性的本构关系,采用ALE有限元方法(Arbitrary Lagrangian-Eulerian Description, 任意朗格朗日-欧拉描述)和MIC方法(Marker-In-Cell, 网格粒子)相结合的数值求解技术,完成了二维模型计算程序.与前人一般采用拉格朗日和欧拉两套网格相结合的处理方法不同(Fullsack, 1995;Beaumont et al., 2001),本研究采用拉格朗日网格追踪研究区域的边界,研究区域内的物质位置通过粒子追踪来确定,并且逐步更新调整网格,保证计算精度.通过与前人的研究方法和模型进行对比(Gerya and Yuen, 2003; Buiter et al., 2006),验证了数值方法的可靠性和边界追踪的有效性.
2.2 有限元模型及边界条件根据该地区的深部地球物理研究结果,给定如下图所示的数值模型.模型的长度为1400 km,深度为300 km,不同颜色代表不同的材料参数.至上而下分为上地壳、下地壳、岩石圈地幔和软流圈,模型左右两部分分别代表青藏高原和欧亚大陆板块.根据现今地球物理的结果,阿拉善地块和鄂尔多斯地块地壳厚度约为40 km (Wang et al., 2003; Wang and Huangfu, 2004; Li and van der Hilst, 2010; Yao et al., 2010;Lei et al., 2014).因此,本研究中给定青藏高原和邻近地块的初始地壳厚度均为40 km,初始岩石圈厚度均为100 km.以此基本模型来模拟青藏高原在扩展过程中遇到稳定地块后岩石圈的形变过程.
模型的力学边界条件为:上边界为完全自由边界,下边界垂向速度为0,水平方向自由,即滑动边界条件.根据GPS观测,青藏高原东北缘相对于稳定的周缘地块运动速度约为20 mm/a,因此,模型的左边界给定20 mm/a水平速度边界条件,右边界为滑动边界条件,即水平速度固定,垂向速度自由.模型的热边界条件为:上边界和下边界分别给定固定温度0 ℃和1420 ℃,其中从0到100 km,温度从0 ℃线性增加到1300 ℃,从100 km到300 km线性增加到1420 ℃,左右两边界为绝热边界条件.有限元数值模型包含的节点数和单元数分别为12871和12600,每个单元网格的尺寸大概为7 km×5 km,模型中粒子数为144000,大概每个单元网格中有12个粒子,保证了计算精度.
2.3 计算参数本研究依据地球物理观测结果所反映的各个地块的岩石圈特征,以及根据热结构和相关流变参数得到的岩石圈强度和黏滞性系数给定计算参数(Sun et al., 2013a, b).总体上来看,柴达木盆地、阿拉善地块和鄂尔多斯地块的地壳呈低速异常,黏滞性系数和流变强度都相对较高;而祁连山地块、松潘—甘孜地块和西秦岭北缘的地壳呈高速异常,黏滞性系数和流变强度相对较低.对于岩石圈地幔,大致特征与地壳类似,但阿拉善地块与祁连山都呈现低速异常,黏滞性系数和流变强度均较低(Huang and Zhao, 2006; Wei et al., 2012).
通过以上分析可以看出,在青藏高原东北缘跨越过渡带流变结构也存在一定差异,大致可以分为两种类型,一种为跨越柴达木—祁连山—阿拉善,该剖面主要表现为强度高、变形弱的柴达木地块和阿拉善地块夹持着强度低、易变形的祁连山地块;另一种为松潘甘孜地块—西秦岭北缘—鄂尔多斯,该剖面的主要特征表现为由强度低、易变形的松潘甘孜—西秦岭逐渐过渡到强度大、不易变形的鄂尔多斯地块.因此,为了便于分析不同流变特征对岩石圈变形的影响,我们构建了两种模型case 1和case 2,在这两种模型的基础上再对相关问题进行讨论.
(1) case 1模型代表强度较高的青藏高原和强度较低的周缘地块的碰撞,类似于稳定的柴达木地块与祁连山地块的碰撞.模型中青藏高原的地壳黏滞性高,不发生塑性变形,岩石圈地幔易发生塑性变形;周缘地块黏滞性较高,发生塑性变形,岩石圈地幔黏滞性较低,不发生塑性变形.鉴于岩石圈地幔的复杂性,我们增加了case 1S模型,其地壳的计算参数不变,青藏高原岩石圈地幔低黏滞性,不发生塑性变形,而周缘地块岩石圈地幔高黏滞性,发生塑性变形.
(2) case 2模型代表强度较低的青藏高原和强度较高的周缘地块的碰撞,类似于松潘—甘孜地块或祁连山地块与稳定的鄂尔多斯—阿拉善地块的碰撞.模型中青藏高原地壳容易发生塑性变形,而岩石圈地幔黏滞性低,不发生塑性变形;周缘地块地壳高黏滞性,发生塑性变形,岩石圈地幔高黏滞性,不发生塑性变形.为了进一步考虑高强度的周缘地块岩石圈地幔的变形特征,我们增加了case 2S1模型,给定青藏高原地壳高黏滞性,不发生塑性变形,岩石圈地幔低黏滞性;周缘地块地壳高黏滞性,发生塑性变形,岩石圈地幔高黏滞性,不发生塑性变形.
四个模型的边界条件均为图 3所示,各个模型计算时间为15 Ma,主要分析碰撞初期岩石圈的变形特征.

|
图 3 有限元数值模型及边界条件 1-青藏高原上地壳;2-周缘地块上地壳;3-青藏高原下地壳;4-周缘地块下地壳;5-青藏高原岩石圈地幔;6-周缘地块岩石圈地幔;7-软流圈. Figure 3 Finite element model and boundary condition 1-Upper crust for the Tibetan plateau; 2-Upper crust for the bounding block; 3-Lower crust for the Tibetan plateau; 4-Lower crust for the bounding block; 5-Mantle lithosphere for the Tibetan plateau; 6-Mantle lithosphere for the bounding block; 7-Asthenosphere. |
模型case 1结果显示(图 4),随着青藏高原不断挤压扩展,强度较高的青藏高原地壳几乎不变形,而易于发生塑性变形的周缘地块地壳则发生明显增厚,特别是在块体的碰撞边界.周缘地块的上地壳发生明显增厚,下地壳在受到强烈的挤压作用下发生弯曲下插,同时在增厚地壳的垂向载荷作用下,周缘地块的岩石圈地幔发生弯曲下插,岩石圈和软流圈界面(LAB)深度在块体的碰撞边界达到最大,而随着远离碰撞边界,其深度逐渐变浅.从计算得到的热状态来看,未发生明显变形的青藏高原地温梯度几乎没有发生变化,而处于碰撞边界的周缘地块岩石圈由于发生明显增厚,地温梯度减小,在相同深度温度降低.计算得到的地表热流显示,未发生变形的区域地表热流基本维持在55 mW·m-2,而在块体碰撞边界,地壳增厚区域地表热流降低到45 mW·m-2,计算结果与跨越柴达木—祁连山—阿拉善剖面的地表热流观测平均值基本一致(图 2中AA′剖面),但是在祁连山地区由于缺乏足够的地表热流观测,很难从热结构上对岩石圈变形状态进行约束.

|
图 4 case 1模型中岩石圈变形演化结果 白色实线代表等温线,红色实线代表地表热流,绿色方块代表地表热流观测值(图 1中AA′剖面),其投影位置相对于块体的边界. Figure 4 Lithospheric deformation (materials, temperature and surface heat flow) for case 1 White lines represents isotherm (℃). Red lines indicate the surface heat flow. Green squares indicate the observed heat flow values along the profile AA′. In this projection, the position of the observed surface heat flow is relative to the plate boundary. |
从应变率结果看(图 5),强度高不发生塑性变形的青藏高原地壳处于低应变率,而在碰撞边界发生明显增厚的周缘地块地壳处于高应变率区域,对应的地表发生明显隆升(图 5a).从地壳应变率的演化来看,随着持续的挤压碰撞,高应变率区域在不断的向周缘扩展,对应的地表隆升也在不断向周缘扩展.对于岩石圈地幔,块体的碰撞边界发生了明显的变形,高应变率从地壳延伸至深部岩石圈地幔,该模型中青藏高原的岩石圈地幔给定较低的塑性屈服强度,因此其岩石圈地幔在靠近周缘地块的边界处应变率也相对较高,而周缘地块岩石圈地幔由于给定较低的黏滞性系数,未发生明显的塑性变形,应变率较低.

|
图 5 case 1模型中地表地形和岩石圈应变率分布演化 (a)地表地形演化图;(b)-(d)应变率分布图,虚线代表上、下地壳、岩石圈地幔和块体之间的大致边界. Figure 5 Elevation (a) and strain rate(b)-(d)vary with time for case 1 Dashed lines show the general boundaries of different parts and layers. |
根据地球物理观测,部分学者指出柴达木地块的下地壳和岩石圈地幔可能存在低速层,暗示着其下地壳和岩石圈地幔黏滞性可能更低(Karplus et al., 2011).因此,在模型case 1S中,我们将青藏高原的岩石圈地幔给定较低黏滞性,周缘地块岩石圈地幔黏滞性较高,但是塑性屈服强度较低(表 1).模型case 1S的结果显示,青藏高原的地壳和岩石圈地幔变形不明显,应变率较低(图 6和图 7).屈服强度较低的周缘地块地壳和岩石圈地幔均发生了明显增厚,岩石圈和软流圈界面(LAB)深度在块体的碰撞边界达到最大,而随着远离碰撞边界,其深度逐渐变浅(图 6).周缘地块靠近块体碰撞边界的应变率也较高,高应变率对应的地表地形有明显隆升(图 7).整体上看,该结果与模型case 1大致类似,周缘地块的岩石圈地幔发生了下插俯冲.
|
|
表 1 各个模型的计算参数 Table 1 Material parameters for different cases |

|
图 6 case 1S模型中岩石圈变形及地表热流演化结果 白色实线代表等温线,红色实线代表地表热流,绿色方块代表地表热流观测值(图 1中AA′剖面),其投影位置相对于块体边界. Figure 6 Lithospheric deformation (materials, temperature and surface heat flow) for case 1S White lines represents isotherm (℃). Red lines indicate the surface heat flow. Green squares indicate the observed heat flow values along the profile AA′ (Fig. 1). In this projection, the position of the observed surface heat flow is relative to the plate boundary. |

|
图 7 case 1S模型中地表地形和岩石圈应变率分布演化 (a)地表地形演化图;(b)-(d)应变率分布图,虚线代表上、下地壳、岩石圈地幔和块体之间的大致边界. Figure 7 Elevation (a) and strain rate (b)-(d)vary with time for case 1S Dashed lines show the general boundaries of different parts and layers. |
由以上两个模型可以看出,如果周缘地块即亚洲岩石圈地幔发生南向俯冲,首先其上覆地壳需要发生缩短增厚,增厚的地壳在重力作用下对下覆岩石圈地幔产生向下的垂向作用力,从而迫使岩石圈地幔发生弯曲下插;其次发生俯冲的岩石圈地幔强度不能太高,如果其强度近似刚性,即使增厚的地壳产生附加垂向作用力也不能使其弯曲下插.从计算结果来看,如果亚洲岩石圈地幔发生了南向俯冲,其地表地形会有明显的隆升,同时对应着增厚的地壳,Moho面深度在靠近块体边界处明显增厚;地壳和岩石圈地幔的增厚使得地表热流有所降低,地温梯度减小,俯冲地块的LAB(岩石圈和软流圈界面)深度从块体内部到块体边界呈逐渐增厚的趋势,在块体边界达到最大.
3.2 亚洲岩石圈地幔不俯冲模型case 2结果显示(图 8),由于青藏高原地壳和岩石圈地幔黏滞性均较低,随着块体的持续碰撞挤压,青藏高原岩石圈发生整体增厚,在靠近块体边界处碰撞更剧烈.周缘地块由于强度较高,岩石圈地幔没有发生明显变形,但由于其地壳易于发生塑性形变,因此在靠近碰撞带附近的周缘地块地壳部分有一定程度的增厚.整体上来看,跨越该碰撞带地表地形从碰撞带到地块内部逐渐降低(图 9a),Moho面深度逐渐变浅,LAB(岩石圈和软流圈界面)深度也从碰撞带到块体内部逐渐变浅,增厚的LAB深度主要发生在青藏高原邻近碰撞边界的区域.从地表热流来看,增厚的地壳和岩石圈地幔对应的地表热流有所降低,但跨越整个剖面地表热流变化不大,一般在45~55 mW·m-2.

|
图 8 case 2模型中岩石圈变形演化结果 白色实线代表等温线,红色实线代表地表热流,绿色方块代表地表热流观测值(图 1中BB′剖面),其投影位置相对于块体的边界. Figure 8 Lithospheric deformation (materials, temperature and surface heat flow) for case 2 White lines represents isotherm (℃). Red lines indicate the surface heat flow. Green squares indicate the observed heat flow values along the profile BB′ (Fig. 1). In this projection, the position of the observed surface heat flow is relative to the plate boundary. |

|
图 9 case 2模型中地表地形和岩石圈应变率分布演化图 (a)地表地形演化图;(b)-(d)应变率分布图,虚线代表上、下地壳、岩石圈地幔和块体之间的大致边界. Figure 9 Elevation (a) and strain rate (b)-(d)vary with time for case 2 Dashed lines show the general boundaries of different parts and layers. |
从应变率结果来看(图 9),强度低、变形强烈的青藏高原岩石圈整体应变率高,稳定的周缘地块岩石圈应变率低.地壳部分相对复杂,在强度较低的青藏高原不断挤压作用下,周缘地块地壳发生了塑性屈服,因此,沿着块体碰撞边界从周缘地块地壳底部到地表存在一个明显的高应变率带,同时该高应变率带随着挤压的持续向块体内部不断扩展.该模型中跨越过渡带地表地形相对平缓,高应变率在碰撞的两个块体地壳中均有分布,但高应变率在稳定地块内部的扩展比较有限.
结合地表地质特征和深部地球物理探测,部分学者认为亚洲岩石圈地幔沿着昆仑山断裂带向南俯冲下插到青藏高原之下,而柴达木地块和祁连山地块均处于亚洲岩石圈地幔之上(Yin and Harrison, 2000; Yin et al., 2007; Zhao et al., 2010, 2011).在模型case 2S中,给定周缘地块地壳较高的黏滞性,塑性屈服强度较低,岩石圈地幔黏滞性系数较高而且不发生塑性变形;青藏高原地壳给定较高的黏滞性,不发生塑性变形,岩石圈地幔黏滞性系数较低.计算结果显示(图 10),在青藏高原不断挤压扩展的过程中,如果阿拉善—鄂尔多斯地壳强度相对较低,则脆性地壳在挤压的过程中发生缩短增厚,而青藏高原地壳则变形较弱;阿拉善—鄂尔多斯岩石圈地幔由于强度非常高,变形非常小,与其相碰撞的青藏岩石圈地幔则被动弯曲,近似垂直的向下俯冲.热结构显示青藏高原的地温梯度略有增加,而阿拉善—鄂尔多斯岩石圈略有降低,在块体碰撞过渡带,特别是青藏地壳和亚洲岩石圈地幔之间形成非常高的应变率(图 11),该区的温度相对较高,导致地表热流升高.地表地形和岩石圈应变率显示(图 11),由于地壳和岩石圈地幔之间的垂向流变差异,在该界面形成高应变率带,亚洲地壳以高应变率带为基底,地壳变形不断向北扩展,对应的地表隆升也不断向北扩展(图 11a).

|
图 10 case 2S模型中岩石圈变形演化结果 白色实线代表等温线,红色实线代表地表热流,绿色方块代表地表热流观测值(图 1中BB′剖面),其投影位置相对于块体的边界. Figure 10 Lithospheric deformation (materials, temperature and surface heat flow) for case 2S White lines represents isotherm (℃). Red lines indicate the surface heat flow. Green squares indicate the observed heat flow values along the profile BB′ (Fig. 1). In this projection, the position of the observed surface heat flow is relative to the plate boundary. |

|
图 11 case 2S模型中地表地形和岩石圈应变率分布演化图 (a)地表地形演化图;(b)-(d)应变率分布图,虚线代表上、下地壳、岩石圈地幔和块体之间的大致边界. Figure 11 Elevation (a) and strain rate(b)-(d) vary with time for case 2S Dashed lines show the general boundaries of different parts and layers. |
从以上两个模型可以看出,如果周缘地块岩石圈地幔强度非常高,不断扩展的青藏高原地壳使得周缘地块地壳发生强烈变形,但很难使得岩石圈地幔发生明显形变,虽然靠近块体碰撞边界的地壳有一定程度的缩短增厚,但增厚地壳产生的垂向载荷很难使得下覆岩石圈地幔发生弯曲下插.因此,这种情况下周缘地块岩石圈地幔并未发生俯冲.从碰撞带到地块内部,地形变化相对较缓,Moho界面也由深逐渐变浅.由于青藏高原岩石圈地幔强度较低,因此在挤压作用下反而发生被动下插,使得LAB界面深度在碰撞带发生突变.同时从以上两个模型可以看出,流变结构的横向和垂向差异可以导致碰撞地块的地壳变形边界和岩石圈地幔变形边界不一致.
4 讨论 4.1 下地壳流对岩石圈变形的影响地球物理探测到在青藏高原腹地羌塘地块以及青藏高原东缘均存在低速的下地壳,前人也利用下地壳流模型来解释青藏高原周缘地形的差别.但高速流动的下地壳对岩石圈变形究竟有哪些影响还不明确.为了进一步讨论下地壳流动对变形的影响,在case 2模型基础上我们设计了case 2S2模型,该模型中给定下地壳较低的黏滞性系数(1.0E20Pa·s),同时在模型的200 km处,给定下地壳20 mm/a的水平速度,代表着高速流动的下地壳.模型结果显示(图 12),由于低黏滞性、高速流动的下地壳存在,使得下地壳应变率相对较高.同时相对于上地壳,高速流动的下地壳在受到坚硬的地块阻挡时,有更多的下地壳物质注入松潘甘孜地块,下地壳增厚较为明显,使得整个松潘—甘孜地块地表地形抬升明显.可以看出,地壳的脆性缩短使得块体碰撞过程中变形主要集中在碰撞带附近,而高速流动的下地壳使得块体发生整体隆升.

|
图 12 下地壳低黏滞性、高速流动对地表地形和岩石圈应变率分布的影响 (a)地表地形演化图;(b)-(d)应变率分布图,虚线代表上、下地壳、岩石圈地幔和块体之间的大致边界.与模型case 2相比,该模型中青藏高原的下地壳黏滞性给定为1.0E20 Pa·s,在模型200 km处给定下地壳20 mm/a的速度,代表高速流动的下地壳. Figure 12 The effect of low viscosity, high velocity lower crust on the evolution of elevation (a) and strain rate (b)-(d) Comparing with case 2, the viscosity of lower crust for Tibetan plateau in this case is 1.0E20 Pa·s. A higher velocity (20 mm/a) is imposed on the lower crust at 200km in this case. Dashed lines show the general boundaries of different parts and layers. |
结合之前的模型结果可以看出,在青藏高原向周缘地块扩展过程中,地壳的缩短增厚主要发生在碰撞带或者活动断裂附近,边界带的地表隆升和地壳增厚主要是由于脆性上地壳缩短增厚引起的,而高速流动的下地壳使得远离碰撞边界的地区下地壳增厚,从而导致地表隆升.因此,如果造山带形成之前上、下地壳具有相同的厚度,那么判断脆性缩短增厚模式或者下地壳流模式对一个造山带的贡献可以通过对比上、下地壳的厚度.如果是脆性缩短增厚占主导,那么上地壳增厚程度应该更明显,反之则下地壳增厚程度更明显.
4.2 岩石圈变形与LAB特征深部地球物理探测所得到的LAB(软流圈与岩石圈界面)对于理解岩石圈是否发生俯冲有明显的指示作用,目前主要依据LAB的深度特征来判断岩石圈地幔是否发生了俯冲.但是从数值模拟的结果来看,岩石圈变形与LAB特征有多种对应关系.首先,判断亚洲岩石圈地幔是否发生南向俯冲其前提是亚洲岩石圈地幔和青藏高原岩石圈地幔有本质不同,这种不同主要表现在横向上的.其次,地球物理探测得到的LAB界面主要是软流圈和岩石圈地幔的界面,其差异主要表现在垂向分层上.因此,假设两个块体初始状态具有相同深度的LAB,当它们发生碰撞挤压时,如果观测到LAB由浅变深的特征可能对应着两种情况.一种情况是其中一个地块发生了俯冲弯曲,即目前认为的发生了俯冲;另一种情况是其中一个地块岩石圈发生了增厚,而使得两个地块的LAB界面也形成由浅变深的特征.总结以上结果可以看出,根据地球物理探测得到的LAB界面来判断亚洲岩石圈地幔是否发生俯冲,不仅要明确LAB的变化形态,同时要注意LAB界面横向上的物质差异,即是否属于同一地块.
4.3 模型中存在的部分问题本文利用二维有限元模型对青藏高原东北缘岩石圈变形过程进行了探讨.实际中在青藏高原东北缘不仅有挤压引起的逆冲断层发育,同时有大量的走滑活动断层.这些变形特征及动力学需要采用三维模型才能考虑.同时,目前模型仅仅考虑了青藏高原与周缘地块流变强度差异的一级效应,即地壳和地幔的软硬特征,更复杂的模型如详细的上、下地壳划分需要在今后的研究中考虑.本研究中由于受到模型垂向深度的限制,并不能充分考虑深部地幔动力学效应,如软流圈的小尺度对流和岩石圈的拆沉等效应的影响,这也需要在今后的研究中详细考虑.
由于影响岩石圈变形方式的因素众多,比如密度结构、地表过程等因素,限于问题的复杂性,本文重点考虑了岩石圈流变强度的差异对岩石圈变形方式的影响,其他影响因素本文并未涉及.
5 结论本文利用二维热力学有限元模型探讨了岩石圈流变强度差异对青藏高原东北缘岩石圈变形和热结构的影响,主要得到以下认识:
(1) 当祁连山地块地壳强度相对较低,在青藏高原不断横向扩展过程中会发生缩短增厚,增厚的地壳在重力作用下对下覆岩石圈地幔产生附加垂向作用力,如果下覆岩石圈地幔强度相对较低,则会发生弯折下插.亚洲岩石圈地幔如果发生了南向俯冲,其地表地形会有明显的隆升,同时对应着增厚的地壳,增厚的地壳使得地温梯度减小,地表热流有所降低,而俯冲地块的LAB(岩石圈和软流圈界面)深度从块体内部到块体边界呈逐渐增厚的趋势,在块体边界达到最大.
(2) 如果周缘地块岩石圈地幔强度非常高,强度相对较低的青藏高原岩石圈在扩展过程中则会发生明显增厚,从而使得从青藏高原到周缘地块的LAB界面发生由深到浅的变化,但较深的LAB界面主要由青藏高原岩石圈整体增厚引起的,周缘地块的岩石圈地幔,即亚洲岩石圈地幔不会发生南向俯冲.
(3) 低黏滞性、高速流动的青藏高原下地壳使得下地壳应变率分配非常高,下地壳整体增厚,对应的地表地形整体隆升.
致谢 感谢审稿人提出的宝贵建议和编辑的精心加工.| [] | Beaumont C, Jamieson R A, Nguyen M H, et al. 2001. Himalayan tectonics explained by extrusion of a low-viscosity crustal channel coupled to focused surface denudation[J]. Nature, 414(6865): 738–742. DOI:10.1038/414738a |
| [] | Buiter S J H, Babeyko A Y, Ellis S, et al. 2006. The numerical sandbox:comparison of model results for a shortening and an extension experiment[J]. Geological Society, London, Special Publications, 253(1): 29–64. DOI:10.1144/GSL.SP.2006.253.01.02 |
| [] | Cui D X, Wang Q L, Hu Y X, et al. 2009. Lithosphere deformation and deformation mechanism in northeastern margin of Qinghai-Tibet plateau[J]. Chines Journal of Geophysics, 52(6): 1490–1499. DOI:10.3969/j.issn.0001-5733.2009.06.010 |
| [] | Deng Q D, Zhang P Z, Ran Y K, et al. 2003. Basic characteristics of active tectonics of China[J]. Science in China (Series D), 46(4): 356–372. |
| [] | Engdahl E R, van der Hilst R, Buland R. 1998. Global teleseismic earthquake relocation with improved travel times and procedures for depth determination[J]. Bulletin of the Seismological Society of America, 88(3): 722–743. |
| [] | England P, Houseman G. 1986. Finite strain calculations of continental deformation:2.comparison with the India-Asia collision zone[J]. Journal ofGeophysicalResearch:Solid Earth, 91(B3): 3664–3676. DOI:10.1029/JB091iB03p03664 |
| [] | England P, McKenzie D. 1982. A thin viscous sheet model for continental deformation[J]. Geophysical Journal of the Royal Astronomical Society, 70(2): 295–321. DOI:10.1111/j.1365-246X.1982.tb04969.x |
| [] | Feng M, Kumar P, Mechie J, et al. 2014. Structure of the crust and mantle down to 700 km depth beneath the East Qaidam basin and Qilian Shan from P and S receiver functions[J]. Geophysical Journal International, 199(3): 1416–1429. DOI:10.1093/gji/ggu335 |
| [] | Fullsack P. 1995. An arbitrary Lagrangian-Eulerian formulation for creeping flows and its application in tectonic models[J]. Geophysical Journal International, 120(1): 1–23. DOI:10.1111/gji.1995.120.issue-1 |
| [] | Gan W J, Zhang P Z, Shen Z K, et al. 2007. Present-day crustal motion within the Tibetan Plateau inferred from GPS measurements[J]. Journal of Geophysical Research:Solid Earth, 112(B8): B08416. |
| [] | Gao R, Cheng X Z, Wu G J. 1999. Lithospheric structure and geodynamic model of the Golmud-Ejn transect in northern Tibet[A].//Macfarlane A, Sorkhabi R B, Quade J eds. Himalaya and Tibet:Mountain Roots to Mountain Tops[M]. Geological Society of America, 9-17. |
| [] | Ge W P, Wang M, Shen Z K, et al. 2013. Intersiesmic kinematics and defromation patterns on the upper crust of Qaidam-Qilianshan block[J]. Chinese Journal of Geophysics, 56(9): 2994–3010. DOI:10.6038/cjg20130913 |
| [] | Gerya T V, Yuen D A. 2003. Rayleigh-Taylor instabilities from hydration and melting propel 'cold plumes' at subduction zones[J]. Earth and Planetary Science Letters, 212(1-2): 47–62. DOI:10.1016/S0012-821X(03)00265-6 |
| [] | Houseman G, England P. 1986. Finite strain calculations of continental deformation:1.method and general results for convergent zones[J]. Journal ofGeophysicalResearch, 91(B3): 3651–3663. |
| [] | Hu S B, He L J, Wang J Y. 2001. Compilation of heat flow data in the China continental area (3rd edition)[J]. Chinese Journal of Geophysics, 44(5): 611–625. DOI:10.3321/j.issn:0001-5733.2001.05.005 |
| [] | Huang J L, Zhao D P. 2006. High-resolution mantle tomography of China and surrounding regions[J]. Journal ofGeophysicalResearch, 111(B9): B09305. |
| [] | Jiang G Z, Gao P, Rao S, et al. 2016. Compilation of heat flow data in the continental area of China (4thedition)[J]. Chinese Journal of Geophysics, 59(8): 2829–2910. DOI:10.6038/cjg20160815 |
| [] | Jiménez-Munt I, Fernàndez M, Vergés J, et al. 2008. Lithosphere structure underneath the Tibetan Plateau inferred from elevation, gravity and geoid anomalies[J]. Earth and Planetary Science Letters, 267(1-2): 276–289. DOI:10.1016/j.epsl.2007.11.045 |
| [] | Karplus M S, Zhao W, Klemperer S L, et al. 2011. Injection of Tibetan crust beneath the South Qaidam Basin:Evidence from INDEPTH IV wide-angle seismic data[J]. Journal of Geophysical Research:Solid Earth, 116(B7): B07301. |
| [] | Lei J S, Li Y, Xie F R, et al. 2014. Pn anisotropic tomography and dynamics under eastern Tibetan plateau[J]. Journal of Geophysical Research:Solid Earth, 119(3): 2174–2198. DOI:10.1002/2013JB010847 |
| [] | Li C, van der Hilst R D. 2010. Structure of the upper mantle and transition zone beneath Southeast Asia from traveltime tomography[J]. Journal of Geophysical Research:Solid Earth, 115(B7): B07308. |
| [] | Liang X F, Chen Y, Tian X B, et al. 2016. 3D imaging of subducting and fragmenting Indian continental lithosphere beneath southern and central Tibet using body-wave finite-frequency tomography[J]. Earth and Planetary Science Letters, 443: 162–175. DOI:10.1016/j.epsl.2016.03.029 |
| [] | Liang X F, Sandvol E, Chen Y J, et al. 2012. A complex Tibetan upper mantle:A fragmented Indian slab and no south-verging subduction of Eurasian lithosphere[J]. Earth and Planetary Science Letters, 333-334: 101–111. DOI:10.1016/j.epsl.2012.03.036 |
| [] | Liu M J, Mooney W D, Li S L, et al. 2006. Crustal structure of the northeastern margin of the Tibetan plateau from the Songpan-Ganzi terrane to the Ordos basin[J]. Tectonophysics, 420(1-2): 253–266. DOI:10.1016/j.tecto.2006.01.025 |
| [] | Shen X Z, Yuan X H, Liu M. 2015. Is the Asian lithosphere underthrusting beneath northeastern Tibetan Plateau? Insights from seismic receiver functions[J]. Earth and Planetary Science Letters, 428: 172–180. DOI:10.1016/j.epsl.2015.07.041 |
| [] | Stockmal G S, Beaumont C, Nguyen M, et al. 2007. Mechanics of thin-skinned fold-and-thrust belts:Insights from numerical models[A].//Sears J W, Harms T A, Evenchick C A eds. Whence the Mountains? Inquiries into the Evolution of Orogenic Systems:A Volume in Honor of Raymond A. Price[M].Geological Society of America, 63-98. |
| [] | Sun Y J, Dong S W, Fan T Y, et al. 2013. 3D rheological structure of the continental lithosphere beneath China and adjacent regions[J]. Chinese Journal of Geophysics, 56(9): 2936–2946. DOI:10.6038/cjg20130908 |
| [] | Sun Y J, Dong S W, Fan T Y, et al. 2013a. 3D rheological structure of the continental lithosphere beneath China and adjacent regions[J]. Chinese Journal of Geophysics, 56(5): 546–558. DOI:10.1002/cjg2.2013.56.issue-5 |
| [] | Sun Y J, Dong S W, Zhang H, et al. 2013b. 3D thermal structure of the continental lithosphere beneath China and adjacent regions[J]. Journal of Asian Earth Sciences, 62: 697–704. DOI:10.1016/j.jseaes.2012.11.020 |
| [] | Tapponnier P, Meyer B, Avouac J P, et al. 1990. Active thrusting and folding in the Qilian Shan, and decoupling between upper crust and mantle in northeastern Tibet[J]. Earth and Planetary Science Letters, 97(3-4): 382–403. DOI:10.1016/0012-821X(90)90053-Z |
| [] | Tapponnier P, Xu Z Q, Roger F, et al. 2001. Oblique stepwise rise and growth of the Tibet plateau[J]. Science, 294(5547): 1671–1677. DOI:10.1126/science.105978 |
| [] | Tian X B, Liu Z, Si S K, et al. 2014. The crustal thickness of NE Tibet and its implication for crustal shortening[J]. Tectonophysics, 634: 198–207. DOI:10.1016/j.tecto.2014.07.001 |
| [] | Tian X B, Zhang Z J. 2013. Bulk crustal properties in NE Tibet and their implications for deformation model[J]. Gondwana Research, 24(2): 548–559. DOI:10.1016/j.gr.2012.12.024 |
| [] | Wang C Y, Chan W W, Mooney W D. 2003. Three-dimensional velocity structure of crust and upper mantle in southwestern China and its tectonic implications[J]. Journal of Geophysical Research:Solid Earth, 108(B9): 2442. |
| [] | Wang C Y, Huangfu G. 2004. Crustal structure in Tengchong volcano-geothermal area, western Yunnan, China[J]. Tectonophysics, 380(1-2): 69–87. DOI:10.1016/j.tecto.2003.12.001 |
| [] | Wang Q, Gao Y, Shi Y T, et al. 2013. Seismic anisotropy in the uppermost mantle beneath the northeastern margin of Qinghai-Tibet plateau:Evidence from shear wave splitting of SKS, PKS and SKKS[J]. Chinese Journal of Geophysics, 56(3): 892–905. DOI:10.6038/cjg20130318 |
| [] | Wei W, Xu J D, Zhao D P, et al. 2012. East Asia mantle tomography:New insight into plate subduction and intraplate volcanism[J]. Journal of Asian Earth Sciences, 60: 88–103. DOI:10.1016/j.jseaes.2012.08.001 |
| [] | Willett S D, Beaumont C. 1994. Subduction of Asian lithospheric mantle beneath Tibet inferred from models of continental collision[J]. Nature, 369(6482): 642–645. DOI:10.1038/369642a0 |
| [] | Yao H J, van der Hilst R D, Montagner J P. 2010. Heterogeneity and anisotropy of the lithosphere of SE Tibet from surface wave array tomography[J]. Journal of Geophysical Research:Solid Earth, 115(B12): B12307. DOI:10.1029/2009JB007142 |
| [] | Ye Z, Gao R, Li Q S, et al. 2015. Seismic evidence for the North China plate underthrusting beneath northeastern Tibet and its implications for plateau growth[J]. Earth and Planetary Science Letters, 426: 109–117. DOI:10.1016/j.epsl.2015.06.024 |
| [] | Yin A, Dang Y Q, Zhang M, et al. 2007. Cenozoic tectonic evolution of Qaidam basin and its surrounding regions (part 2):Wedge tectonics in southern Qaidam basin and the eastern Kunlun Range[A].//Sears J W, Harms T A, Evenchick C A eds. Whence the Mountains? Inquiries into the Evolution of Orogenic Systems:A Volume in Honor of Raymond A. Price[M]. Geological Society of America Special Papers, 369-390. |
| [] | Yin A, Harrison T M. 2000. Geologic evolution of the Himalayan-Tibetan orogen[J]. Annual Review of Earth and Planetary Sciences, 28: 211–280. DOI:10.1146/annurev.earth.28.1.211 |
| [] | Yuan D Y, Ge W P, Chen Z W, et al. 2013. The growth of northeastern Tibet and its relevance to large-scale continental geodynamics:A review of recent studies[J]. Tectonics, 32(5): 1358–1370. DOI:10.1002/tect.20081 |
| [] | Zhang P Z, Shen Z K, Wang M, et al. 2004. Continuous deformation of the Tibetan Plateau from global positioning system data[J]. Geology, 32(9): 809–812. DOI:10.1130/G20554.1 |
| [] | Zhang P Z, Zheng D W, Yin G M, et al. 2006. Discussion on late Cenozoic growth and rise of northeastern margin of the Tibetan plateau[J]. Quaternary Sciences, 26(1): 5–13. |
| [] | Zhang Z J, Bai Z M, Klemperer S L, et al. 2013. Crustal structure across northeastern Tibet from wide-angle seismic profiling:Constraints on the Caledonian Qilian orogeny and its reactivation[J]. Tectonophysics, 606: 140–159. DOI:10.1016/j.tecto.2013.02.040 |
| [] | Zhao J M, Yuan X H, Liu H B, et al. 2010. The boundary between the Indian and Asian tectonic plates below Tibet[J]. Proceedings of the National Academy of Sciences of the United States of America, 107(25): 11229–11233. DOI:10.1073/pnas.1001921107 |
| [] | Zhao W J, Kumar P, Mechie J, et al. 2011. Tibetan plate overriding the Asian plate in central and northern Tibet[J]. Nature Geoscience, 4(12): 870–873. DOI:10.1038/ngeo1309 |
| [] | Zhao W J, Wu Z H, Shi D N, et al. 2014. Deep structure and orogenic mechanism of the Kunlun mountains[J]. Geology in China, 41(1): 1–18. |
| [] | Zheng D W, Zhang P Z, Wan J L, et al. 2006. Rapid exhumation at~8 Ma on the Liupan Shan thrust fault from apatite fission-track thermochronology:Implications for growth of the northeastern Tibetan Plateau margin[J]. Earth and Planetary Science Letters, 248(1-2): 198–208. DOI:10.1016/j.epsl.2006.05.023 |
| [] | Zheng W J, Zhang H P, Zhang P Z, et al. 2013a. Late Quaternary slip rates of the thrust faults in western Hexi Corridor (northern Qilian Shan, China) and their implications for northeastward growth of the Tibetan Plateau[J]. Geosphere, 9(2): 342–354. DOI:10.1130/GES00775.1 |
| [] | Zheng W J, Zhang P Z, Ge W P, et al. 2013b. Late Quaternary slip rate of the South Heli Shan Fault (northern Hexi Corridor, NW China) and its implications for northeastward growth of the Tibetan Plateau[J]. Tectonics, 32(2): 271–293. DOI:10.1002/tect.v32.2 |
| [] | Zheng W J, Zhang P Z, He W G, et al. 2013c. Transformation of displacement between strike-slip and crustal shortening in the northern margin of the Tibetan Plateau:Evidence from decadal GPS measurements and late Quaternary slip rates on faults[J]. Tectonophysics, 584: 267–280. DOI:10.1016/j.tecto.2012.01.006 |
| [] | Zheng W J, Zhang P Z, Yuan D Y, et al. 2009. Deformation on the northern of the Tibetan plateau from GPS measurement and geologic rates of Late Quaternary along the major fault[J]. Chinese Journal of Geophysics, 52(10): 2491–2508. DOI:10.3969/j.issn.0001-5733.2009.10.008 |
| [] | 崔笃信, 王庆良, 胡亚轩, 等. 2009. 青藏高原东北缘岩石圈变形及其机理[J]. 地球物理学报, 52(6): 1490–1499. DOI:10.3969/j.issn.0001-5733.2009.06.010 |
| [] | 葛伟鹏, 王敏, 沈正康, 等. 2013. 柴达木-祁连山地块内部震间上地壳块体运动特征与变形模式研究[J]. 地球物理学报, 56(9): 2994–3010. DOI:10.6038/cjg20130913 |
| [] | 胡圣标, 何丽娟, 汪集旸. 2001. 中国大陆地区大地热流数据汇编(第三版)[J]. 地球物理学报, 44(5): 611–625. DOI:10.3321/j.issn:0001-5733.2001.05.005 |
| [] | 姜光政, 高堋, 饶松, 等. 2016. 中国大陆地区大地热流数据汇编(第四版)[J]. 地球物理学报, 59(8): 2892–2910. DOI:10.6038/cjg20160815 |
| [] | 孙玉军, 董树文, 范桃园, 等. 2013. 中国大陆及邻区岩石圈三维流变结构[J]. 地球物理学报, 56(9): 2936–2946. DOI:10.6038/cjg20130908 |
| [] | 王琼, 高原, 石玉涛, 等. 2013. 青藏高原东北缘上地幔地震各向异性:来自SKS、PKS和SKKS震相分裂的证据[J]. 地球物理学报, 56(3): 892–905. DOI:10.6038/cjg20130318 |
| [] | 张培震, 郑德文, 尹功明, 等. 2006. 有关青藏高原东北缘晚新生代扩展与隆升的讨论[J]. 第四纪研究, 26(1): 5–13. |
| [] | 赵文津, 吴珍汉, 史大年, 等. 2014. 昆仑山深部结构与造山机制[J]. 中国地质, 41(1): 1–18. |
| [] | 郑文俊, 张培震, 袁道阳, 等. 2009. GPS观测及断裂晚第四纪滑动速率所反映的青藏高原北部变形[J]. 地球物理学报, 52(10): 2491–2508. DOI:10.3969/j.issn.0001-5733.2009.10.008 |