 2017, Vol. 32


2. 地球探测与信息技术教育部重点实验室(成都理工大学), 成都 610059
2. Key Laboratory of Earth Exploration and Information Technology of Ministry of Education(Chengdu University of Technology), Chengdu 610059, China
由于植被在人类生存环境的中的重要作用,植被遥感一直是遥感应用领域研究热点.其中遥感植被指数是研究植被最简单、最有效的方法之一(孙斌等,2015).当前多光谱遥感数据植被指数主要有归一化植被指数、土壤调节植被指数、垂直植被指数、差值植被指数(Richardson and Wiegand, 1977;Huete,1988;徐爽等,2012;Petus et al., 2013)等.算法的核心都是基于植被在近红外、红波段范围的反射率进行组合运算(Viña et al., 2011).但是,植被反射光谱特征是由叶片的叶肉细胞、叶绿素、叶黄素、叶红素、水分和其他生物化学成分等共同决定的,从绿波段到近红外波段整个范围内都有体现(童庆禧等,2006).由于多光谱遥感技术的先天性不足,无法体现植被在连续波段范围的吸收过程,仅仅依靠简单的波段组合计算也是无奈之举(Bioucas-Dias et al., 2013).势必造成其反映的植被信息准确度与可靠性欠佳,如简单地将方法移植到高光谱遥感的数据处理中,由于波段更窄原因,质量与效果会再次降低.高光谱遥感技术发展迅速,应用日益广泛(张良培,2014;贺军亮等,2015;Kudela et al., 2015;杜培军等,2016;李万伦和甘甫平,2016).与多光谱遥感相比,高光谱遥感具同时成像成谱特点,波谱分辨率更高,包含更精细的地物信息,因此,研究面向高光谱遥感植被应用的植被指数计算方法,也显得十分重要(Brantley et al., 2011).
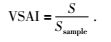
1 方法设计 1.1 设计思路文章提出了一种基于综合吸收能力的植被指数计算方法(Vegetation Spectral Absorption Index,VSAI),该方法综合考虑了植被在观测状态下的光谱综合吸收能力,即植被在绿色波段到近红外整个波段范围的吸收反射特征(图 1).其基本思想是:① 基于遥感数据,先用普适的方法计算出每个像元在绿色波段到近红外波段范围内的反射率,得到反射率曲线.② 利用绿色中心波长、红色—近红外波长范围内的第一个拐点,将这两点用直线连接,结合这两点间的反射率曲线,构建一个植被吸收特征多边形.③ 通过计算这个多边形面积与样本多边形的面积比值来反映植被状态信息.样本多边形可以是实地仪器测量,也可以是根据经验从遥感影像中选取计算得出.

|
图 1 植被光谱曲线 Figure 1 Typical vegetation spectra |
遥感影像进行大气校正,将遥感影像的DN(Digital Number)值转换为地表反射率或地表辐射亮度,定标到地表反射率,得到像元的光谱曲线.用绿色中心波长、红色波长到近红外波长的拐点两处的反射率值坐标连线,结合这两点范围内的反射率曲线,构建一个植被吸收特征多边形(如图 2).

|
图 2 绿波段至红外波段局部曲线图 Figure 2 Spectral curve from green band to infrared band |
|
|
表 1 符号定义 Table 1 Symbol definition |
1) 计算多边形的面积
在高光谱图像中绿色波段到拐点处包含了很多波段,连续密集排列,所以曲边多边形的面积是多个梯形面积求和(如图 2).
2) 计算步骤及公式
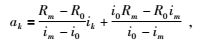
(1) 拐点1-2与坐标轴围城的面积计算公式为
|
(1) |

|
(2) |
(2) 指数计算公式为
|
(3) |
为了验证方法,文章选择了一个植被发育良好的地区汶川县银杏乡,研究区面积为277.5 km2,位于汶川县的高山峡谷地带,林地覆盖率高,除自然林公益林外,种有茶、漆、板栗、银杏、桃李、猕猴桃等经济林,生态环境优越.影像拍摄于汶川地震之后,大地震导致研究区内地表遭到严重破坏,产生大面积的次生灾害,失稳区域植被信息评估极其重要.
2.1 数据处理数据选用了EO-1的Hyperion高光谱影像数据,共计242波段,可见光近红外区(1~70波段),短波红外区(71~242波段)光谱分辨率达到10 nm,空间分辨率为30 m.去除重复波段,水汽影响波段(约20个)、未标定波段(44个)、信噪比低波段后,进行了坏线修复、条纹去除、Smell效应校正、反射率计算等处理(谭炳香等,2005).然后将高空间分辨率影像、多光谱遥感影像与高光谱影像进行配准,借助高分辨率影像提取植被样本数据,筛选样本后(也可以是实测数据),经过论文设计方法求得植被在绿光至近红外波段高光谱分辨率反射曲线形成的光谱吸收曲面面积.然后逐像元计算绿光至近红外波段光谱吸收曲面面积,将其与样本相比,得到了如图 3c的VSAI.

|
图 3 研究区影像图 (a)研究区位置图;(b)研究区高光谱影像;(c)研究区高分辨率影像. Figure 3 Images of the study area (a)Location map of the study area; (b)Hyperspectral image of the study area; (c)High resolution image of the study area. |

|
图 4 VSAI与NDVI、RVI对比效果 Figure 4 Contrast effect of VSAI and NDVI, RVI |
计算得到研究区NDVI(Normalized Difference Vegetation Index)、RVI(Ratio Vegetation Index)、VSAI等3种植被指数后,分别将其进行归一化处理.为了将指数的效果进行比较,利用高分辨率影像和实地调查数据,随机选取了该实验区的植被、河流、滑坡三种典型的地物类别作为数据分析区.利用三种地物类别数据裁剪结果数据,获得其对应的NDVI、RVI、VSAI的值,并统计了典型地物的植被指数(表 2),结果表明:(1) 与NDVI、RVI两种指数相比,VSAI的层次更多,区分能力强.实验样本的NDVI、RVI、VSAI 3种指数对应的标准差分别为0.19、0.17、0.28,表明VSAI指数分布更离散,信息更丰富.(2)3种指数都能很好的区分植被区和非植被区.但对非植被区中VSAI能较容易的分辩出河流与滑坡,这是由于VSAI考虑了光谱吸收过程,而不是一个固定波长的反射特征.(3) VSAI样本可以是野外实测数据,表明VSAI可以开展一种植被与其他植被(或者同一植被的不同状态)对比研究.
|
|
表 2 典型地物覆盖下指数统计 Table 2 Index statistics of typical object |
通过从植被光谱响应机理与应用实验分析,可以得几点结论:(1) 传统植被指数因为数据利用单一,无法适应高光谱数据的处理,需要发展新方法去充分利用高光谱数据优势.(2) VSAI利用了植被的近红外波强反射特征的同时,又兼顾到了绿色波段在鉴别植被中的贡献,能较真实的反映植被覆盖度.(3) 考虑到了时空差别带来的数据影响,将样本点设置为实地测量或者人工交互选取,方法具有更强的适应性和可操作性.
致谢 感谢审稿专家提出的修改意见和编辑部的大力支持,感谢丁志名、胡源在数据处理过程中提供的建议和帮助.| [] | Bioucas-Dias JM, Plaza A, Camps-Valls G, et al. 2013. Hyperspectral remote sensingdata analysis and future challenges[J]. IEEE Geoscience and Remote Sensing Magazine, 1(2): 6–36. DOI:10.1109/MGRS.2013.2244672 |
| [] | Brantley S T, Zinnert J C, Young D R. 2011. Application of hyperspectral vegetation indices to detect variations in high leaf area index temperate shrub thicket canopies[J]. Remote Sensing of Environment, 115(2): 514–523. DOI:10.1016/j.rse.2010.09.020 |
| [] | Du P J, Xia J S, Xue Z H, et al. 2016. Review of hyperspectral remote sensing image classification[J]. Journal of Remote Sensing(in Chinese), 20(2): 236–256. |
| [] | He J L, Zhang S Y, Zha Y, et al. 2015. Review of retrieving soil heavy metal content by hyperspectral remote sensing[J]. Remote Sensing Technology and Application(in Chinese), 30(3): 407–412. |
| [] | Huete A R. 1988. A soil-adjusted vegetation index (SAVI)[J]. Remote Sensing of Environment, 25(3): 295–309. DOI:10.1016/0034-4257(88)90106-X |
| [] | Kudela R M, Palacios S L, Austerberry D C, et al. 2015. Application of hyperspectral remote sensing to cyanobacterial blooms in inland waters[J]. Remote Sensing of Environment, 167: 196–205. DOI:10.1016/j.rse.2015.01.025 |
| [] | Li W L, Gan F P. 2016. Progress in hyperspectral research and monitoring in mine environment[J]. Remote Sensing for Land & Resources(in Chinese), 28(6): 1–7. |
| [] | Petus C, Lewis M, White D. 2013. Monitoring temporal dynamics of Great Artesian Basin wetland vegetation, Australia, using MODIS NDVI[J]. Ecological Indicators, 34: 41–52. DOI:10.1016/j.ecolind.2013.04.009 |
| [] | Richardson A J, Wiegand C L. 1977. Distinguishing vegetation from soil background information[J]. Photogrammetric Engineering and Remote Sensing, 43(12): 1541–1552. |
| [] | Sun B, Li Z Y, Guo Z H, et al. 2015. Comparison of sparse vegetation information estimation based on GF-1 and Landsat multi-spectral data[J]. Remote Sensing Information(in Chinese), 30(5): 48–56. |
| [] | Tan B X, Li Z Y, Chen E X, et al. 2005. Preprocessing of EO-1 Hyperion hyperspectral data[J]. Remote Sensing Information(in Chinese)(6): 36–41. |
| [] | TONG Qing-Xi, ZHANG Bing, ZHENG Lan-Fen. 2006. Hyperspectral Remote Sensing(in Chinese)[M]. Beijing: Higher Education Press: 364-377. |
| [] | Viña A, Gitelson A A, Nguy-RobertsonA L, et al. 2011. Comparison of different vegetation indices for the remote assessment of green leaf area index of crops[J]. Remote Sensing of Environment, 115(12): 3468–3478. DOI:10.1016/j.rse.2011.08.010 |
| [] | Xu S, Shen R P, Yang XY. 2012. A comparative study of different vegetation indices for estimating vegetation coverage based on the dimidiate pixel model[J]. Remote Sensing for Land & Resources(in Chinese), 24(4): 95–100. |
| [] | ZHANG Liang-Pei. 2014. Advance and future challenges in hyperspectral target detection[J]. Geomatics and Information science of Wuhan University(in Chinese), 39(12): 1387–1395. |
| [] | 杜培军, 夏俊士, 薛朝辉, 等. 2016. 高光谱遥感影像分类研究进展[J]. 遥感学报, 20(2): 236–256. |
| [] | 贺军亮, 张淑媛, 查勇, 等. 2015. 高光谱遥感反演土壤重金属含量研究进展[J]. 遥感技术与应用, 30(3): 407–412. |
| [] | 李万伦, 甘甫平. 2016. 矿山环境高光谱遥感监测研究进展[J]. 国土资源遥感, 28(6): 1–7. |
| [] | 孙斌, 李增元, 郭中, 等. 2015. 高分一号与Landsat TM数据估算稀疏植被信息对比[J]. 遥感信息, 30(5): 48–56. |
| [] | 谭炳香, 李增元, 陈尔学, 等. 2005. EO-1 Hyperion高光谱数据的预处理[J]. 遥感信息(6): 36–41. |
| [] | 童庆禧, 张兵, 郑兰芬. 2006. 高光谱遥感——原理、技术与应用[M]. 北京: 高等教育出版社: 364-377. |
| [] | 徐爽, 沈润平, 杨晓月. 2012. 利用不同植被指数估算植被覆盖度的比较研究[J]. 国土资源遥感, 24(4): 95–100. DOI:10.6046/gtzyyg.2012.04.16 |
| [] | 张良培. 2014. 高光谱目标探测的进展与前沿问题[J]. 武汉大学学报·信息科学版, 39(12): 1387–1395. |