 2017, Vol. 32


目前国际上正在进行的全球“地震可预测性合作研究”(Collaboratory for the Study of Earthquake Predictability, CSEP) 计划 (http://www.cseptesting.org) 的主要科学目标,是在严格的统计检验约束下获取地震可预测属性 (Jordan, 2006; Schorlemmer et al., 2010),这一研究计划和相应的科学思路,对“循序渐进”(brick by brick) 地提高地震预测预报现实水平,以及构建区域地震预测策略具有重要启发意义.其中,关于短期地震预测模型,已有Reasenberg-Jones方法 (Reasenberg and Jones, 1989)、“短期地震概率”(STEP) 模型 (Gerstenberger et al., 2004; 2005)、“传染型地震序列”(ETES) 模型和“传染型状态-速率”(ERS) 模型 (Falcone et al., 2010)、“传染型余震序列”(ETAS) 模型 (Helmstetter et al., 2006; Werner et al., 2011; Zhuang, 2011) 等多种预测模型被投入到全球多个分布式的“检验中心”(testing center) 进行预测效能检验.此外,采用与长期预测模型 (Rhoades and Evison, 2004; 2005; 2006; Console et al., 2006; Rhoades, 2007) 和物理预测模型 (Steacy et al., 2014) 联合构建“混合模型”(mixture model) 的方式,也在显著提升地震短期预测模型的效能.
地震短期预测模型的主要研究内容之一,是对余震序列开展短期地震发生率预测,并进行系统的预测效能评估、构建区域的余震预测策略.在常用的地震短期预测模型中,较为前沿的是ETAS模型 (Ogata et al., 1988; 1989; 2001) 和“瘦化算法”(thinning algorithm, Lewis and Shedler, 1979; Ogata, 1981).ETAS模型作为“大森-宇津”公式 (Omori, 1894; Utsu, 1961) 的推广,在对实际地震序列的模拟中,被认为是最接近真实、拟合效果最好的模型之一.时-空ETAS模型目前已在美国加州地区 (Helmstetter et al., 2006) 和日本地区 (Zhuang, 2011) 的地震短期预测中进行系统性评估,时间序列的ETAS模型和瘦化算法已在2015年尼泊尔8.0级地震 (http://earthquake.usgs.gov/earthquakes/eventproducts/us20002926) 和2015年云南鲁甸6.5级地震 (蒋长胜等, 2015) 的余震“向前预测”(forward forecasting) 中得到应用.
构建包括地震短期预测模型在内的符合区域地震活动特点、定量化、可检验的地震预测模型,是提升区域防震减灾能力的关键.晋冀蒙交界地区是华北地区地震活动最为活跃的地区之一,历史上曾发生包括公元512年山西原平7.5级、1989年大同-阳高5.8级、1998年张北6.2级等强震,该区域的地震危险性始终得到地震学家的高度关注,是天然的地震预测“试验场”.本研究尝试采用ETAS模型和瘦化算法,对晋冀蒙交界地区记录较好的4级以上地震序列开展地震短期发生率预测的回溯性研究,以及预测效能的系统性检验,以期待能构建适合该地区地震短期发生率预测的策略.
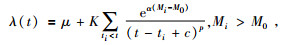
1 研究所用方法 1.1 “传染型余震序列”ETAS模型由于传统的“大森-宇津”公式 (Omori, 1894; Utsu, 1961) 仅能描述简单的地震序列,Ogata (1988)将自相似思想引入“大森-宇津”公式,并认为余震序列中任何地震都能产生自己的高阶余震,从而构建了“传染型余震序列”ETAS模型.ETAS模型的条件强度函数可表示为
|
(1) |
其中Mi和ti分别为事件i的震级和发生时间,M0为参考震级,这里设定为计算所用的截止震级 (Mc).上式中的参数p表示相应的地震序列的衰减快慢,当p越大时序列衰减越快,反之则越慢.参数α表示序列触发次级余震的能力 (Ogata, 1989; 1992),α越大表示触发次级余震的能力越弱,反之亦然.对于震群型序列,一般情况下α < 1,而当序列中无明显的高阶余震被触发时,α则较大 (Ogata, 2001).参数c为数值极小的正常数,一般用于调节当地震序列在主震发生后极短时间内余震记录不完整,以及避免上式中分母为0的情况.参数μ为背景地震的发生率,为确保参数拟合的稳定性,当区域内背景地震发生率不高时,可通过设置μ=0来降低拟合的难度.
1.2 瘦化算法目前常用Ogata (1981)给出的修正的“瘦化算法”(thinning algorithm,Lewis and Shedler, 1979) 进行在特定预测时间内的余震发生率模型,并用于余震预测.为表述方便,本文中将修正的“瘦化算法”统称为“瘦化算法”.“瘦化算法”的核心思想是,基于ETAS模型给出的序列拟合参数,采用分步、滑动模拟的方式,将复杂的非线性的地震序列模拟转化为齐次泊松过程,逐步外推、多次模拟,从而获得未来的地震发生率.其基本计算步骤如下:
(1) 以预测/模拟时段的起始时刻t=tsta为起点,使用上一时段结束时的ETAS模型参数,即tsta时刻的[μ, K, c, α, p]来计算条件强度函数λ*.设定模拟步长为m(t),在[t, t+m(t)]时段内进行齐次泊松过程模拟.模拟获得的震级分布需同时满足G-R关系,获得的λ*也同时需满足其上限低于t时刻的条件强度函数u(t),即maxλ*(t+s)≤u(t),其中s∈[0, m(t)].
(2) 在[0, 1]中产生一个独立的均匀随机变量U1,并使得模拟步长m(t)=-lg (U1)/λ*(t+l(t), M-Mc), M≥Mc.如果s>m(t),设定t=t+m(t);如t+s>tend或U1>λ*(t+s)/m(t),则令t=t+s.否则,n=n+1,tn=t+s,t=t+s.
(3) 重复上述步骤,直至时间t+s>tend时完成滑动模拟,此时可模拟生成随机地震目录{t1, t2, …, tn}.
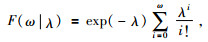
1.3 N-test方法对ETAS模型和“瘦化算法”模拟/预测获得的预测时段内的地震发生率,是否与真实的地震序列相符合,需要进行专门的统计检验.CSEP计划针对地震发生率预测专门开发了地震数检验N-test方法 (Kagan and Jackson, 1995; Schorlemmer et al., 2007),并用来考察预测的地震数目与实际发生地震数是否存在偏差.在应用过程中,假定多次模拟/预测结果相对于实际地震发生率是服从泊松分布的数据集,Zechar (2010)将N-test方法的操作进行了简化.对发生不超过ω个事件概率的泊松累积分布函数可表示为
|
(2) |
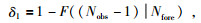
将预测获得的地震发生数用Nfore表示,实际发生的地震数用Nobs表示,对预测生成的模拟地震目录 (模拟的地震目录数量一般为数百个,以保证检验的统计有效性),可进行任意置信度的检验 (Kagan and Jackson, 1995).在Zechar (2010)的简化处理中,可通过评分量δ1和δ2分别检验模拟预测结果相对实际地震发生数Nobs是否“过少”和“过多”,公式为
|
(3) |
|
(4) |
对于N-test检验结果可使用有效显著性水平一般设定αeff=0.025下的单边检验进行解读,当δ1 < αeff时,表示预测地震数目过少;当δ2 < αeff时则表明预测的地震数目过多.
2 研究区和所用数据本研究所选区域为晋冀蒙交界地区,空间分布范围37.0°~41.0°N,110.0°~116.0°E.该地区处于山西断陷带和河套断陷带交汇部位,其形成的断陷盆地处于下降之中, 其中下降速度最快的是怀涿盆地和怀安盆地 (陈绍绪等, 2003).区域内构造活动强烈,主要的活动断裂包括怀安盆地北缘断裂、怀涿盆地北缘断裂、恒山北麓断裂、怀安盆地南缘断裂、太白山山前断裂、蔚-广盆地南缘断裂西段、延矾盆地北缘断裂、张家口断裂、五台山北麓断裂等.区域内历史上中强地震活跃,其中1970年以来先后发生了4级以上地震176次,5级以上地震23次,6级以上地震1次.受ETAS模型和瘦化算法对地震序列质量的要求,本研究中使用了晋冀蒙交界地区1980年以来的记录较好的4级以上地震序列,这些地震序列的主震震中空间分布如图 1所示.

|
图 1 晋冀蒙交界地区8个地震序列的空间分布图 红色实心圆代表了8个地震事件,圆圈的大小代表了地震震级的范围大小,底图的黑色曲线为活动断裂带. Figure 1 Seismicity distribution of eight earthquake sequence at the junction of Shanxi, Hebei and Inner Mongolia The red dots show the recorded eight earthquake events, the size of the circle represents the size of the earthquake magnitude, the black soild lines represent active faults. |
研究中使用了中国地震台网中心提供的《全国统一正式编目》地震目录全国地震编目①.为选定各地震序列事件,采用了区分地震序列与周围背景地震的时-空天然分布界限的“自然边界法”,即通过纬度-时间图、经度-时间图以及序列震中分布图相结合的方式,根据地震序列的时空分布选取地震序列用于研究.由于本文主要是讨论地震序列早期阶段的预测效能,并为确保避免地震序列随时间推移向周边的“弥散”效应,仅选取了时空上丛集性较强,且易与周围离散的背景地震可区分的时段.作为示例,图 2给出了对1999年山西阳高MS 5.6地震序列的选取结果.依照上述选取方法,还选取出了如下7个地震序列:1981年内蒙古丰镇MS 5.6、1989年山西大同MS 5.8、1990年河北赤城ML 5.0、1995年河北涿鹿ML 4.1、1999年山西浑源ML 4.6、1999年山西阳高MS 5.6、2002年河北宁晋ML 4.2地震序列.相应的主震事件的参数如表 1所示.

|
图 2 1999年11月1日山西阳高MS 5.6地震序列的选取 (a) 纬度-时间图;(b) 经度-时间图;(c) 震中分布图.图中黄色五角星代表主震,黑色点代表序列中各地震事件,灰色代表未作为序列事件的“背景地震”.(c) 中的虚线方框为所选序列的经纬度的范围,方框内的实线多边形所包围的地震事件为所要研究的地震事件. Figure 2 Selection of 1 November 1999 Yanggao, Shanxi, MS 5.6 earthquake sequence (a) Latitude-time plot; (b) Longitude-time plot; (c) Epicenter distribution plot. The yellow star represent the mainshock, the black dots represent events in the earthquake sequence, the gray represents "background earthquake" in the earthquake sequence. Dash lines show the selected sequence range of latitude and longitude in the figure (c), inside the box by a solid line polygon seismic events are useful earthquake events. |
|
|
表 1 研究中选取的冀蒙交界地区8个地震序列的主震参数和序列ETAS模型参数拟合值 Table 1 The eight mainshock earthquake sequence parameter and the ETAS model parameters fitted values in the research of selected at the junction of Shanxi, Hebei and Inner Mongolia |
① 系统,http://10.5.202.22/bianmu/index.jsp,查阅时间2015年8月16日。
由于强震发生后的短期内,常由于主震波形振幅较大、面波等波列持续时间较长,“淹没”了其后发生的大量震级较小的余震,造成余震区和周围地区地震监测能力的显著下降现象 (Iwata, 2008).为确保研究所用的8个地震序列的目录完整性,使用“震级-序号”法 (Huang, 2006; 蒋长胜和吴忠良, 2011; Zhuang et al., 2012) 来确定每个地震序列的完整性震级Mc.“震级-序号”法将地震序列按发生时间先后顺序进行排序,根据震级和序号的分布来判断Mc的时间变化.此外,还需同时设定ETAS模型拟合的起始时刻C0(时间单位为相对主震发震时刻的时间),选取足够多事件的余震序列.本研究所用的8个地震序列的震级-序号法确定Mc和C0的结果如图 3和表 1所示.

|
图 3 晋冀蒙地区8个地震序列的“震级-序号”法分析图 (a)~(f) 分别对应的地震事件依次为1981年8月13日内蒙古丰镇5.6级地震、1989年10月19日山西大同5.8级地震、1990年7月21日河北赤城5.0级地震、1991年3月26日山西大同5.8级地震、1995年7月20日河北涿鹿4.1级地震、1999年5月15日山西浑源4.6级地震、1999年11月1日山西阳高5.6级地震、2002年12月25日河北宁晋4.2级地震.其中每个图上的水平虚线和垂直虚线分别标出了Mc和C0的位置. Figure 3 Magnitude-rank distribution of eight earthquake sequences (a)~(f) represent 13 August 1981 Fengzhen, Inner Mongolia, M 5.8 earthquake; 19 October 1989 Datong, Shanxi, M 5.8 earthquake; 21 July 1990 Chicheng, Hebei, M 5.0 earthquake; 26 March 1991 Datong, Shanxi, M 5.8 earthquake; 20 July 1995 Zhuolu, Hebei, M 4.1 earthquake; 15 May 1999 Hunyuan, Shanxi, M 4.6 earthquake; 1 November 1999 Yanggao, Shanxi, M 5.6 earthquake; 25 December 2002 Ningjin, Hebei, M 4.2 earthquake; respectively. The horizontal dashed lines indicate the cutoff magnitude, Mc, while The vertical dashed lines indicate the starting time of ETAS model fitting, C0. |
对ETAS模型的参数一般通过最大似然法 (MLEs) 进行估计.在地震序列完整的时间段[tc, T](0 < tc < T) 内,似然函数L的形式为
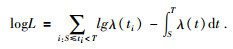
|
(5) |
将 (1) 式带入上式,即可对待估参数[μ, K, c, α, p]进行最大似然估计.
作为示例,图 4给出了1991年山西大同MS 5.8地震序列在Mc=ML 1.2情况下的ETAS模型参数结果,获得ETAS模型参数分别为μ=0.0000,K=0.0173,c=0.0035,α=1.4083和p=1.0664.为进一步考察ETAS模型的拟合效果,这里采用了常用的“残差分析”方法 (Ogata, 1988; Daley and Vere-Jones, 2003).“残差分析”方法可将复杂的地震序列{ti}转换为齐次泊松过程,并在“转换时间”域{τ}中进行拟合效果分析,相应的转换过程为

|
(6) |

|
图 4 ETAS模型对1991年山西大同MS 5.8地震序列ML 1.2以上地震的拟合情况的“残差分析” (a) 累积地震数 (蓝色实线) 与ETAS拟合曲线 (虚线) 在稳态泊松分布的“转换时间”(τ) 域的比较;(b)M-τ图. Figure 4 Comparison of the observed and modeled cumulative number of ML≥1.2 events of the 1991 Datong, Shanxi MS 5.8 earthquake sequence (a) Observation (deep blue curve) and ETAS formula (thick dashed line) in the transformed time (τ) domain which is according to the stationary Poisson process; (b) M-τ plot. |
这种经过转化的{τ}域的数据被称为“残差点过程”(RPP).如果与ETAS模型拟合较好,则转换后的RPP在{τ}上的累积频次就可表现为线性,与标准的稳态泊松过程理论直线较为接近 (Zhuang et al., 2012).图 4a给出了1991年山西大同MS 5.8地震序列的“残差分析”结果,从整体上看,ETAS模型对此地震序列的拟合较为理想.图 4b为相应的{τ}域的M-τ分布.
3.2 余震短期发生率预测和N-test检验结果在利用ETAS模型和“瘦化算法”进行的地震序列模拟和预测中,本文对每个地震序列的每次预测中,进行1000次的地震目录的随机模拟,从而生成相应时段的完整性震级以上的平均地震发生率.图 5a给出了1991年山西大同MS 5.8地震序列在序列持续时间t=15.0天 (相对于主震的发生时刻t=0时) 时的1000次模拟预测结果的统计分布.

|
图 5 1991年山西大同MS 5.8地震序列的短期发生率预测N-test统计检验示例 (a) 对未来1天的1000次瘦化算法预测结果的统计分布;(b) 对未来1天的地震发生率预测N-test检验δ1评分情况;(c) 对未来1天的地震发生率预测N-test检验δ2评分情况.上述结果均为序列持续时间t2=15.00天、C0=0.0225天、Mc=ML 1.2时的情况. Figure 5 N-test for the shorter forecasting results of the Datong, Shanxi, MS 5.8 earthquakeearthquake sequence in 1991 (a) Statistical distribution for the next-day forecasting results of the stochastic forecast results with 1000 samples simulation; (b) show the results of δ1 evaluation in N-test for the next-day forecasting results; (c) show the results of δ2 evaluation in N-test for the next-day forecasting results. All of the above results are the sequence duration time t2=15.00 days, C0=0.0225 days, Mc=ML 1.2. |
1991年山西大同MS 5.8地震序列未来1天余震短期发生率预测效能检验为例,图 5b和图 5c分别给出了未来1天地震发生率预测的N-test检验δ1评分和δ2评分结果.
4 余震短期发生率预测效能的系统性评估为系统性地考察ETAS模型和“瘦化算法”对晋冀蒙交界地区8个地震序列的预测效能,对每个地震序列采用了时间上连续、滑动预测的方式,考察在多次滑动预测中的整体预测评分情况.对于未来1天的余震发生率预测,自主震发生后的2.0天开始,以0.2天为滑动步长,连续滑动并每次生成1000个随时模拟目录.计算中截止震级Mc和拟合的起始时刻C0都与图 3的选取一致.晋冀蒙交界地区8个地震序列未来1天预测的N-test检验结果分别如图 6和表 2所示.由表 2的统计分析可见,对晋冀蒙交界地区的4级以上地震序列,ETAS模型和“瘦化算法”具备一定的余震发生率预测能力,其中预测“过少”的比例较低,8个地震序列在研究时段内均低于9%.而预测“过多”的比例较高,全部地震序列均超过了50%.

|
图 6 对晋冀蒙交界地区8个地震序列未来1天地震发生率预测结果的N-test统计检验 (a)~(h) 的地震序列与图 3一致.图中灰色垂线为δ1评分与δ2评分的连线,黑色菱形表示δ1 < 0.025的结果,蓝色方形表示δ2 < 0.025的结果.计算中每个序列选用了不同的截止震级和序列起始时刻. Figure 6 N-test for the next-day forecasting results of the eight earthquake sequence The earthquake events of (a)~(h) in compliance with figure 3. The vertical gray dashed lines connect the δ1 and δ2 values, the black diamonds show the results with δ1 < 0.025, blue squares show the results with δ2 < 0.025. Different cutoff magnitude and sequence starting time of ETAS model fitting are used in the calculation. |
|
|
表 2 未来1天余震短期发生率预测效能的检验分析 Table 2 N-test for the next-day forecasting results of the eight earthquake sequence |
为进一步考虑预测时间窗的长度是否会影响预测的效能,选取预测时间窗为3天,采用与1天预测时间窗相同的设置再次进行系统的预测和N-test检验,其检验结果及其分析结果分别如图 7和表 3所示.结果显示,通过增加预测时间窗长可显著降低预测“过少”的比例 (8个序列中均低于3%),但对预测“过多”的情况则无明显改善.

|
图 7 对晋冀蒙交界地区8个地震序列未来3天地震发生率预测结果的N-test统计检验 (a)~(h) 的地震序列与图 3一致.图中灰色垂线为δ1评分与δ2评分的连线,黑色菱形表示δ1 < 0.025的结果,蓝色方形表示δ2 < 0.025的结果.计算中每个序列选用了不同的截止震级和序列起始时刻,序列持续时间都以0.2天步长,自主震后2天开始进行预测. Figure 7 N-test for the 3-days forecasting results of the eight earthquake sequence The earthquake events of (a)~(h) in compliance with figure 3. The vertical gray dashed lines connect the δ1 and δ2 values, the black diamonds show the results with δ1 < 0.025, blue squares show the results with δ2 < 0.025. Different cutoff magnitude and sequence starting time of ETASmodel fitting are used in the calculation, and the duration time from 2.00 days to end by sliding with 0.20 steps |
|
|
表 3 未来3天余震短期发生率预测效能的检验分析 Table 3 N-test for the 3-days forecasting results of the eight earthquake sequence |
由于在强震发生后的早期阶段震源区持续发生剧烈的应力场调整变化,而矿物、流体和变形构造的特性也显著影响断层的愈合行为 (Hickman et al., 1995; Ohtani et al., 2000; Ma et al., 2006),因此,尽管ETAS模型作为公认的模拟真实地震序列较好的模型,但对复杂的地震序列的模拟仍有其理论上的局限,仍可出现预测“失效”的情况.在对2014年云南鲁甸6.5级地震的余震短期发生率预测效能连续评估中,蒋长胜等 (2015)发现,未来1天的余震短期发生率预测中有12%的情况可出现预测失效,而对未来3天的预测中失效的比例为6%.通过与2014年云南鲁甸6.5级地震的余震发生率预测效能相比,ETAS模型和“瘦化算法”在晋冀蒙交界地区的预测效能明显偏低,尤其是预测“过多”的情况较为普遍.
为进一步讨论晋冀蒙交界地区的ETAS模型和“瘦化算法”预测效能,这里给出了8个地震序列随时间累积的预测次数“有效率”的变化,结果如图 8所示.图 8结果表明,尽管8个地震序列的序列持续时间各不相同,整体上来看,累积的预测有效率随序列持续时间的增加呈现下降趋势,但在序列的早期阶段,主震发生后的12天之内,4个地震序列的累积预测有效率可达60%以上,全部地震序列的平均累积预测有效率也可达60%以上.其中预测效能较好的地震序列为1991年山西大同5.8级地震,累积预测有效率在震后60天均可超过60%,而1995年河北涿鹿ML 4.1地震序列则在震后各个时段的预测有效率一直较低.

|
图 8 晋冀蒙交界地区8个地震序列的累积预测有效率随时间的变化.不同颜色的实线代表了8个地震序列有效率的变化,垂直的黑色虚线对应的是持续时间为t=12天 Figure 8 The cumulative prediction of the 8 earthquake sequences with time variation at the junction of Shanxi, Hebei and Inner Mongolia. Different colors of the solid lines represent the efficiency of 8 earthquake sequence variation and vertical black dotted line corresponds to the duration time t=12 days |
上述的分析是同时考虑δ1和δ2两个评分变量,也就是预测“过少”和“过多”两种情况.如果降低预测目标,仅考虑避免预测“过少”的底线预测策略,ETAS模型和“瘦化算法”在晋冀蒙交界地区则可完全适用.
ETAS模型的理论基础源自“点分支过程”(point branch process) 理论和考虑对高阶余震的激发,由此,对于晋冀蒙交界地区短期地震发生率总体上的预测效果偏低的原因,或可从表示高阶余震激发能力的ETAS模型参数α上寻找.对于8个地震序列,因在主震后6.2天以后才出现预测失效现象,本文就选取震后早期阶段的7~12天的1天预测时间窗的情况进行研究.图 9给出了相应的累积预测有效率与参数α的关系图,由图可见,随α值的增大即高阶余震激发能力的降低,累积的预测有效率与其存在线性的负相关关系.由此表明,高阶余震激发能力偏弱,可能是晋冀蒙交界地区ETAS模型和“瘦化算法”预测效能偏低的原因之一.

|
图 9 晋冀蒙交界地区8个地震序列累积的预测有效率与地震事件早期参数α的关系图.其中选取了震后早期阶段5~12天的变化,不同颜色的线条代表了序列的持续时间,不同形状的点代表了不同的地震事件 Figure 9 The relationship between the forecasting efficiency and the early earthquake parameter α at the junction of Shanxi, Hebei and Inner Mongolia.Selecting the change of 5~12 days in the early stage after the earthquake, the lines of different colors represent the duration of the sequence, and the points of different shapes represent different earthquake events |
为系统地考察晋冀蒙交界地区ETAS模型和“瘦化算法”对余震短期发生率预测的效能,并构建适合该区域地震活动特点的预测策略,本研究采用自然边界法筛选出该地区1980年以来的8个地震序列,利用ETAS模型和“瘦化算法”进行了余震发生率的连续预测,以及N-test检验方法的预测效能评估.获得了以下主要认识:
(1) ETAS模型和“瘦化算法”对晋冀蒙交界地区的余震短期发生率具有一定预测能力,但总体预测效能偏低.对于未来1天的预测,其中预测“过少”的比例较小、均低于9%;而预测“过多”的比例较高,研究所用的全部地震序列均超过50%.随着序列的持续发展,预测效能持续下降,但在主震发生后的早期阶段 (例如震后12天以内) 仍有较好的预测能力.
(2) 晋冀蒙交界地区利用ETAS模型和“瘦化算法”的余震短期发生率预测,适度增加预测时间窗长可进一步改善预测“过少”的情况,但对预测“过多”的情况改善不明显.
(3) 通过与ETAS模型参数α的对比研究,高阶余震激发能力偏弱,可能是晋冀蒙交界地区ETAS模型和“瘦化算法”预测效能偏低的原因之一.
(4) 作为ETAS模型和“瘦化算法”晋冀蒙交界地区的余震短期发生率预测的策略,一个可能的办法是,采用3天的预测时间窗、仅对主震发生后的早期阶段余震发生率进行预测.此外,考虑避免预测“过少”的底线预测,ETAS模型和“瘦化算法”的预测结果对晋冀蒙交界地区的余震短期发生率预测也有现实意义.
6.2晋冀蒙交界地区自20世纪90年代以来,先后20余次被划入中国地震局年度重点地震危险区,该地区中强地震的危险性以及地震的可预测属性始终得到高度关注.在利用ETAS模型开展的余震短期发生率预测和效能评价过程中,目前给出的具有预测能力、总体效能偏低、高阶余震激发能力弱是主因的评价结果,以及适度增加预测时间窗长的预测策略可能对晋冀蒙交界地区科学开展余震短期发生率预测和提高区域危险性分析应对能力有所帮助.然而,由于本研究仅仅是ETAS模型的单独方法研究,参照CSEP计划的多模型“竞技”的研究方式,仍需要将更多的潜在地震预测模型在该地区进一步检验,以及开展比较研究.鉴于此,本文的单一预测模型评价结果仅能反映该地区地震可预测能力的侧面.
致谢 本文属中国地震局“云南鲁甸’8·3’6.5级地震系统性科学考察”经费项目和“晋冀蒙交界地区强震短临跟踪合作研究”(“三省一所一校”合作研究) 工作.“国际地震可预测性合作研究”(CSEP) 计划中国检验中心筹备组对本研究给予了指导.研究中使用了中国地震台网中心“全国地震编目系统”提供的“统一正式目录”,日本统计数理研究所庄建仓教授在访问地球物理研究所期间编制、提供了ETAS模型和余震短期概率预测程序,尹凤玲博士、来贵娟博士、硕士研究生王亚文参与了讨论,在此一并表示感谢.| [] | Chen S X, Zhang Y G, Qiao Z Y, et al. 2003. The current activity of main faults in the joint area of Shanxi, Hebei and Inner Mongolia[J]. North China Earthquake Sciences , 21(2): 16–22. |
| [] | Console R, Rhoades D A, Murru M, et al. 2006. Comparative performance of time-invariant, long-range and short-range forecasting models on the earthquake catalogue of Greece[J]. Journal of Geophysical Research, 111(B9): B09304. DOI:10.1029/2005JB004113 |
| [] | Daley D D, Vere-Jones D. 2003. An Introduction to the Theory of Point Processes-Volume I:Elementary Theory and Methods[M]. 2nd ed. New York: Springer: 17-33. |
| [] | Falcone G, Console R, Murru M. 2010. Short-term and long-term earthquake occurrence models for Italy:ETES, ERS and LTST[J]. Annals of Geophysics, 53(3): 41–50. DOI:10.4401/ag-4760 |
| [] | Gerstenberger M, Wiemer S, Jones L. 2004. Real-time forecasts of tomorrow's earthquakes in California:A new mapping tool[R]. Open-File Report 2004-1390.U.S. Geological Survey. |
| [] | Gerstenberger M C, Wiemer S, Jones L M, et al. 2005. Real-time forecasts of tomorrow's earthquakes in California[J]. Nature, 435(7040): 328–331. DOI:10.1038/nature03622 |
| [] | Helmstetter A, Kagan Y Y, Jackson D D. 2006. Comparison of short-term and Time-Independent earthquake forecast models for southern California[J]. Bulletin of the Seismological Society of America, 96(1): 90–106. DOI:10.1785/0120050067 |
| [] | Hickman S, Sibson R, Bruhn R. 1995. Introduction to special section:Mechanical involvement of fluids in faulting[J]. Journal of Geophysical Research, 100(B7): 12831–12840. DOI:10.1029/95JB01121 |
| [] | Huang Q H. 2006. Search for reliable precursors:A case study of the seismic quiescence of the 2000 western Tottori prefecture earthquake[J]. Journal of Geophysical Research, 111(B4): B04301. DOI:10.1029/2005JB003982 |
| [] | Iwata T. 2008. Low detection capability of global earthquakes after the occurrence of large earthquakes:Investigation of the Harvard CMT catalogue[J]. Geophysical Journal International, 174(3): 849–856. DOI:10.1111/gji.2008.174.issue-3 |
| [] | Jiang C S, Wu Z L. 2011. Intermediate-term medium-range accelerating moment release (AMR) priori to the 2010 YushuMS 7.1 earthquake[J]. Chinese Journal of Geophysics , 54(6): 1501–1510. DOI:10.3969/j.issn.0001-5733.2011.06.009 |
| [] | Jiang C S, Wu Z L, Yin F L, et al. 2015. Stability of early-estimation sequence parameters for continuous forecast of the aftershock rate:A case study of the 2014 Ludian, Yunnan MS 6.5 earthquake[J]. Chinese Journal of Geophysics , 58(11): 4163–4173. DOI:10.6038/cjg20151123 |
| [] | Jordan T H. 2006. Earthquake predictability, brick by brick[J]. Seismological Research Letters, 77(1): 3–6. DOI:10.1785/gssrl.77.1.3 |
| [] | Kagan Y Y, Jackson D D. 1995. New seismic gap hypothesis:Five years after[J]. Journal of Geophysical Research, 100(B3): 3934–3959. |
| [] | Lewis P A W, Shedler G S. 1979. Simulation of nonhomogeneous Poisson processes by thinning[J]. Naval Research Logistics Quarterly, 26(3): 403–413. DOI:10.1002/(ISSN)1931-9193 |
| [] | Ma K F, Tanaka H, Song S R, et al. 2006. Slip zone and energetics of a large earthquake from the Taiwan Chelungpu-fault drilling project[J]. Nature, 444(7118): 473–476. DOI:10.1038/nature05253 |
| [] | Ogata Y. 1981. On Lewis' simulation method for point processes[J]. IEEE Transactions on Information Theory, 27(1): 23–31. DOI:10.1109/TIT.1981.1056305 |
| [] | Ogata Y. 1988. Statistical models for earthquake occurrences and residual analysis for point processes[J]. Journal of the American Statistical Association, 83(401): 9–27. DOI:10.1080/01621459.1988.10478560 |
| [] | Ogata Y. 1989. Statistical model for standard seismicity and detection of anomalies by residual analysis[J]. Tectonophysics, 169(1-3): 159–174. DOI:10.1016/0040-1951(89)90191-1 |
| [] | Ogata Y. 1992. Detection of precursory relative quiescence before great earthquakes through a statistical model[J]. Journal of Geophysical Research, 97(B13): 19845–19871. DOI:10.1029/92JB00708 |
| [] | Ogata Y. 2001. Increased probability of large earthquakes near aftershock regions with relative quiescence[J]. Journal of Geophysical Research, 106(B5): 8729–8744. DOI:10.1029/2000JB900400 |
| [] | Ohtani T, Fujimoto K, Ito H, et al. 2000. Fault rocks and past to recent fluid characteristics from the borehole survey of the Nojima fault ruptured in the 1995 Kobe earthquake, southwest Japan[J]. Journal of Geophysical Research, 105(B7): 16161–16171. DOI:10.1029/2000JB900086 |
| [] | Omori F. 1894. On the aftershocks of earthquakes[J]. Journal of the College of Science, Imperial University of Tokyo, 7: 111–200. |
| [] | Reasenberg P A, Jones L M. 1989. Earthquake hazard after a mainshock in California[J]. Science, 243(4895): 1173–1176. DOI:10.1126/science.243.4895.1173 |
| [] | Rhoades D A. 2007. Application of the EEPAS model to forecasting earthquakes of moderate magnitude in southern California[J]. Seismological Research Letters, 78(1): 110–115. DOI:10.1785/gssrl.78.1.110 |
| [] | Rhoades D A, Evison F F. 2004. Long-range earthquake forecasting with every earthquake a precursor according to scale[J]. Pure and Applied Geophysics, 161(1): 47–72. DOI:10.1007/s00024-003-2434-9 |
| [] | Rhoades D A, Evison F F. 2005. Test of the EEPAS forecasting model on the Japan earthquake catalogue[J]. Pure and Applied Geophysics, 162(6-7): 1271–1290. DOI:10.1007/s00024-004-2669-0 |
| [] | Rhoades D A, Evison F F. 2006. The EEPAS forecasting model and the probability of moderate-to-large earthquakes in central Japan[J]. Tectonophysics, 417(1-2): 119–130. DOI:10.1016/j.tecto.2005.05.051 |
| [] | Schorlemmer D, Gerstenberger M C, Wiemer S, et al. 2007. Earthquake likelihood model testing[J]. Seismological Research Letters, 78(1): 17–29. DOI:10.1785/gssrl.78.1.17 |
| [] | Schorlemmer D, Zechar J D, Werner M J, et al. 2010. First results of the regional earthquake likelihood models experiment[J]. Pure and Applied Geophysics, 167(8-9): 859–876. DOI:10.1007/s00024-010-0081-5 |
| [] | Steacy S, Gerstenberger M, Williams C, et al. 2014. A new hybrid Coulomb/statistical model for forecasting aftershock rates[J]. Geophysical Journal International, 196(2): 918–923. DOI:10.1093/gji/ggt404 |
| [] | Utsu T. 1961. A statistical study on the occurrence of aftershocks[J]. Geophysical Magazine, 30: 521–605. |
| [] | Werner M J, Helmstetter A, Jackson D D, et al. 2011. High-resolution long-term and short-term earthquake forecasts for California[J]. Bulletin of the Seismological Society of America, 101(4): 1630–1648. DOI:10.1785/0120090340 |
| [] | Zechar J D. 2010. Evaluating Earthquake Predictions and Earthquake Forecasts:A Guide for Students and New Researchers[M/OL]. Community Online Resource for Statistical Seismicity Analysis, doi:10.5078/corssa-77337879. |
| [] | Zhuang J C. 2011. Next-day earthquake forecasts for the Japan region generated by the ETAS model[J]. Earth, Planets and Space, 63(3): 207–216. DOI:10.5047/eps.2010.12.010 |
| [] | Zhuang J C, Harte D, Werner M J, et al. 2012. Basic Models of Seismicity:Temporal Models[M/OL]. Community Online Resource for Statistical Seismicity Analysis, doi:10.5078/corssa-79905851. |
| [] | 陈绍绪, 张跃刚, 乔子云, 等. 2003. 晋冀蒙交界地区主要断裂的现今活动[J]. 华北地震科学, 21(2): 16–22. |
| [] | 蒋长胜, 吴忠良. 2011. 2010年玉树MS 7.1地震前的中长期加速矩释放 (AMR) 问题[J]. 地球物理学报, 54(6): 1501–1510. DOI:10.3969/j.issn.0001-5733.2011.06.009 |
| [] | 蒋长胜, 吴忠良, 尹凤玲, 等. 2015. 余震的序列参数稳定性和余震短期发生率预测效能的连续评估——以2014年云南鲁甸6.5级地震为例[J]. 地球物理学报, 58(11): 4163–4173. DOI:10.6038/cjg20151123 |