 2016, Vol. 31


2. 南方科技大学海洋科学与工程系, 深圳 518055
2. School of Oceanography, South University of Science and Technology of China, Shenzhen 518055, China
剪切波在穿过各向异性介质时会产生偏振方向垂直,速度不同的两个剪切波,称为剪切波分裂现象,一般用快波偏振方向φ和快慢波时间延迟δt来表示.剪切波分裂方法具有计算简单、水平分辨率好等特点(Fouch and Rondenay,2006),被广泛应用于研究俯冲带(Long,2013; Lynner and Long,2014)、大洋中脊(Nippress et al.,2007)以及大陆内部(Silver,1996; Liu et al.,2014)的各向异性分布.SKS波因具有初始偏振方向已知、近垂直入射、震源侧各向异性可以忽略等优点,成为剪切波分裂方法的理想震相之一(Silver and Chan,1991).近些年来,SKS波分裂方法被广泛地应用于研究中国大陆以及构造运动活跃的地区(罗艳等,2004; Wang et al.,2013; 王琼等,2013; 张洪双等,2013; 王椿镛等,2014; 常利军等,2015).
SKS波分裂已经成为处理地震资料的常用方法之一.随着地震观测技术的迅速发展,地震资料数量的急剧增大,人工挑选和计算SKS波分裂会耗费大量的时间和精力.本文提出了一套自动计算SKS波分裂的方法和流程,在得到准确、可信的结果的同时节省了宝贵的时间.
1 计算方法 1.1 SKS波的识别相比于地震波初至P波或S波,SKS波振幅明显、周期长,而且SKS波分裂方法不要求精确的SKS波到时.本方法利用Earle和Shearer(1994)提出的改进STA/LTA方法判断地震事件中是否存在清晰的SKS波震相.具体过程如下:
1) 截取SKS波理论到时前后100 s的波形(图 1a),并利用E(t)=

|
图 1 STA/LTA波形图 (a)经过0.05~0.5 Hz滤波后的SKS波理论到时前后100 s的径向波形,零点为SKS波的理论到时,并用红色虚线标注;(b)径向地震波形的包络函数(EF);(c)长短时比值函数(RF);(d)汉宁窗平滑后的长短时比值函数(SRF),其中红色虚线标注了阈值和符合要求的超过阈值点所对应的时间. Figure 1 The waveforms of STA/LTA method (a)The radial component waveform containing 100 s before and after the theoretical arrival time of SKS wave,which is marked by the red dashed line;(b)The envelope function of the radial component seismograph;(c)The STA/LTA ratio function;(d)The STA/LTA function filtered by Hanning window is showed,and the red dashed line indicates the threshold and the time when exceeds it. |
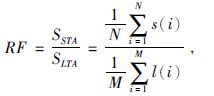
2) 选取适当的长短时窗口长度,计算长短时比值函数RF(图 1c),即
|
其中,s(i),i=1,2,3,…,N表示短时间窗数据,l(i),i=1,2,3,…,M表示长时间窗数据,N和M分别表示长短时间窗内的采样点个数.
3) 选择适当长度的汉宁窗对长短时比值函数RF进行滤波,得到平滑的长短时比值函数(SRF).选取适当的阈值,当SRF超过阈值时,认为存在清晰的SKS波(图 1d).为了确保得到的震相为SKS波,超过阈值的时间点必须在SKS波理论到时前后10 s范围以内.
STA/LTA方法中所使用的参数是在Earle和Shearer(1994)文章中提到的长周期地震波的参数基础之上修改得到.其中,STA的窗口长度既要足以分辨清晰的震相,又不能太短;而LTA窗口的长度需要能够体现噪声的平均水平.考虑到SKS波的主要周期在8~12 s之间,本研究所选取的参数如表 1.所示.
|
|
表 1 STA/LTA 参数表 Table 1 Parameters of STA/LTA method |
SKS波时间窗的选取对于剪切波分裂参数的计算结果具有一定的影响,当SKS波信噪比比较低的时候影响更为明显.因此,时间窗的正确选取对于SKS波分裂的计算非常重要.SKS波时间窗既要包含SKS波的主要部分,又要避免引入其他震相和噪声的干扰.
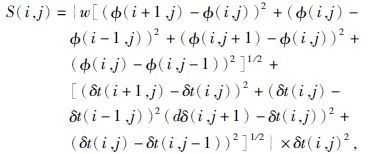
在常规手动选取SKS波时间窗时可以直观地确定窗口的范围,但是也经常需要多次尝试.简单地根据剪切波分裂参数的误差大小来自动确定时间窗并不稳定,截取的时间窗甚至可能是错误的.Teanby等(2004)提出聚类分析法,根据计算结果的误差值和方差选取最优的时间窗.本方法则利用时间窗滑动时剪切波分裂参数结果的稳定性作为标准选取最优时间窗,计算过程简单,并且得到的结果稳定、可信.S为计算结果的稳定性,可以表示为
|
其中,φ为快波偏振方向,δt为快慢波时间延迟,i和j分别表示时间窗的起点和终点位置,w为快波偏振方向和快慢波时间延迟的权重.考虑到快波偏振方向φ的误差精确到小数点后1位,快慢波时间延迟δt的误差精确到小数点后2位,为了保证S对两者均有一定的敏感性,取w=0.01.在式子最后乘上δt2主要是考虑当两组不同的时间窗口得到相同的S值时,选取快慢波时间延迟较小的结果.取S最小的窗口作为最优的SKS波时间窗.当搜索的时间步长比较小时,可以利用周围更多点的结果来计算S.
1.3 滤波范围的选择在识别SKS波震相时,滤波的频率范围为0.05~0.5 Hz,但是在计算SKS波分裂时,滤波频率的选择往往对最终的结果有一定的影响.因此,为了使滤波后的波形既包含SKS波的主要能量,又能够减少噪声的干扰,本研究根据各个波形的主频范围选择滤波范围.首先,利用时频分析方法(Prosser et al.,1999)确定SKS波主要能量的频带范围(图 2.).当SKS波主要能量的最大主频率大于0.15 Hz时,在0.1~0.5 Hz频带范围内进行滤波;当最大主频率小于0.15 Hz且大于0.05 Hz时,在0.04~0.4 Hz频带范围内进行滤波;当最大主频率小于0.05 Hz时,在0.01~0.3 Hz频带范围内进行滤波.

|
图 2 时频分析图 (a)SKS波理论到时附近径向波形,零点为SKS波的理论到时,并用红色虚线标注;(b)时频分析结果,最大主频率为0.126 Hz. Figure 2 The picture of time-frequency analysis (a)The radial component waveform of SKS wave is showed,and the theoretical arrival time is marked by red dashed line;(b)The result of time-frequency analysis with the main frequency equaling 0.126 Hz. |
剪切波分裂参数的主要计算方法有互相关法(Ando,1984)、切向能量最小法、本征值法(Silver and Chan,1991)以及Multichannel法(Chevrot,2000)等.Multichannel法要求计算结果有比较好的方位角覆盖.互相关法计算简单,但是当地震资料水平向方向有误时会造成很大误差(Tian et al.,2011).切向能量最小法可以认为是本征值法在分裂前偏振方向已知时的特殊情况.本方法选用本征值法.定义相关矩阵c为

|
其中,cij(φ,δt)=∫-∞∞ui(t)uj(t-δt)dt.λ1和λ2分别为互相关矩阵c的最大和最小本征值.当λ2最小值所对应的φ和δt为快波分裂方向和快慢波时间延迟(图 3.).

|
图 3 SD09台站记录的发生于2014年2月2日9时26分37秒地震的SKS波分裂结果 (a)蓝色虚线和红色实线分别为矫正前和矫正后的质点运动轨迹,横纵坐标分别表示径向和切向;(b)最小特征值等值线图,横纵坐标分别表示快慢波时间延迟和快波偏振方向,两条蓝线的交点为最优解(φ=81°,δt=0.75 s),灰色区域为误差;(c)蓝色虚线和红色实线分别为矫正后的径向和切向SKS波波形;(d)蓝色虚线和红色实线分别为矫正后并做振幅归一化的快波和慢波波形. Figure 3 SKS wave splitting result of the event happened on 2014/2/2 9:26:37 recorded by SD09 (a)The blue dashed line and the red solid line are tracks of particle movement before and after the correction,and the lateral axis and vertical axis are radial and transversal direction respectively;(b)Contour map of the minimum eigenvalue. The lateral axis and vertical axis are the delay time and the fast polarization direction respectively. The interaction of the two blue lines is the optimum result(φ=81°,δt=0.75 s)and the grey area is the uncertainty zone;(c)The blue dashed line and the red solid line are corrected SKS waveforms in the radial and transversal component respectively;(d)The blue dashed line and the red solid line are corrected and amplitude normalized fast and slow waveform. |
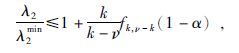
对于α置信水平,λ2真值满足下列关系(Silver and Chan,1991)
|
其中,f为置信水平为α的F分布函数,取k=2,α=0.05.ν与时间窗长度相等.λ2的边界值对应的φ和δt为结果置信区间的上下限.该部分程序引用 Splitlab(Wüstefeld et al.,2008)中的部分算法
1.5 Null值的判断当快波偏振方向与事件后方位角平行或垂直时,或快慢波时间延迟为0 s时,虽然能够观测到明显的SKS波,但是无法观测到剪切波分裂现象,该结果称为Null值.本方法中,利用互相关函数法计算快慢波时间延迟,如果得到的δt<0.05 s,则认为该结果为Null值.Null值可以用来辅助判断台站下方快波偏振方向.
1.6 结果的初步筛选利用SKS波在穿过核幔边界的偏振方向已知及快慢波的互相关性好的特点,对计算结果进行自动筛选.结果需满足矫正后的偏振方向与事件后方位角方向的夹角小于45°,矫正后快慢波的互相关系数大于0.9.但该条件并不能保证所有结果都是可信的,因此可能需要对计算结果进行人工筛选,剔除出异常结果.
2 实例计算SKS波分裂自动计算的流程图如图 4.北京大学分别于2011年7月至2012年7月和2013年7月至2014年7月在山东半岛布设了两条宽频带流动地震观测台阵,共20个台站(图 5a).利用该方法对其中SD09台站进行SKS波分裂计算(图 5b-c).计算得到的快波偏振方向φ=-79°±14°,快慢波时间延迟 δt=0.71s±0.17s,与利用Splitlab程序人工计算得到的结果基本一致.

|
图 4 SKS波分裂自动计算流程图 Figure 4 The flow chart of automatic SKS splitting analysis |

|
图 5 (a)宽频带流动地震观测台阵分布图,其中蓝色三角为本文所计算的台站,编号为SD09;(b)SKS剪切波分裂结果后方位角和震中距的分布,一共有4个有效的结果;SD09台站SKS波分裂时间延迟以及测量误差随后方位角方向的分布;(b)SD09台站SKS波分裂快波偏振方向以及测量误差随后方位角方向的分布 Figure 5 (a) The chart shows locations of the broadband portable seismic stations;(b)The back-azimuth and epicetral distance distribution of SKS splitting result of SD09 is showed;(c)Delay times and measurement uncertainties of SD09 versus the back azimuth;(d)Fast polarization directions and measurement uncertainties of SD09 versus the back azimuth |
此外,本程序已应用于对北京大学在华北克拉通中部过渡带布设的流动地震台以及阿尔金断裂带附近的一维流动地震观测剖面的SKS波分裂进行了研究,均取得了非常好的结果(于勇等,2016; 冯永革等,2016)(如图 6).

|
图 6 华北克拉通中部过渡带SKS波分裂结果图(于勇等,2016) Figure 6 The SKS wave splitting result in the central part of the North China Craton(Yu et al.,2016) |
剪切波分裂是研究地球内部各向异性的重要手段之一.本方法利用时频分析方法确定滤波范围,并根据滑动时间窗时结果的稳定性比较准确的选取了SKS波时间窗,确保了结果稳定性和可信度,实现了对SKS波分裂的自动计算,一定程度上节省了人工拾取、计算SKS波分裂的时间.
致谢 感谢参加北京大学流动台阵野外工作的全体师生所付出的辛勤劳动,感谢审稿专家提出的修改意见.本文的研究获得了国家高技术研究发展计划(863)(2009AA093401-05)和国家自然科学基金委(91128210;90814002)资助.| [1] | Ando M.1984. ScS Polarization anisotropy around the Pacific Ocean[J]. Journal of Physics of the Earth, 32 (3) : 179–195. DOI:10.4294/jpe1952.32.179 |
| [2] | Chang L J, Ding Z F, Wang C Y.2015. Upper mantle anisotropy beneath the southern segment of North-South tectonic belt, China[J]. Chinese J. Geophys. (in Chinese), 58 (11) : 4052–4067. DOI:10.6038/cjg20151114 |
| [3] | Chevrot S.2000. Multichannel analysis of shear wave splitting[J]. Journal of Geophysical Research: Solid Earth, 105 (B9) : 21579–21590. DOI:10.1029/2000JB900199 |
| [4] | Earle P S, Shearer P M.1994. Characterization of global seismograms using an automatic-picking algorithm[J]. Bulletin of the Seismological Society of America, 84 (2) : 366–376. |
| [5] | Feng Y G, Yu Y, Chen Y S, et al.2016. Upper mantle anisotropy analysis around the western Altun Tagh fault[J]. Chinese J. Geophys. (in Chinese), 59 (5) : 1629–1636. DOI:10.6038/cjg20160508 |
| [6] | Fouch M J, Rondenay S.2006. Seismic anisotropy beneath stable continental interiors[J]. Physics of the Earth and Planetary Interiors, 158 (2-4) : 292–320. DOI:10.1016/j.pepi.2006.03.024 |
| [7] | Liu K H, Elsheikh A, Lemnifi A, et al.2014. A uniform database of teleseismic shear wave splitting measurements for the western and central United States[J]. Geochemistry, Geophysics, Geosystems, 15 (5) : 2075–2085. DOI:10.1002/2014GC005267 |
| [8] | Long M D.2013. Constraints on subduction geodynamics from seismic anisotropy[J]. Reviews of Geophysics, 51 (1) : 76–112. DOI:10.1002/(ISSN)1944-9208 |
| [9] | Luo Y, Huang Z X, Peng Y J, et al.2004. A study on SKS wave splitting beneath the china mainland and adjacent regions[J]. Chinese J. Geophys. (in Chinese), 47 (5) : 812–821. DOI:10.3321/j.issn:0001-5733.2004.05.012 |
| [10] | Lynner C, Long M D.2014. Sub-slab anisotropy beneath the Sumatra and circum-Pacific subduction zones from source-side shear wave splitting observations[J]. Geochemistry, Geophysics, Geosystems, 15 (6) : 2262–2281. DOI:10.1002/2014GC005239 |
| [11] | Nippress S E J, Kusznir N J, Kendall J M.2007. LPO predicted seismic anisotropy beneath a simple model of a mid-ocean ridge[J]. Geophysical Research Letters, 34 (14) . DOI:10.1029/2006GL029040 |
| [12] | Prosser W H, Seale M D, Smith B T.1999. Time-frequency analysis of the dispersion of Lamb modes[J]. The Journal of the Acoustical Society of America, 105 (5) : 2669–2676. DOI:10.1121/1.426883 |
| [13] | Silver P G.1996. Seismic anisotropy beneath the continents: Probing the depths of geology[J]. Annual Review of Earth and Planetary Sciences, 24 : 385–432. DOI:10.1146/annurev.earth.24.1.385 |
| [14] | Silver P G, Chan W W.1991. Shear wave splitting and subcontinental mantle deformation[J]. Journal of Geophysical Research: Solid Earth, 96 (B10) : 16429–16454. DOI:10.1029/91JB00899 |
| [15] | Teanby N A, Kendall J M, Van Der Baan M.2004. Automation of shear-wave splitting measurements using cluster analysis[J]. Bulletin of the Seismological Society of America, 94 (2) : 453–463. DOI:10.1785/0120030123 |
| [16] | Tian X B, Zhang J L, Si S K, et al.2011. SKS splitting measurements with horizontal component misalignment[J]. Geophysical Journal International, 185 (1) : 329–340. DOI:10.1111/gji.2011.185.issue-1 |
| [17] | Wang C Y, Chang L J, Ding Z F, et al.2014. Upper mantle anisotropy and crust-mantle deformation pattern beneath the Chinese mainland[J]. Sci China Earth Sci, 57 (1) : 132–143. DOI:10.1007/s11430-013-4675-5 |
| [18] | Wang C Y, Flesch L M, Chang L J, et al.2013. Evidence of active mantle flow beneath South China[J]. Geophysical Research Letters, 40 (19) : 5137–5141. DOI:10.1002/grl.50987 |
| [19] | Wang Q, Gao Y, Shi Y T, et al.2013. Seismic anisotropy in the uppermost mantle beneath the northeastern margin of Qinghai-Tibet plateau: Evidence from shear wave splitting of SKS, PKS and SKKS[J]. Chinese J. Geophys. (in Chinese), 56 (3) : 892–905. DOI:10.6038/cjg20130318 |
| [20] | Wüstefeld A, Bokelmann G, Zaroli C, et al.2008. SplitLab: A shear-wave splitting environment in Matlab[J]. Computers & Geosciences, 34 (5) : 515–528. |
| [21] | Yu Y, Chen Y S, Jian H C, et al.2016. SKS wave splitting study of the transition zone at the central portion of the North China Craton[J]. Chinese J. Geophys. (in Chinese), 59 (1) : 141–151. DOI:10.6038/cjg20160111 |
| [22] | Zhang H S, Teng J W, Tian X B, et al.2013. Lithospheric thickness and upper mantle anisotropy beneath the northeastern Tibetan Plateau[J]. Chinese J. Geophys. (in Chinese), 56 (2) : 459–471. DOI:10.6038/cjg20130210 |
| [23] | 常利军, 丁志峰, 王椿镛.2015. 南北构造带南段上地幔各向异性特征[J]. 地球物理学报, 58 (11) : 4052–4067. DOI:10.6038/cjg20151114 |
| [24] | 冯永革, 于勇, 陈永顺, 等.2016. 阿尔金断裂西部邻区的上地幔各向异性研究[J]. 地球物理学报, 59 (5) : 1629–1636. DOI:10.6038/cjg20160508 |
| [25] | 罗艳, 黄忠贤, 彭艳菊, 等.2004. 中国大陆及邻区SKS波分裂研究[J]. 地球物理学报, 47 (5) : 812–821. DOI:10.3321/j.issn:0001-5733.2004.05.012 |
| [26] | 王椿镛, 常利军, 丁志峰, 等.2014. 中国大陆上地幔各向异性和壳幔变形模式[J]. 中国科学: 地球科学, 44 (1) : 98–110. |
| [27] | 王琼, 高原, 石玉涛, 等.2013. 青藏高原东北缘上地幔地震各向异性: 来自SKS、PKS和SKKS震相分裂的证据[J]. 地球物理学报, 56 (3) : 892–905. DOI:10.6038/cjg20130318 |
| [28] | 于勇, 陈永顺, 菅汉超, 等.2016. 华北克拉通中部过渡带SKS波分裂研究: 鄂尔多斯东南角的局部软流圈绕流[J]. 地球物理学报, 59 (1) : 141–151. DOI:10.6038/cjg20160111 |
| [29] | 张洪双, 滕吉文, 田小波, 等.2013. 青藏高原东北缘岩石圈厚度与上地幔各向异性[J]. 地球物理学报, 56 (2) : 459–471. DOI:10.6038/cjg20130210 |