 2015, Vol. 30


重磁全张量探测技术是一种新兴的地球物理勘探手段(Jekeli,1993; Bell et al., 1997; Schmidt and Clark, 2000),其以信息量大、精度高、干扰小等优点在地球物理领域中得到广泛重视(Gamey et al., 2004; Doll et al., 2006).全张量测量能提供地质体在不同方向上的导数反映,能更准确地描述地质体的特征,最近已在国外开展测量工作.Vinton dome为美国路易斯安娜州典型的盐丘构造,人们在该地区进行了大量的地球探测,主要包括地震及重力测量,但是由于地震探测手段对于盐丘构造的分辨率较低,无法准确地给出盐丘的构造特征.为此人们采用重力异常与地震数据联合反演来确定地震无法识别区域的地层分布特征.Bell Geospace公司于2010-2011年对全张量重力测量仪器进行了改装,其实验室精度达到1E,并于2011-2012年在该地区进行了改装后的首次全张量重力测量,数据测量精度为3.46E.现今针对张量重力数据的解释方法大多是用于确定地质体的深度和产状信息(Zhang et al., 2000; Schmidt and Clark, 2006; Valentin et al., 2007; Beiki,2010; Oru,2010a,2010b; 吴星等,2011; Beiki et al., 2011; 马国庆等,2012),与地震数据联合界面反演未有相关的应用.本文推导出张量重力异常与界面起伏的对应关系,并利用美国墨西哥湾的Vinton地区的实测张量重力异常来辅助地震数据确定盐丘的界面位置.此外,我们还利用张量重力异常的密度反演获得了地下盐丘的具体位置,与界面反演结果吻合较好.
1 全张量重力异常的Parker-Oldenburg法
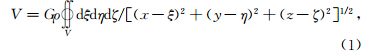
Parker-Oldenburg法是经典的界面反演方法,传统的方法只适合Δ g或者ΔT数据.本文推导出适合重力梯度异常的界面反演公式.单一密度界面在水平面(xoy面)内的引力位为
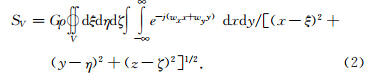

在下面的计算过程中以垂直导数为例进行推导,其它导数推导过程与其一样.已知重力异常垂直导数波谱与引力位波谱之间的关系为

则重力异常垂直导数与界面起伏之间的对应关系为
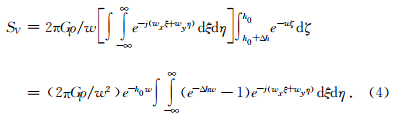
进行简单的整理后得:

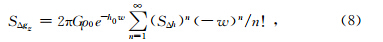
因为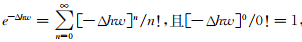 ,所以上式可以改写为
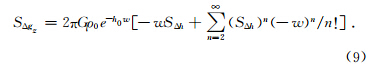
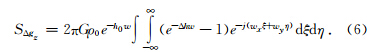
从上式中可以解算出,
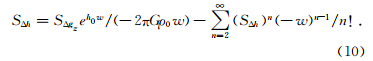
在已知界面的平均深度h0μ的情况下,可用迭代的方法计算出界面深度.忽略(11)式中的高次项,SΔh的一级近似值为

将反演计算到的SΔh1代入到(9)式中计算出SΔgz的一级近似值:

计算SΔh的修正量:

而SΔh的二级近似值为

再将SΔh2代入到(9)式中求出SΔgz的二级近似值,如此反复迭代下去,直到n次迭代后SΔgz与SΔgzn的均方误差小于给定的允许误差为止.对SΔh计算逆傅立叶变换,求出界面起伏Δh,则界面深度为
在进行具体计算时,为了使公式(12)、(14)尽快收敛和压制噪声干扰,可以在计算时加入一个余弦滤波器:

对于水平导数的界面反演公式,只需要在推导过程中将(5)式改写为SΔgx=-iwxwSV就可以了,其他推导过程是一样的.对于不同重力张量的反演结果采用加权平均的方式来获得最终的界面.
2 理论模型试验
为了验证本文方法的适用性,建立了一个理论模型(图 1),为了对比本文方法与常规方法的应用效果,其密度差采用常值0.5 g/cm3.
 | 图 1 理论模型及其引起的异常 (a)原始重力异常;(b)水平与垂直导数;(c)地质模型.Fig. 1 The theoretical model caused by abnormal |
利用本文方法与常规Parker-Oldenburg法进行界面的反演(图 2).
 | 图 2 不同异常反演得到的模型 (a)原始异常单独反演结果;(b)水平导数单独反演结果;(c)垂直导数单独反演结果;(d)重力与水平导数联合反演结果;(e)重力与垂直导数联合反演结果;(f)重力、水平导数、垂直导数三者联合反演结果.Fig. 2 Different inversion model |
图 2为利用不同的异常反演得到的结果,其中实线为理论模型,虚线为反演结果.对利用不同变量反演得到结果的精度及所需迭代次数进行统计(表 1).
| | 表 1 反演结果精度与所需迭代次数统计表 Table 1 The inversion results with desired accuracy statistics the number of iterations |
从反演结果中可以看出,单独采用导数异常反演出的界面要比单独采用重力异常反演所需的迭代次数要多,但反演出的界面与理论模型更为接近,这是由于重力异常对界面的起伏变化反映不灵敏造成的,仅利用重力异常反演得到的界面引起的梯度异常与理论梯度异常之间的差距较大.重力异常与梯度异常相结合进行反演可有效的提高反演精度,其结果与理论模型相一致.从结果可以看出,重力异常与垂直梯度联合与重力异常、水平导数及垂直导数联合的精度最高,重力异常与垂直梯度联合反演所需要的迭代次数较少,综合以上的因素,本文将采用重力异常与垂直导数联合的方法进行Vinton dome地区三维结构的建立.
3 Vinton dome地区全张量重力数据的解释
Vinton dome地区位于美国墨西哥湾地区(图 3),是著名的盐丘构造成油区域.测量获得的研究区的全张量重力异常如图 4所示,此外,在该地区还进行了三维地震勘探工作,选取经过盐丘的一条地震剖面进行地层结构的显示,从地震测量结果中可以看出,地震勘探能精细地给出地下地层的界限,但是在盐丘地区地震测量结果发散,难以准确地判断盐丘的储油位置.根据地震测量结果给出了地层解释结果(图 5b).
 | 图 3 测区位置Fig. 3 Test location |
 | 图 4 Vinton盐丘实测重力及梯度异常Fig. 4 The Vinton salt and the measured gravity gradient anomaly |
 | 图 5 地震测量及层位解释结果 (a)地震剖面;(b)解释得到的层位. Fig. 5 The result of seismic horizon interpretation and measurement (a)Seismic profile;(b)Get the horizon. |
从地震测量结果难以判断出盐丘的顶界面位置,为此考虑采用重震联合进行界面的反演.图 6a给出了利用重力和张量异常反演得到的三维模型及地震剖面位置处的断面图.
为了验证结果的正确性,采用密度反演中的栽培异常源法(Camacho et al., 2000; Uieda and Barbosa, 2012)来获得地下密度的不均匀分布,其结果如图 6c所示,可以看出反演得到的盐丘顶面深度与层位反演结果相一致.
 | 图 6 界面和密度反演结果 (a)地震剖面位置的地层分布;(b)反演得到的三维地层结构;(c)密度反演结果. Fig. 6 The results of inversion of interface and density (a)The location of the earthquake stratigraphic profile;(b)3D stratum structure inversion obtained;(c)Density inversion results. |
本文推导出利用全张量重力异常的进行界面反演的公式,并通过理论模型试验证明重力与张量异常联合进行界面反演能有效地提高方法对界面局部变化的分辨率.利用地震层位初步解释结果根据实测重力张量异常获得了地下盐丘界面的变化,此外还利用培植异常源法获得了盐丘的密度不均匀分布,结果显示两种方法所获得的盐丘顶面位置相一致,为下一步的钻探工作提供了有力的保障.
| [1] | Beiki M. 2010. Analytic signals of gravity gradient tensor and their application to estimate source location[J]. Geophysics, 75(6): 159-174. |
| [2] | Beiki M, Pedersen L B. 2010. Eigenvector analysis of gravity gradient tensor to locate geologic bodies[J]. Geophysics, 75(6): I37-I49. |
| [3] | Beiki M, Pedersen L B, Nazi H. 2011. Interpretation of aeromagnetic data using eigenvector analysis of pseudo gravity gradient tensor[J]. Geophysics, 76(3): L1-L10. |
| [4] | Bell R E, Anderson R, Pratson L. 1997. Gravity gradiometry resurfaces[J]. The Leading Edge, 16(1): 55-60. |
| [5] | Camacho A G, Montesinos F G, Vieira R. 2000. Gravity inversion by means of growing bodies[J]. Geophysics, 65(1), 95-101. |
| [6] | Doll W E, Gamey T J, Beard L P, et al. 2006. Airborne vertical magnetic gradient for near-surface applications[J]. The Leading Edge, 25(1): 50-53. |
| [7] | Gamey T J, Starr T, Doll W E, et al. 2004. Initial design and testing of a full-tensor airborne SQUID magnetometer for detection of unexploded ordnance[C].// SEG Expanded Abstracts, 798-801. |
| [8] | Jekeli C. 1993. A review of gravity gradiometer survey system data analyses[J]. Geophysics, 58(4): 508-514. |
| [9] | Ma G Q, Du X J, Li L L. 2012. Comparison of the tensor local wavenumber method with the conventional local wavenumber method for interpretation of total tensor data of potential fields[J]. Chinese Journal of Geophysics (in Chinese), 55(7): 2450-2461,. doi: 10.6038/j.issn.0001-5733.2012.07.029. |
| [10] | Oru B. 2010a. Depth Estimation of Simple Causative Sources from Gravity Gradient Tensor Invariants and Vertical Component[J]. Pure and Applied Geophysics, 167(10): 1259-1272. |
| [11] | Oru B. 2010b. Location and depth estimation of point-dipole and line of dipoles using analytic signals of the magnetic gradient tensor and magnitude of vector components[J]. Journal of Applied Geophysics, 70(1): 27-37. |
| [12] | Schmidt P W, Clark D A. 2000. Advantages of measuring the magnetic gradient tensor[J]. Preview, 85: 26-30. |
| [13] | Schmidt P W, Clark D A. 2006. The magnetic gradient tensor: Its properties and uses in source characterization[J]. The Leading Edge, 25 (1): 75-78. |
| [14] | Uieda L, Barbosa V C F. 2012. Robust 3D gravity gradient inversion by planting anomalous sources[J]. Geophysics, 77(4): G55-G66. |
| [15] | Valentin M, Gwendoline P, Michel D, et al. 2007. Tensor deconvolution: A method to locate equivalent sources from full tensor gravity data[J]. Geophysics, 72(5): I61-I69 |
| [16] | Wu X, Wang K, Feng W, et al. 2011. Method of tensor invariant based on non-full tensor satellite gravity gradients[J]. Chinese J. Geophys. (in Chinese), 54(4): 966-976, doi: 10.3969/j.issn.0001-5733.2011.04.011. |
| [17] | Zhang C Y, Mushayandebvu M F, Reid A B, et al. 2000. Euler deconvolution of gravity tensor gradient data[J]. Geophysics, 65(2): 512-520. |
| [18] | 马国庆, 杜晓娟, 李丽丽. 2012. 解释位场全张量数据的张量局部波数法及其与常规局部波数法的比较[J]. 地球物理学报, 55(7): 2450-2461, doi: 10.6038/j.issn.0001-5733.2012.07.029. |
| [19] | 吴星, 王凯, 冯炜,等. 2011. 基于非全张量卫星重力梯度数据的张量不变量法[J]. 地球物理学报, 54(4): 966-976, doi: 10.3969/j.issn.0001-5733.2011.04.011. |