 2021, Vol. 64

2. 天津市地震局, 天津 300201;
3. 四川省地震局, 成都 610041;
4. 北京市地震局, 北京 100080;
5. 甘肃省地震局, 兰州 730000
 , JIANG ChangSheng1
 , YIN FengLing1, ZHANG YanBao1, BI JinMeng2, LONG Feng3, SI ZhengYa4, YIN XinXin1,5
2. Tianjin Earthquake Agency, Tianjin 300201, China;
3. Sichuan Earthquake Agency, Chengdu 610041, China;
4. Beijing Earthquake Agency, Beijing 100080, China;
5. Gansu Earthquake Agency, Lanzhou 730000, China
描述地震震级-频度分布(FMD)的古登堡-里克特(G-R)关系中的b值,被证实与地壳中的差应力负相关(Wyss, 1973; Mori and Abercrombie, 1997; Toda et al., 1998),使其成为间接反映地震孕育发生时空物理过程的重要参量,因此在地震危险性分析、地震工程和地球动力学研究中得到广泛应用.除了在地表二维平面、考虑深度的三维空间、时-空间研究b值的非均质性分布和演化规律外(Wiemer and Wyss, 1997; Schorlemmer and Wiemer, 2005; Murru et al., 2007; Wang et al., 2021),b值在地震时间序列中也同样具有重要的应用价值.这是由于前震/余震被限制在与主震破裂尺度相关的震区内,干热岩和页岩气开发等新型工业活动以及深部矿山开采等引起的诱发地震活动也被局限在注采区较小空间范围内集中发生,因此可简化为只需要考虑时间序列b值变化,这极大降低了研究的复杂性.目前时间序列b值已在诱发地震的最大震级Mmax估计(Hallo et al., 2014; Van Der Elst et al., 2016)、前瞻型预测的风险管控“交通灯系统”的构建(Ader et al., 2020),以及天然地震的前震与主震识别(Van Der Elst, 2021)、强震前的前兆性变化(史海霞等, 2018; Xie et al., 2019)、后续强余震的风险分级(Gulia and Wiemer, 2019)等多场景应用中发挥关键作用.
但时间序列b值的计算始终面临多方面的挑战,包括传统采用的固定地震数目和时间长度的固定窗口法(Hutton et al., 2010; Ogata, 2011)在计算规则设置上过强的人为主观性,以及由于地震序列在时间上的丛集性和稀疏性造成对b值的突变难于准确识别,都使得时间序列b值的计算以及对震例的解释存在较多争议(Kamer and Hiemer, 2013).针对上述问题,Fiedler等(2018)发展了一种利用贝叶斯因子来选择模型并识别时间序列b值突跳点的方法,但在震级-频度关系上仍选用了G-R关系.针对主震后大量余震缺失造成的完备震级以上可使用地震数目过少的问题,Van Der Elst(2021)发展了称为“b-positive”的时间序列b值计算方法,用连续地震之间震级差的正子集来估算b值并规避了此问题.然而这些计算方法尚且不能将两类问题同时解决,想要得到广泛的认可仍有待更多的震例验证和方法改进.
近年来数据驱动研究快速兴起,其核心思想是利用大规模的随机建模和模型优选,获得无参数的客观估算结果.将数据驱动技术引入地震活动参数计算的研究也已逐步开始.例如Kamer和Hiemer(2015)利用数据驱动技术和G-R关系估算了美国加州地区的b值空间分布,Sambridge等(2013)利用数据属性推断模型参数的空间分布信息,Nandan等(2017)发展了基于数据驱动的时空传染型余震序列(ETAS)模型参数估算方法,Si和Jiang(2019)、Jiang等(2021)发展了基于数据驱动和OK1993模型的b值空间和时空分布计算方法.对比上述方法研究,时间序列b值的计算能否也引入数据驱动技术,并同时解决前述两个瓶颈问题呢?为此我们做了方法研究,在本文中发展了“基于数据驱动的时间序列b值计算”(文中简称TbDD)方法,并进行了合成地震目录的理论测试,以及应用于刚刚发生的2021年5月21日云南漾濞MS6.4地震序列中.本文的TbDD方法研究以及实际应用,试图对科学认识2021年云南漾濞MS6.4地震序列的活动规律、震区应力状态,以及在其他地震序列的危险性分析、工业开采诱发地震的地震灾害风险管控提供科学分析方法.
1 基于数据驱动的时间序列b值计算本文提出的TbDD方法的构建,包括震级-频度分布函数的选择、时间轴的随机段落划分、最佳模型选择三个主要步骤.
步骤一:震级-频度分布函数的选择.为科学描述震级-频度分布,尤其是为充分利用记录不完整的、数量较大的小震级地震事件(Iwata, 2013; Omi et al., 2013),目前国际上广泛采用Ogata和Katsura(1993)给出的连续分布函数(简称OK1993模型).OK1993模型是在通常意义上的幂指数函数的震级-频度分布λ0(m)基础上,叠加了地震事件的检测率函数q(m),从而给出包括未被完整检测的小震级事件的震级-频度分布模型的一般表达式:
|
(1) |
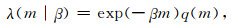
式中的exp(-βm) 即为幂指数函数的FMD,m为地震事件的震级,幂指数β与b值之间为线性关系β=bln10,因此获得β的估计值后即可直接折算b值.检测率函数q(m)是取值在[0, 1]范围的正态累积分布函数,其表达式为:
|
(2) |
式中的M是计算所用地震目录的最大震级.参数μ是指检测率为50%时的震级,σ表示相应的震级范围,两个参量一般可结合起来共同描述地震台网记录地震的完备程度.Iwata(2013)研究认为,由于OK1993模型是连续、渐变的非线性函数,可分别用98%置信水平下完整记录的μ+2σ或者在99.9%置信水平下完整记录的μ+3σ来近似描述最小完整性震级MC.
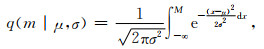
根据公式(1)和(2)可得到实际观测地震的概率密度函数,表示为:
|
(3) |
对于一组实际观测地震事件{m1, m2, …, mn},Ogata和Katsura(1993)给出了公式(3)对应的OK1993模型的对数似然函数:

|
(4) |
可利用最大似然法对(4)式的对数似然函数进行拟合,获得OK1993模型的三个参数[β, μ, σ].
步骤二:时间轴的随机段落划分.数据驱动技术思路实现的关键之一是构建大量的随机“模型”.所谓的模型是指对研究的时空间进行随机剖分,每一种划分方案被称为一个模型,这些模型将为后续的计算和最优模型的选择创造条件.在二维空间/时-空间、三维空间的随机剖分上,常采用Voronoi网格剖分方法自动生成随机网格,例如政治投票分区和预测(Svec et al., 2007)、物流匹配和最优运输(Rubner et al., 2000)等数据驱动技术思路的实现.由于本文的研究对象是时间序列,因此在模型构建上需要对时间轴上的起始时间t0与终止时间t1之间的[t0, t1]时段进行随机的段落切分.
具体操作步骤为:(1)利用随机数发生器在[t0, t1]时段生成随机时间节点T={T1, T2, …, Tn},n为时间节点的个数,由此将[t0, t1]时段切分为时段S={S1, S2, …, Sn+1}并构成了一个模型;(2)大量重复上述随机过程w次,获得时间轴上的w组划分方案{Pi, i=1, 2, …, w},也即w个模型;(3)对每一个模型(每一组划分方案)的时段S={S1, S2, …, Sn+1},可对落入每个时段内的地震事件求取OK1993模型参数[β, μ, σ],涉及的计算量为w×(n+1)次.
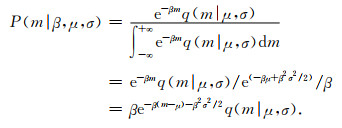
步骤三:最佳模型选择.最终的参数计算是通过模型选择来实现的.这是按照某种惩罚函数来约束和选择一些最优模型.在地震活动参数的模型选择中,Kamer和Hiemer(2015)、Nandan等(2017)、Si和Jiang(2019)均采用贝叶斯信息准则(Bayesian information criteria, 简称BIC)(Schwarz, 1978)来实现,本文也同样采用BIC进行最优化模型选择.BIC值由公式(4)的对数似然函数lnL(θ),以及模型的自由度k、为计算使用的地震事件数目N计算获得:
|
(5) |
由于每个模型的每个时段的划分是由起点时刻和终点时刻唯一决定,因此每个时段的参数由起点时刻、终点时刻、时段内的OK1993模型参数[β, μ, σ]组成,公式(5)涉及到的每个模型的整体自由度为k=5×(n+1).此外,每一个模型的BIC值是对所有时段内计算结果的求和Sum(BIC1, BIC2, …, BICn+1).
最佳模型是在w个模型中选择一定比例的、BIC值最低的部分模型,例如通常选择模型数量的5%或10%,一些研究也认为具体的数量选择对最终结果影响不大(Si and Jiang, 2019).最终的参数值是对这些最佳模型的参数值在时间轴上计算的集合中值,用相应的绝对中位差(MAD),即四分位距的一半来表示结果的不确定度.
2 方法的理论测试 2.1 合成地震目录的生成为验证TbDD方法对时间序列b值计算的有效性,需要进行方法的理论测试,即构建合成地震目录并测试计算结果对输入参数的还原程度.为接近真实地模拟地震活动,在合成地震目录时设定了与后续的实际地震观测数据计算的2021年云南漾濞MS6.4地震序列一致的时间范围、接近的生成地震数量,也对震级-频度分布采用OK1993模型的概率密度函数.
本文在起始时间t0=2021-05-18 08∶00∶00,终止时间t1= 2021-05-26 15∶30∶00的时段内生成合成地震目录.按照时长t1-t0的5/12、3/12、4/12比例顺次分成三个时段、设定不同的OK1993模型合成地震目录输入参数,其中令三个时段均使用μ=0.8000和σ=0.2000,而β值则分别为0.60、0.85、0.50.分别利用公式(3)的概率密度函数在每个时段生成1000个地震事件,震级范围为0~6.4.由于生成的是有限数量的随机地震事件,对其再次进行OK1993模型拟合时获得的参数往往与合成地震目录输入参数存在偏差,例如本研究中的三组参数分别为β=1.4125、μ=0.8186、σ=0.2081,β=2.0404、μ=0.7924、σ=0.2076以及β=1.1095、μ=0.8138、σ=0.2059,我们将这些新生成的合成地震目录参数作为后续比较和评判的参考值.上述获得的随机地震事件的FMD和OK1993模型参数拟合值如图 1a—c所示,震级-时间分布(M-t)如图 1d所示,相应三个时段的b0值分别为0.6134、0.8861和0.4818.

|
图 1 对TbDD方法测试的理论地震目录 (a)—(c)理论地震目录的FMD以及OK1993模型拟合结果.三个子图分别对应假设时段2021-05-18 08∶00∶00—05-26 15∶30∶00的前5/12、中间3/12、后4/12,均为1000个随机生成事件.菱形为理论地震目录的FMD,实曲线为OK1993模型拟合结果,理论地震目录生成后的实际参数β、μ和σ分别被标注在各子图上;(d)理论地震目录的震级-时间分布(M-t).圆点为生成的地震事件,颜色与图(a)—(c)中相应时段的OK1993模型拟合曲线的颜色相一致,蓝色虚线为三个时段对应的b值、与图(a)—(c)的β/log10相一致. Fig. 1 Synthetic earthquake catalogs for testing the TbDD method (a)—(c) The magnitude-frequency distribution (FMD) of the synthetic catalogs and the fitting results of OK1993 model. The three subgraphs respectively correspond to the first 5/12, the middle 3/12, and the last 4/12 of the hypothetical period 2021-05-18 08∶00∶00—05-26 15∶30∶00. The number of earthquakes in each time segment is 1000. The diamonds show the FMD of the synthetic catalogs. The solid curves represent the fitting results of OK1993 model. The actual parameters of synthetic catalogs are marked in each subgraph in the order of β, μ, and σ; (d) The magnitude-time distribution (M-t) of the synthetic catalogs. The dots indicate generated seismic events, whose colors correspond to that of the OK1993 model′s fitting curves of the same segment in figure (a)—(c). The blue dashed line denotes the b-values of the three time segments, which are consistent with β/log10 in figure (a)—(c). |
对生成的t0=2021-05-18 08∶00∶00至t1=2021-05-26 15∶30∶00时段的合成地震目录,我们根据时间序列的复杂程度,设定TbDD方法的时间节点的个数n=4,也即将计算所用的时间跨度随机切分成5段.生成m=10000个模型,其中BIC值最小的1000个被选作最佳模型.获得的计算结果如图 2所示,图 2a和2b中的红色曲线为b值的集合中值,灰色区域为相应b值的绝对中位差.通过与合成地震目录的输入参数b0值比较可见,由TbDD方法获得的b值基本可以恢复b0值,尤其是当b0值在差异较大的0.8861与0.4818之间突跳和在b0=0.6134与b0=0.4818时段内部时.这一结果展示了TbDD方法在恢复初始参数上的有效性.

|
图 2 对理论地震目录的TbDD方法计算结果及其与固定窗口法的比较 (a) TbDD计算结果及其与330个事件的窗长和步长的固定窗口法的比较.黑色折线为固定窗口法计算获得的b值;(b) TbDD计算结果及其与180个事件的窗长和步长的固定窗口法的比较.绿色折线和紫色折线为采用180个事件的步长进行累积窗长、分别沿时间轴和逆时间轴的b值.(a)和(b)中的红色曲线为利用TbDD方法计算获得的b值中值,计算采用5段划分、10000次随机剖分、1000个最佳模型,灰色区域为相应的b值的MAD.蓝色虚折线为理论地震目录的b0值. Fig. 2 The calculation results from the TbDD method and its comparison with the fixed window method by using the synthetic earthquake catalogs (a) The results of the TbDD are compared with that of the fixed window method of the window length and step length of 330 events. The black polyline indicates the b-values calculated by the fixed window method; (b) The results of the TbDD are compared with that of the fixed window method of the window length and step length of 180 events. The green polyline and the purple polyline indicate the b-values calculated along the time axis and against the time axis respectively, and both use a step of 180 events and a continuous accumulation window to select data. The red curves in (a) and (b) show the median values of the b-values calculated by the TbDD method. Five-segment division, 10000 random partitions and 1000 best models are used in the calculation. The gray area show the MAD of the corresponding b-values. The blue dashed polylines show the b0-values of the synthetic catalogs. |
为了与传统的时间序列b值计算方法进行比较,我们采用了两种方式进行测试:(1)采用固定地震数目的窗长和步长的固定窗口法,分别设置两组窗长或步长为330个事件和180个事件,具体计算仍采用OK1993模型和最大似然法计算参数β并折算为b值;(2)采用180个事件的步长,但窗长不断累积扩大,分别沿时间轴和逆时间轴选择地震,采用OK1993模型和最大似然法计算参数β并折算为b值.上述两种测试结果如图 2所示.
对比TbDD方法和传统的固定窗口法获得的b值结果可见,(1)当固定地震数目的窗长或步长较大时,在合成输入参数稳定的时段也可获得相对稳定的结果,例如图 2a的330个事件的窗长或步长.当固定地震数目的窗长或步长较小时,b0则会由于拟合OK1993模型不确定性的提高涨落较大.这对传统的固定窗口法提出了较大的约束限制;(2)在b0值出现突跳的位置,传统的固定窗口法同样受限于窗长的大小,无法准确地恢复突跳变化.例如在差异较大的b0=0.8861与b0=0.4818之间突跳时,窗长分别为330个事件和180个事件的两种设置均难以恢复这种突跳.甚至在采用累积窗长的顺时间轴与逆时间轴的计算中,由于经过突升的b0=0.8861时段时,累积窗长已显著大于该时段的长度,计算获得的b值几乎无法反映该时段的突升现象.这些均揭示了传统固定窗口法的明显弊端,同时也对比展示了TbDD方法的相应优势.
3 2021年云南漾濞MS6.4地震序列的实际应用我们将本文发展的TbDD方法用于实际的地震序列b值计算.据中国地震台网测定,2021年5月21日21时48分,云南大理州漾濞县附近发生MS6.4地震,震中位于25.67°N、99.87°E,震源深度8 km.此次地震前的5月18日、19日,震区发生两组最大超过4级的前震活动,甚至在主震前半小时内的21时21分震区还发生了震级高达MS5.6的前震.本文使用的数据来自中国地震台网中心的地震编目系统《统一快报目录》,研究时段为2021-05-18 08∶00∶00至2021-05-26 15∶30∶00,研究区域设定为包含此次云南漾濞MS6.4地震序列的空间范围25.45°N—25.83°N、99.70°E—100.15°E,震级范围M≥ML0.0.此次地震序列较为发育,在上述研究时段和研究区域内发生MS3.0~3.9地震75次、MS4.0~4.9地震20次、MS5.0~6.9地震2次(MS5.6和MS5.2),M≥ML0.0地震总次数达到2939次.图 3a给出了上述地震序列的震级-时间分布.

|
图 3 对2021年5月21日云南漾濞MS6.4地震序列的TbDD方法计算结果及其与固定窗口法的比较 (a) 云南漾濞MS6.4地震序列的震级-时间分布(M-t),黑色虚线为利用TbDD方法计算获得的参数μ值中值,蓝色虚线和实线分别为最小完备震级参考的μ+2σ和μ+3σ;(b) 利用TbDD方法计算获得的b值结果.图中红色曲线为b值中值,灰色区域为相应的b值的MAD,计算采用5段划分、10000次随机剖分、1000个最佳模型;(c) 固定窗口法计算获得的b值结果.在采用了300个事件的步长的情况下,黑色折线给出了300个事件的滑动窗口的方式的计算结果,绿色折线和紫色折线给出了计算结果采用累积窗分别沿时间轴和逆时间轴的计算结果.图(b)和(c)中的垂虚线为与图(a)中M≥ML4.0事件相对应的发震时刻.计算的时段为2021-05-18 08∶00∶00—05-26 15∶30∶00、所用事件的震级为M≥ ML0.0. Fig. 3 The calculation results from the TbDD method and its comparison with the fixed window method for the Yangbi MS6.4 earthquake sequence of May 21, 2021 in Yunnan (a) The M-t of the Yangbi MS6.4 earthquake sequence in Yunnan. The black dashed lines show the median μ values calculated by the TbDD method, and the blue dashed lines and solid lines show the values of μ+2σ and μ+3σ for reference of the minimum completeness magnitude, respectively; (b) The b-values obtained by the TbDD method. The red curves and gray areas show the median and MAD of b-values, respectively. Five-segment division, 10000 random partitions and 1000 best models are used in the calculation; (c) The b-values calculated by the fixed window method. In the case of using a step length of 300 events, the black polyline shows the calculation result with sliding window of 300 events, the green polyline and the purple polyline show the calculation results using cumulative window along the time axis and against the time axis, respectively. The vertical dashed lines in figures (b) and (c) show the origin time corresponding to the events of M≥ML4.0 in figure (a). The calculated period is 2021-05-18 08∶00∶00—05-26 15∶30∶00, and the magnitude of the events is M≥ML0.0. |
在将TbDD方法应用于云南漾濞MS6.4地震序列中,我们采用与理论测试相同的建模策略和参数设置.即设定时间轴的随机段落划分为5段,随机生成m=10000个模型,并选取其中BIC值最小的1000个最优模型.获得的b值的集合中值和MAD的结果如图 3b所示.为了展示云南漾濞MS6.4地震序列的最小完整性震级MC,图 3a还给出了计算获得的μ值的集合中值,以及μ+2σ和μ+3σ的结果.由图 3b的TbDD方法计算的b值结果可见,在研究时段的云南漾濞MS6.4地震序列发生过程中b值总体低于1.0.在MS6.4主震发生前b值为0.7左右、主震前20小时还出现了0.1左右的下降.在主震发生后,b值起伏明显、总体趋势增加直至研究时段结束的0.8左右.图中b值的起伏变化也伴随着较大的MAD,参考图 2的合成地震目录测试结果可以确认,这些时段b值的时间非平稳性,可能与震后余震区断层上较为剧烈的应力调整有关(Xie et al., 2019; Jiang et al., 2021).
采用与合成地震目录测试类似的方式,我们还给出了固定窗口法的b值计算结果,包括采用300个事件的步长和窗长,以及采用300个事件的步长、累积窗长、分别沿时间轴和逆时间轴的b值,相应的结果如图 3c所示.将上述固定窗口法的b值计算结果与TbDD方法的计算结果比较可见,采用固定步长和窗长得到的b值的总体变化过程和数值大小,与TbDD方法的计算结果接近;而采用两个不同方向的累积窗长计算结果,在TbDD方法得到的b值起伏变化时段存在显著差异,这也同样验证了此时段“真实”的b值应有起伏变化.
为了进一步验证TbDD方法在建模规则上是否影响b值的计算结果,我们采用多种模式计算b值:(1)随机生成m=10000个模型、选择1000个最佳模型,但对时间轴分别进行3段、4段、6段的随机划分;(2)采用5段的时间划分方式,但使用m=2000、m=1000和m=500个模型来计算,相应的最佳模型数量则分别为各自的总模型数量的10%.上述多种模式的TbDD方法建模计算结果如图 4所示.将这些结果进行比较,并与图 3b的结果比较发现,在随机模型数量相同时,时间轴的随机划分段落越多,能够揭示的b值随时间的微观起伏过程越多(图 4a),但b值随时间的总体趋势一致.而在时间轴的随机段落划分相同时,随机模型数量无论是10000个还是2000、1000或500个,对b值集合中值结果的影响不明显,但MAD值将随着随机模型数量的增加而减小.这些多模式的计算结果间的比较,显示了TbDD方法在计算时间序列b值时的高度稳定性.

|
图 4 对2021年5月21日云南漾濞MS6.4地震序列采用多种计算模式设置的TbDD方法计算结果的比较 (a) 采用10000次随机剖分和不同时间划分方式的计算结果比较;(b) 采用5段的时间划分方式和不同随机剖分次数的计算结果比较.图中的实线或虚线是b值的中值,各种颜色填充的区域是与同种颜色实线或虚线相对应的b值的MAD值.图中实线或虚线为b值中值,各颜色区域为相应的b值的MAD.计算使用的序列时段为2021-05-18 08∶00∶00—05-26 15∶30∶00,震级为M≥ML0.0. Fig. 4 Comparison of the results of the TbDD method using multiple sets of calculation models for the MS6.4 Yangbi, Yunnan earthquake sequence (a) Comparison of calculation results by using 10000 random partitions and different time division methods; (b) Comparison of calculation results obtained from models of different random partition times using five-segments time division methods. The solid or dashed lines indicate the median of b-values, and the areas filled with various colors show the MAD of b-values corresponding to the lines with the same color. The calculated period is 2021-05-18 08∶00∶00—05-26 15∶30∶00, and the magnitude of the events is M≥ML0.0. |
在广泛用于余震区地震序列分析、工业开采区诱发地震危险性分析时间序列b值的计算中,为克服传统计算方法计算规则设置的人为主观性问题,本文借鉴基于数据驱动技术思路,利用震级-频度分布的OK1993模型、时间轴的随机划分和随机模型建立、BIC的最佳模型选择等,构建了基于数据驱动的时间序列b值计算方法——TbDD.在经过合成地震目录的理论测试、2021年云南漾濞MS6.4地震序列的实际应用分析后,获得的主要认识如下:
(1) 利用合成地震目录的理论测试结果表明,本文新发展的TbDD方法可较为准确地恢复b值的突跳变化、稳定地获得各时段的参考值,能够克服传统的固定窗口法在计算规则设置上的人为主观性等瓶颈问题.
(2) 对2021年云南漾濞MS6.4地震序列的实际应用表明,b值在MS6.4主震前为较低的0.7左右、震前20小时出现了0.1左右幅度的下降,表明震区在序列发生前处于较高的差应力水平状态;b值在MS6.4主震发生后起伏明显、总体趋势增加至0.8左右,可能与震区较为剧烈的应力调整有关.
(3) TbDD方法计算的时间序列b值受随机模型数量/计算量的影响较小,具备较强的稳定性,但大量的随机模型可降低结果的不确定度;而对时间轴的随机划分段落设置可影响b值随时间较为微观的起伏变化.
本文在构建TbDD方法中,对震级-频度关系选用了OK1993模型,这种连续函数由于充分利用了不完整记录的大量地震事件(Omi et al., 2013),相比使用“一刀切”的最小完整性震级以上地震的传统的基于震级-频度G-R关系的固定窗口法,甚至一些基于数据驱动技术的空间b值计算方法(Kamer and Hiemer, 2015),在参数估计结果的统计显著性、可靠性上更具有天然优势.此外,最小完整性震级是随着时间动态变化的,例如在主震发生后的短期内,大量的余震密集发生显著降低了地震波形的信噪比、人工检测地震的遗漏增加(Kagan, 2004; Hainzl, 2016),都可造成最小完整性震级的升高或检测能力的下降.因此在基于震级-频度G-R关系的固定窗口法使用时,可使用的“一刀切”的最小完整性震级以上地震的数量大大降低.而TbDD方法在大量的数据驱动计算中,同时估算了b值和涉及检测能力的参数μ和σ值,使得在最小完整性震级动态演变过程中也可最大限度地利用全部数据.
在应用TbDD方法建模过程中,使用更多的随机段落划分可以揭示部分b值时间变化的微观起伏.当一个模型的随机段落中最短的段落上样本数过少、拟合OK1993模型误差较大、BIC值升高,从而“拖累”这个模型难于被选为最优模型时,客观上也限制了无法过度细分随机段落.我们在TbDD方法用于2021年云南漾濞MS6.4地震序列的实际案例分析中,采用的5段划分仍具有经验性,未来在此类数据驱动方法的改进研究中,寻找客观的真正智能化的模型构建策略可能是需要进一步努力的方向,包括利用Akaike贝叶斯准则(ABIC)等评价方法对分段数目参数进行优化.此外,本文提出的TbDD方法对随机模型次数的弱依赖性表明,大规模计算与有限次数的计算在集合中值上差别不明显,即使是数百次的随机模型也可得到相对可靠的结果.但大规模计算可有助于减少MAD并确保集合中值的可靠性,这使得通过大量随机模型进一步取得b值计算在精度上的优势成为可能.
致谢 本文属于云南漾濞6.4级地震科学考察工作,地震序列研究工作组对本文给予了帮助.两位评审专家提出了诸多建设性修改建议、对稿件质量提升帮助很大,在此一并表示感谢.
Ader T, Chendorain M, Free M, et al. 2020. Design and implementation of a traffic light system for deep geothermal well stimulation in Finland. Journal of Seismology, 24(5): 991-1014. DOI:10.1007/s10950-019-09853-y |
Fiedler B, Hainzl S, Zöller G, et al. 2018. Detection of Gutenberg-Richter b-value changes in earthquake time series. Bulletin of the Seismological Society of America, 108(5A): 2778-2787. DOI:10.1785/0120180091 |
Gulia L, Wiemer S. 2019. Real-time discrimination of earthquake foreshocks and aftershocks. Nature, 574(7777): 193-199. DOI:10.1038/s41586-019-1606-4 |
Hainzl S. 2016. Rate-dependent incompleteness of earthquake catalogs. Seismological Research Letters, 87(2A): 337-344. DOI:10.1785/0220150211 |
Hallo M, Oprsal I, Eisner L, et al. 2014. Prediction of magnitude of the largest potentially induced seismic event. Journal of Seismology, 18(3): 421-431. DOI:10.1007/s10950-014-9417-4 |
Hutton K, Woessner J, Hauksson E. 2010. Earthquake monitoring in southern California for seventy-seven years (1932-2008). Bulletin of the Seismological Society of America, 100(2): 423-446. DOI:10.1785/0120090130 |
Iwata T. 2013. Estimation of completeness magnitude considering daily variation in earthquake detection capability. Geophysical Journal International, 194(3): 1909-1919. DOI:10.1093/gji/ggt208 |
Jiang C S, Han L B, Long F, et al. 2021. Spatiotemporal heterogeneity of b values revealed by a data-driven approach for June 17, 2019 MS6.0, Changning Sichuan, China earthquake sequence. Natural Hazards and Earth System Sciences, 21: 2233-2244. DOI:10.5194/nhess-2021-3 |
Kagan Y Y. 2004. Short-term properties of earthquake catalogs and models of earthquake source. Bulletin of the Seismological Society of America, 94(4): 1207-1228. DOI:10.1785/012003098 |
Kamer Y, Hiemer S. 2013. Comment on "Analysis of the b-values before and after the 23 October 2011 MW7.2 Van-Ercis, Turkey, earthquake". Tectonophysics, 608: 1448-1451. DOI:10.1016/j.tecto.2013.07.040 |
Kamer Y, Hiemer S. 2015. Data-driven spatial b value estimation with applications to California seismicity: To b or not to b. Journal of Geophysical Research: Solid Earth, 120(7): 5191-5214. DOI:10.1002/2014JB011510 |
Mori J, Abercrombie R E. 1997. Depth dependence of earthquake frequency-magnitude distributions in California: Implications for rupture initiation. Journal of Geophysical Research: Solid Earth, 102(B7): 15081-15090. DOI:10.1029/97JB01356 |
Murru M, Console R, Falcone G, et al. 2007. Spatial mapping of the b value at Mount Etna, Italy, using earthquake data recorded from 1999 to 2005. Journal of Geophysical Research: Solid Earth, 112(B12): B12303. DOI:10.1029/2006JB004791 |
Nandan S, Ouillon G, Wiemer S, et al. 2017. Objective estimation of spatially variable parameters of epidemic type aftershock sequence model: Application to California. Journal of Geophysical Research: Solid Earth, 122(7): 5118-5143. DOI:10.1002/2016JB013266 |
Ogata Y, Katsura K. 1993. Analysis of temporal and spatial heterogeneity of magnitude frequency distribution inferred from earthquake catalogues. Geophysical Journal International, 113(3): 727-738. DOI:10.1111/j.1365-246X.1993.tb04663.x |
Ogata Y. 2011. Significant improvements of the space-time ETAS model for forecasting of accurate baseline seismicity. Earth, Planets and Space, 63(3): 6. DOI:10.5047/eps.2010.09.001 |
Omi T, Ogata Y, Hirata Y, et al. 2013. Forecasting large aftershocks within one day after the main shock. Scientific Reports, 3: 2218. DOI:10.1038/srep02218 |
Rubner Y, Tomasi C, Guibas L J. 2000. The earth mover's distance as a metric for image retrieval. International Journal of Computer Vision, 40(2): 99-121. DOI:10.1023/A:1026543900054 |
Sambridge M, Bodin T, Gallagher K, et al. 2013. Transdimensional inference in the geosciences. Philosophical Transactions of the Royal Society A: Mathematical, Physical and Engineering Sciences, 371(1984): 20110547. DOI:10.1098/rsta.2011.0547 |
Schorlemmer D, Wiemer S. 2005. Microseismicity data forecast rupture area. Nature, 434(7037): 1086-1086. DOI:10.1038/4341086a |
Schwarz G. 1978. Estimating the dimension of a model. The Annals of Statistics, 6(2): 461-464. |
Shi H X, Meng L Y, Zhang X M, et al. 2018. Decrease in b value prior to the Wenchuan earthquake (MS8.0). Chinese Journal of Geophysics (in Chinese), 61(5): 1874-1882. DOI:10.6038/cjg2018M0024 |
Si Z Y, Jiang C S. 2019. Research on parameter calculation for the Ogata-Katsura 1993 model in terms of the frequency-magnitude distribution based on a data-driven approach. Seismological Research Letters, 90(3): 1318-1329. DOI:10.1785/0220180372 |
Svec L, Burden S, Dilley A. 2007. Applying Voronoi diagrams to the redistricting problem. The UMAP Journal, 28(3): 313-329. |
Toda S, Stein R S, Reasenberg P A, et al. 1998. Stress transferred by the 1995 MW=6.9 Kobe, Japan, shock: Effect on aftershocks and future earthquake probabilities. Journal of Geophysical Research: Solid Earth, 103(B10): 24543-24565. DOI:10.1029/98JB00765 |
Van Der Elst N J, Page M T, Weiser D A, et al. 2016. Induced earthquake magnitudes are as large as (statistically) expected. Journal of Geophysical Research: Solid Earth, 121(6): 4575-4590. DOI:10.1002/2016JB012818 |
Van Der Elst N J. 2021. B-positive: A robust estimator of aftershock magnitude distribution in transiently incomplete catalogs. Journal of Geophysical Research: Solid Earth, 126(2): e2020JB021027. DOI:10.1029/2020JB021027 |
Wang R, Chang Y, Miao M, et al. 2021. Assessing earthquake forecast performance based on b value in Yunnan Province, China. Entropy, 23(6): 730. DOI:10.3390/e23060730 |
Wiemer S, Wyss M. 1997. Mapping the frequency-magnitude distribution in asperities: An improved technique to calculate recurrence times?. Journal of Geophysical Research: Solid Earth, 102(B7): 15115-15128. DOI:10.1029/97JB00726 |
Wyss M. 1973. Towards a physical understanding of the earthquake frequency distribution. Geophysical Journal of the Royal Astronomical Society, 31(4): 341-359. DOI:10.1111/j.1365-246X.1973.tb06506.x |
Xie W Y, Hattori K, Han P. 2019. Temporal variation and statistical assessment of the b value off the Pacific Coast of Tokachi, Hokkaido, Japan. Entropy, 21(3): 249. DOI:10.3390/e21030249 |
史海霞, 孟令媛, 张雪梅, 等. 2018. 汶川地震前的b值变化. 地球物理学报, 61(5): 1874-1882. DOI:10.6038/cjg2018M0024 |