 2021, Vol. 64

2. 中国石油大学胜利学院, 东营 257061;
3. 中国石油集团测井有限公司新疆油田分公司, 克拉玛依 834000;
4. 新疆油田公司勘探开发研究院, 克拉玛依 834000;
5. 西部钻探工程有限公司地质研究院, 克拉玛依 834000;
6. 长江大学地球科学学院, 武汉 430100;
7. 克拉玛依市昂科能源科技有限公司, 克拉玛依 834001

 , DU YangYang2, JIANG Tao3, ZHANG Hao4, HU ZhangMing5,6, TANG JianHong3, WANG Peng1, LUO XingPing4, CHAI LiXue1, WANG HongLiang5, DAI ShiHua7
2. Shengli College China University of Petroleum, Dongying 257061, China;
3. Xinjiang Branch of China Petroleum Logging Company Limited, Karamay 834000, China;
4. Research Institute of Petroleum Exploration and Development, Xinjiang Oilfield Company, PetroChina, Karamay 834000, China;
5. Geological Research Institute of CNPC Xibu Drilling Engineering Company Limited, Karamay 834000, China;
6. Collage of Geoscience, Yangtze University, Wuhan 430100, China;
7. Karamay OnCores Energy Technology Company Limited, Karamay 834001, China
随着油气藏注水开发的不断深入,大部分储层已发生不同程度的水淹,储层的原始特性发生了巨大的变化.剩余油饱和度的空间分布以及随时间的动态变化对于开发方案调整以及提高采收率变得尤为重要.因此,剩余油饱和度的评价方法一直受到油藏工程师的广泛关注.
目前,剩余油饱和度的常规评价主要有两个技术手段:测井和测试(洪有密,2008;雍世和和张超谟,2007;丁次乾,2008;孙建孟等,2008;韩学辉等,2012).测井资料常被用于水淹层剩余油饱和度评价,主要利用不同水淹程度的地层在测井曲线上的响应特征给出水淹层识别以及剩余油饱和度的定量评价方法.测井评价剩余油饱和度的难点是混合液的电阻率不容易确定,难以用电阻率识别水淹级别以及估算含油饱和度(剩余油).同时,有一个较大的局限性:完井后裸眼井测井数据是静态的,其电阻率曲线等响应特征只表征测井时刻目标层饱和度状态,固化后无法再对生产开发后其他时期的剩余油饱和度进行评价(方鹏,2011;丁一,2014;马燕,2018;毛玉丹,2018;张海光,2018;贾国伟,2018;孙杨沙等,2019;赵国良等,2019;郑利江等,2019;余鉴桥等,2020),除非有过套管电阻率测井能够得到评价时刻的地层电阻率(谢关宝等,2012;乐大发等,2013;王旻轲等,2013;路云峰等,2013).图 1是应用常规测井剩余油评价技术获得的某断块油藏2017年度剩余油饱和度分布图,可见依据1967—2014年的测井曲线计算的剩余油饱和度与实际生产时的产水率(一般已经95%以上)无法对应,这是由测井曲线的静态属性决定的.基于测试数据定量计算水淹层含油饱和度(剩余油)的原理主要利用相对渗透率数据,根据产水率与含水饱和度的模型由产水率来计算水淹层剩余油饱和度(张庆国等,2014;惠钢等,2016;牟立伟等,2016).这种方法具有动态的特点,只要有单层开发的产水率就可以使用,不受混合液电阻率的干扰,但没有投产后的产水率数据就无法使用.如果没有生产动态数据,只能依据完井时的测井曲线评价剩余油饱和度,相当于假设完井时刻和评价时刻的剩余油饱和度相等,基本无法真实表征目标层在评价时刻的饱和度分布情况(徐锦绣等,2018;朱学娟等,2018).综合以上,基于测井曲线、生产动态资料的常规剩余油饱和度评价存在不等时性,即测井、开发和评价时刻不等,在某一评价时刻绘制的剩余油饱和度等值线图不能准确反映油水的空间分布特征,不同时刻的剩余油饱和度的对比也无法有效判断当前时刻开发方案的效果,也无法指导之后开发方案的调整(黄玉珍等,2016;丁圣和周志峰,2016;李坤,2017;谢莹峰,2017;黄洪奎,2017;白松涛等,2017;张海光,2018;张婷,2018).因此,急需开发一种等时的剩余油饱和度动态评价方法.

|
图 1 常规水淹层测井评价2017年剩余油饱和度等值线图 测井时刻分布在1967—2014年之间,明显超前于评价时刻,依据测井曲线估算剩余油饱和度(井旁红色标注)推算的产水率比目前的产水率低很多. Fig. 1 Contours of remaining oil saturation in 2017 evaluated by logging in conventional water- flooding layers Logging moments are in 1967—2014, ahead of evaluation moment. Water-bearing rates calculated by remaining oil saturation estimated from logging curves (red marks beside wells) are much lower than those at present. |
针对常规剩余油饱和度评价存在的测井、开发和评价时刻的不等时问题,以地质和工程资料为约束,在定性判别水淹后,依据水淹和在产情况划分了未投产未水淹、未投产水淹、在产水淹、在产未水淹4种情况,基于测井和生产动态资料建立了一种等时剩余油饱和度动态评价方法,并在某断块油藏的剩余油饱和度评价中考察了应用效果.
1 等时剩余油饱和度动态评价方法方法原理就是在地质和工程约束下,立足评价时刻的测井、开发、测试以及岩心分析资料定性判别水淹,在产地层依据产水率基于相对渗透率数据计算剩余油饱和度,不在产而测井与评价时刻等时的井层应用常规水淹层剩余油评价技术计算剩余油饱和度,不在产而测井与评价时刻不等时的井层应用邻井的剩余油饱和度插值确定剩余油饱和度,最终得到时间推移的等时剩余油饱和度动态分布.
图 2为等时剩余油饱和度动态评价方法的技术路线图.首先,依据测井、试油试水、生产开发、注水开发等资料,基于地质和工程约束定性判别开发区块中的单井、单层在评价时刻是否水淹.其次,按评价时刻在产、不在产以及水淹、未水淹分为4种情况评价剩余油饱和度:未水淹在产的井层,根据相对渗透率实验数据得到的产水率和含水饱和度统计模型为基础,依据产水率(评价时刻)得到剩余油饱和度;未水淹不在产的井层,使用电阻率曲线估算剩余油饱和度(原始含油饱和度);水淹在产的井层,依据产水率计算剩余油饱和度;水淹不在产地层,有评价时刻的测井数据的,即测井时刻与评价时刻等时,则用水淹层的常规评价技术评价剩余油饱和度.若不等时,则根据油、水井分布关系、邻井受效情况以及邻井的剩余油饱和度插值估算剩余油饱和度.最后,依据单井单层计算剩余油饱和度绘制等时剩余油饱和度分布图,不同时刻的等时剩余油饱和度对比可以描述剩余油动态分布特征.

|
图 2 等时剩余油饱和度动态评价方法技术路线图 Fig. 2 Flow chart showing method for dynamic evaluation of isochronous remaining oil saturation |
可见,方法实施时仍然需要使用水淹层定性识别技术、水淹层剩余油饱和度评价技术,但是强调了测井、开发和评价时刻的等时性.同时,考虑到了地质和工程约束,特别是会根据油井、水井的分布、生产措施的调整(如油层转注)以及注水受效关系定性识别水淹情况.对于没有与评价时刻等时的测井、生产动态资料的情况,应用邻井剩余油饱和度插值的方式估算出剩余油饱和度.所有这些措施保证了剩余油饱和度评价的等时性.
2 水淹层定性识别方法在地质和工程约束下,由测井响应特征、产水率以及注水受效情况分析综合判断水淹情况.其中:地质约束主要是通过连井剖面确立地层的格架,工程约束则是通过油井、水井的分布、注水后产油井的产液量等受效情况来判断未在产井层的水淹情况.
2.1 测井识别方法油层水淹后,由于注入水的注入会导致泥质含量、孔隙度、混合液矿化度、含油饱和度等地质参数的变化,自然会导致自然伽马、声波时差、电阻率等测井响应的变化.因此,可以利用测井响应特征来分析识别水淹层(张玎等,1996;宋子齐等,2003;李振英,2004;李桢等,2006;刘洋,2017;郑利江等,2019).由于测井曲线是静态的,只有测井时刻和评价时刻相同,才能用测井曲线识别水淹.
目前,通常的做法是通过"对子井"来认识水淹后不同水淹阶段的测井响应特征.所谓的"对子井"由同一层处于未水淹、弱水淹、中等水淹、强水淹阶段几口井构成,可以通过对比自然伽马、声波时差、电阻率等测井响应来考察不同水淹阶段测井响应的变化,最终可以基于交会图法、主成分分析等模式判别方法建立水淹级别的测井判别方法(韩学辉等,2011;牟立伟等,2016;张姮妤等,2016;张俊等,2016).其中,最具决定性意义的主要是电阻率测井.当注水为咸污水,随着注水的进行,水淹层电阻率会因为混合液电阻率以及含油饱和度减小而单调下降,比较容易根据电阻率判别水淹阶段.当注入水为淡水时,随着注水的进行,水淹层电阻率会因为混合液电阻率的上升(导致电阻率变大)以及含油饱和度减小(导致电阻率变小)而出现初期电阻率下降而后期电阻率上升的"U"型或者"S"型变化(杨景强等,2006),容易将强水淹层误判为未水淹或者弱水淹,比较困难(韩学辉等,2012).混合液电阻率不仅是应用测井识别水淹层的难点所在,也是应用测井定量评价饱和度的困难所在.图 3为某断块淡水水淹油藏沙二段6号层"对子井"测井响应特征对比, 表 1给出了不同水淹阶段的电阻率等测井响应特征.对比发现,电阻率较其他测井响应特征的变化趋势更加明显:从未水淹到强水淹的过程中,电阻率先不断减小,当到达强水淹时又出现增大的情况.图 4为基于岩心的相对渗透率以及电阻率联测的水淹层电阻率机理实验结果,显示随着淡水水淹的进行,混合液电阻率和含水饱和度不断变大,导致电阻率出现了"S"型变化,与表 1的电阻率随水淹的变化情况一致.

|
图 3 某断块水淹层"对子井"测井响应特征 (a) 未水淹层测井响应;(b) 弱水淹层测井响应;(c) 中水淹层测井响应;(d) 强水淹层测井响应. Fig. 3 Logging response features of well pairs in a water-flooding fault block (a) Logging responses of originanl layer; (b) Logging responses of weak water flooded layer; (c) Logging responses of medium water flooded layer; (d) Logging responses of strong water flooded layer. |
|
|
表 1 不同水淹阶段测井响应对比 Table 1 Comparison of logging response in different watered-out stages |

|
图 4 某断块砂岩储层电阻率水淹测井响应机理实验结果 (a) 饱和度与混合液矿化度交会图;(b) 饱和度与产水率交会图;(c) 饱和度与岩心电阻率交会图. Fig. 4 Experiment results of resistivity watered-flooding logging response mechanism in sandstone of a fault block (a) Cross plot of saturation with salinity of mixed formation water; (b) Cross plot of saturation with water cut; (c) Cross plot of saturation with resistivity of core. |
注水开发过程中,产水率会随着水淹而不断的升高,可以根据产水率的变化趋势来判断发生水淹的时间.图 5显示,A井油层的测井时间为1979年6月,投产初期不产水.1982年6月,产油量开始下降,显示地层能量不足.临近的注水井于1983年3月开始注水,1983年12月,产液量开始上升,显示已经注水受效,进入水淹阶段.1984年10月,产水率已经达到60%以上,进入中等水淹阶段.1985年6月,产水率已经达到90%,已经进入强水淹阶段.这种依据生产动态的产水率识别水淹的方法是比较可靠的,也能够依据生产动态曲线了解油井剩余油饱和度和产水率的动态变化.

|
图 5 A井1979年6月—1992年3月生产动态图 Fig. 5 Production performance of well A in June 1979 to March 1992 |
测井和生产动态识别方法使用的前提是测井、开发和评价时刻等时,对于某些在评价时刻既没有测井曲线也没有生产动态资料的井层,通过地质和工程约束来获得水淹的判断.具体做法如下:研究整体构造和沉积特征,分析油、水井分布关系,针对研究层位建立待评价井、已经投产或试油试采的老井、注水井的连井剖面,结合邻井同层的水淹情况判断是否水淹.图 6是X断块油藏的实例,可见:油井B位于断块油藏边缘,附近没有注水井,应未发生水淹;油井C临近的油井D已经水淹,并且C油井位于注水井E和油井D之间,判定C井已经水淹.

|
图 6 基于地质和工程约束的水淹识别方法 Fig. 6 Identification method of water flooding based on geology and engineering constraints |
在上述水淹定性识别后,根据开发及水淹情况将井层分为4种情况:未水淹在产井层、未水淹不在产井层、水淹在产井层、水淹不在产井层.每种情况采用对应的方法做饱和度的评价.其中,在产的井层,无论水淹与否,都依据相对渗透率数据得到的产水率和含水饱和度统计模型为基础,利用评价时刻的产水率得到剩余油饱和度(未水淹实际上为原始含油饱和度).因此,饱和度的评价实际上是3种情况.
3.1 在产井层剩余油饱和度评价方法对于在产的井层,无论水淹与否,均有生产动态提供的产油量、产水量以及产水率资料.生产动态数据是动态资料,它能够实时、直观地反映地层中的流体饱和度.对于正在开发的水淹地层,生产动态资料与实验数据较为充足,使用产水率直接估算含水饱和度有其独有的优势,不像应用测井资料评价剩余油饱和度需要面对混合液电阻率无法精确计算的难题(李振英,2004;陈四平等,2004;张斌成等,2005;杨景强等,2009;张占松和张超谟,2011;韩学辉等,2014;张庆国等,2006;李闯等,2018;赵军等,2019).图 7为根据生产动态的产水率数据评价含水饱和度方法的工作流程图.具体做法是根据相对渗透率实验,绘制产水率与含水饱和度的交会图(图 4b)并统计得到由产水率计算含水饱和度的实验统计模型,然后可以根据生产动态的产水率估算得到含水饱和度,最终算出剩余油饱和度(图 8).需要说明:该井于2000年测井,而开发时间是2009年,不能够用静态的测井曲线评价2000年后的剩余油饱和度,依据生产动态则可以很方便地得到2009年后任意在产时刻的剩余油饱和度.

|
图 7 利用生产测试资料定量估算水淹层剩余油饱和度的工作流程图 Fig. 7 Flow chart of estimating residual oil saturation in water-flooding layer using production test data |

|
图 8 某井由生产动态月报产水率估算得到的含油饱和度及其动态变化 Fig. 8 Dynamic change of oil saturation estimated by monthly production report of water-bearing rates in a well |
对于未水淹不在产的井层,油层的含水饱和度保持了原始状态,可以使用完井测井资料依据Archie公式直接计算原始含油饱和度作为剩余油饱和度.根据Archie公式估算原始含水饱和度的公式,有:

|
(1) |
式中,Sw为含水饱和度,小数;RI为电阻率增大系数,单位为Ωm;Rw为地层水电阻率,单位为Ωm;Rt为地层电阻率,单位为Ωm;φ为孔隙度, 小数;F为地层因素, 无量纲数;m为胶结指数,无量纲数;n为饱和度指数,无量纲数.
3.3 水淹未在产井层剩余油饱和度评价方法水淹不在产,有评价时刻的测井曲线的,即测井时刻与评价时刻等时,则用常规水淹层评价技术评价剩余油饱和度.若不等时,则根据油、水井分布关系、邻井受效情况以及邻井的剩余油饱和度插值计算剩余油饱和度(郭元岭和鲁国明,1996;郭元岭和苏国英,1998).
测井评价水淹层剩余油饱和度的主要依据仍然以Archie等电阻率方程为主.具体到水淹层,最大的问题就是混合液的电阻率的确定.有关混合液电阻率的确定方法可以使用一种混合液电阻率、饱和度、产水率三参数迭代方法(图 9).该方法可以同时输出最后的混合液电阻率、含水饱和度以及产水率(贺顺义等,2010;张铁轩,2010;刘江等,2013;高华美,2013;韩学辉等,2014).其中,有关混合液电阻率的确定是基于实验确定的产水率和混合液矿化度的统计关系得到的(图 10).

|
图 9 开发未水淹层剩余油饱和度评价流程图 Fig. 9 Flow chart of evaluating residual oil saturation in development of non-water-flooding layer |

|
图 10 产水率与混合液矿化度交会图 Fig. 10 Cross plot of water production rate and mineralization degree of mixed liquid |
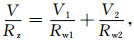
实验以外,也可以应用理论计算混合液电阻率.吴长虹、王美珍等介绍了应用自然电位曲线计算混合液电阻率的方法(吴长虹等,2000;王美珍和俞军,2007).邹长春等提出了一种并联模型(邹长春等,1999),将电解质溶液混合后电阻率写为:
|
(2) |
式中,Rw1、Rw2、Rz分别是第一、二种溶液和混合液的电阻率,单位为Ωm; V1、V2、V分别是第一、二种溶液和混合液的体积,单位为m3.
邹长春、杨景强、张超谟等将该并联模型做了改进(杨景强等,2006;张超谟等,2008),将混合溶液电阻率写为:

|
(3) |
式中, T是一个经验常数, 根据实验数据的计算结果, T近似为0.2.
秦菲莉等(2002)、方鹏(2011)基于物质平衡法给出了混合液电阻率确定方法.其中,确定混合液电阻率的方法如下:
(1) 设驱替一段时间后,含水饱和度达到了Sw,设原始束缚水饱和度为Swi,则此过程中注入的水量为:

|
(4) |
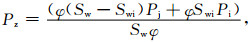
(2) 混合液的矿化度Pz可通过式(5)得到:
|
(5) |
式中,Pj为注入水的矿化度,单位为mg·L-1; Pi为注入水的矿化度,单位为mg·L-1.
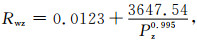
(3) 根据Pz可以求得地层混合液电阻率Rwz:
|
(6) |
式中求得的电阻率Rwz为标准温度(24 ℃)下的电阻率.
同时,以此为基础还衍生出了多倍注入水的物质平衡法、变倍数多倍注入水的物质平衡法等(方鹏,2011),这些理论方法都可以取得一定的成效.其中,变倍数多倍注入水的物质平衡法等实际应用效果更好一些,本文在没有实验刻度的水淹层采用该方法计算混合液的电阻率.
4 等时剩余油饱和度评价方法在某断块油藏的应用应用上述方法,对某断块油藏开展了水淹层定性识别、剩余油饱和度的估算,最终绘制了该断块油藏开发以来6个典型时刻的等时剩余油饱和度等值线图(图 11).

|
图 11 某断块油藏等时剩余油饱和度评价方法效果图 (a) 某层1980年剩余油饱和度分布等值线图;(b) 某层1990年剩余油饱和度分布等值线图;(c) 某层2000年剩余油饱和度分布等值线图;(d) 某层2005年剩余油饱和度分布等值线图;(e) 某层2010年剩余油饱和度分布等值线图;(f) 某层2018年剩余油饱和度分布等值线图. Fig. 11 Evaluation results of isochronous residual oil saturation in reservoirs of a fault block (a) Contour map of remaining oil saturation of some layer in 1980; (b) Contour map of remaining oil saturation of some layer in 1990; (c) Contour map of remaining oil saturation of some layer in 2000; (d) Contour map of remaining oil saturation of some layer in 2005; (e) Contour map of remaining oil saturation of some layer in 2010; (f) Contour map of remaining oil saturation of some layer in 2018. |
开发资料显示,涉及目的层段注水的井共有13口(图中蓝色标识的井,同时标明注水时间).注水时间最早为1983年,因此可以判断1983年以前该断块油藏均未发生水淹,图 11a显示了1980年原始含油饱和度分布图,可见从东南向西北方向含油饱和度逐渐增高,与实际的油藏的东南低和西北高的地势相对应.图 11b—f显示了1983年注水以后5个典型时刻的不同水淹阶段的等时剩余油饱和度分布特征,显示从西南角向东北角呈现一个"舌进"形态的水淹,与注水从西南到东北方向逐渐开始的情况相符合.断块中,最先发生水淹的油井是X48-X28井,在最早的注水井Y72-44井附近.随着不同年代的注水井的依次增加,注水作业使得水淹范围不断增大,受效程度不断加深,剩余油饱和度分布与注水井在时间(注水起始时间和截止时间)和空间上的对应关系比较明晰,最终呈现出向东北角突进的"舌进"趋势(图 11b—f).从注水有效性看,位于东北角的注水井X48X27于2000年开始启用,但是对X48X43井影响不大,X48X43井并未水淹.从目前情况看,该断块油藏的西部以及东北角处仍然有剩余油未动用,有待开发.
5 结论与认识研究开发了一种动静态结合的等时剩余油饱和度动态评价方法,并在某断块油藏开展了应用.有以下结论和认识:
(1) 基于测井曲线、测试资料的常规剩余油饱和度评价存在不等时性,即测井、开发和评价时刻不等,导致在某一评价时刻绘制的剩余油饱和度等值线图不能准确反映油水的空间分布特征,不同评价时刻的等值线图对比也不能反映油水的动态变化以及开发效果.
(2) 结合测井剩余油评价以及测试资料的产水率计算剩余油饱和度的技术特点,可将研究目的层划分为未投产未水淹井层、未投产水淹井层、在产水淹井层、在产未水淹井层4种情况,立足评价时刻的测井、开发、测试、以及岩心分析资料,在地质和工程约束下分别应用测井资料、生产动态资料开展水淹层识别和剩余油饱和度的评价.
(3) 为了保证测井、开发和评价时刻的等时性,在产的井层依据产水率基于相对渗透率实验数据计算剩余油饱和度,不在产而测井与评价时刻等时的井层应用常规水淹层剩余油评价技术计算剩余油饱和度,不在产而测井与评价时刻不等时的井层应用邻井的剩余油饱和度插值确定剩余油饱和度.
(4) 这种由测井、生产动态实测资料计算得到时间推移的剩余油饱和度分布的方法,可以动态反映油藏注入开发后的饱和度变化,评价开发的效果和指导后续开发方案调整.方法上,与以往数值模拟的做法有很大的不同,更便于没有石油工程背景的开发地质人员依据测井曲线和生产动态开展剩余油饱和度分布以及动态演化研究.
致谢 感谢审稿专家提出的建设性修改意见.
Bai S T, Wang J B, Yang R X, et al. 2017. Summary on formation water resistivity evaluation methods. Progress in Geophysics (in Chinese), 32(2): 566-578. |
Cheng S P, Li M Y, Zhong Y H. 2004. Advances of well logging technology in residual oil saturation. Well Logging Technology (in Chinese), 28(1): 7-10. |
Ding C Q. 2008. Geophysics Well Logging (in Chinese). Dongying: China University of Petroleum Press: 203-205.
|
Ding S, Zhou Z F. 2016. Quantitative evaluation of water flooded layer based on modified Archie model. Fault-Block Oil and Gas Field (in Chinese), 23(5): 599-602. |
Ding Y. 2014. A research of logging evaluation method for water flooded layer of L field [Master′s thesis] (in Chinese). Wuhan: Yangtze University.
|
Fang P. 2011. Log evaluation and method research of water flooded reservoir [Master′s thesis] (in Chinese). Qingdao: China University of Petroleum (East China).
|
Gao H M. 2013. Study of log interpretation methods after polymer flooding [Master′s thesis] (in Chinese). Daqing: Northeast Petroleum University.
|
Guo Y L, Lu G M. 1996. Regional linear model of water cut vs. water saturation in watered-out zone and its application. Oil & Gas Recovery Techinology (in Chinese), 3(2): 45-49. |
Guo Y L, Su G Y. 1998. An analysis of factors affecting the precision of log interpretation of water cut in a watered out reservoir. Petroleum Exploration and Development (in Chinese), 25(4): 59-61. |
Han X H, Cui Y F, Li F B, et al. 2012. Classification and conventional logging identification of inhomogeneous reservoir in DB gas field. Progress in Geophysics (in Chinese), 27(1): 186-192. |
Han X H, Cui Y F, Li X L, et al. 2014. Identification methods of watered-out layer after polymer flooding in Guantao reservoir of the West seventh region in Gudong oilfield. Progress in Geophysics (in Chinese), 29(4): 1657-1665. DOI:10.6038/pg20140422 |
Han X H, Zhi L F, Li F B, et al. 2011. Fluid property recognization in Es4 reservoir of Dongxin oilfield with the application of Bayes stepwise discriminant method. Progress in Geophysics (in Chinese), 26(4): 1243-1248. DOI:10.3969/j.issn.1004-2903.2011.04.015 |
He S Y, Xie N, Peng H B, et al. 2010. Identification and evaluation of water flooded zones with logging data and its application. Offshore Oil (in Chinese), 30(2): 91-95. |
Hong Y M. 2008. Logging Data Processing and Comprehensive Interpretation (in Chinese). Dongying: China University of Petroleum Press: 165-195.
|
Huang H K. 2017. The well logging evaluation study of fresh water flooded layer in the N region [Master′s thesis] (in Chinese). Qingdao: China University of Petroleum (East China).
|
Huang Y Z, Kou X P, Jin W H. 2016. Flooded layer recognition on the basis of conventional logging methods. Petrochemical Industry Technology (in Chinese), 23(9): 170-171. |
Hui G, Wang Y J, Yan L H, et al. 2016. Method for water-flooded layer evaluation in extra-low permeability reservoir in WY block of AS oilfield flooded by fresh-water. Journal of Southwest Petroleum University (Science & Technology Edition) (in Chinese), 38(6): 138-146. |
Jia G W. 2018. Water flooded formation identification based on conventional logging methods. Petrochemical Industry Technology (in Chinese), 25(7): 209. |
Li C, Yang Q S, Lu Y, et al. 2018. Log interpretation method for Water-flooded layer based on petrophysical facies. Well Logging Technology (in Chinese), 42(5): 562-567. |
Li K. 2017. The integrated application of new and old logging technology in the old oilfield water flooding method [Master′s thesis] (in Chinese). Jingzhou: Yangtze University.
|
Li Z, Luo M, Yang X, et al. 2006. Review of logging interpretation methods for water-flooded layer. Chinese Journal of Engineering Geophysics (in Chinese), 3(4): 288-294. |
Li Z Y. 2004. Research on logging interpretation measure about water-flooded [Master′s thesis] (in Chinese). Chengdu: Southwest Petroleum University.
|
Liu J, Li G J, Liu J Y, et al. 2013. High-watercut-late-stage interpretation difficulties and direction of water-flooded-layer loggings. Petroleum Geology & Oilfield Development in Daqing (in Chinese), 32(3): 126-130. |
Liu Y. 2017. Study on logging interpretation technique of complex oil and water layers of Chunguang oilfield [Master′s thesis] (in Chinese). Chengdu: Southwest Petroleum University.
|
Lu Y F, Yang X G, Zhao Y, et al. 2013. Application of through casing resistivity logging in evaluation of remaining oil in Chang 6 reservoir of Dalugou 2 area. World Well Logging Technology (in Chinese), 34(1): 50-52. |
Ma Y. 2018. Research on logging interpretation measure about low permeability water-flooded in S block [Master′s thesis] (in Chinese). Daqing: Northeast Petroleum University.
|
Mao Y D. 2018. Study on the qualitative identification method of water flooded layer in F block [Master′s thesis] (in Chinese). Daqing: Northeast Petroleum University.
|
Mu L W, Zhang M L, Yan X. 2016. Application of BP neural network in identification of water flooded layer in low porosity and permeability reservoirs. Contemporary Chemical Industry (in Chinese), 45(7): 1586-1588, 1592. |
Qin F L, Li J Q, Fu Y C. 2002. Determination of resistivity of mixed liquid after water injection in Oilfield. World Well Logging Technology (in Chinese), 17(4): 29-30. |
Song Z Q, Zhao L, Wang R F, et al. 2003. Recognizing watered-out zones by using traditional well logs. Journal of Xi'an Petroleum Institute (Natural Science Edition) (in Chinese), 18(6): 50-53. |
Sun J M, Wang K W, Li W. 2008. Development and analysis of logging saturation interpretation models. Petroleum Exploration and Development (in Chinese), 35(1): 101-107. |
Sun Y S, Liu H Q, Tian J, et al. 2019. Application of PNN logging in water flooded layer in Yuejin oilfield. Progress in Geophysics (in Chinese), 34(3): 1105-1112. DOI:10.6038/pg2019CC0171 |
Wang M K, Luo M G, Liang C G, et al. 2013. Through casing resistivity logging technology and its application in Gudao oilfield. Application of cased hole resistivity logging technology in water. World Well Logging Technology (in Chinese), 34(1): 45-49. |
Wang M Z, Yu J. 2007. Using well logging data to determine resistivity of mixed fluid in water flooded layer of Daqing placanticline. Petroleum Geology & Oilfield Development in Daqing (in Chinese), 26(2): 120-122. |
Wu C H, Qu L P, Wang Y J, et al. 2000. Determination of resistivity of mixed fluid in formation during the high water-cut stage. Journal of Jianghan Petroleum Institute (in Chinese), 22(4): 85-87. |
Xie G B, Li S G, Li Y J. 2012. Data pre-processing method for cased hole formation resistivity logging. Science & Technology Review (in Chinese), 30(3): 57-60. |
Xie Y F. 2017. The study on well logging evaluation method of salty water flooded reservoir in W oil field [Master′s thesis] (in Chinese). Qingdao: China University of Petroleum (East China).
|
Xu J X, Zhao S Z, Cheng H B, et al. 2018. Quantitative evaluation of water-flooded zones based on conventional log data in SZ oilfield. Well Logging Technology (in Chinese), 42(4): 401-406. |
Yang J Q, Lu Y, Ma H Y, et al. 2006. On variation regularity of resistivity of mixed formation water in water-flooded zone. Well Logging Technology (in Chinese), 30(3): 195-197. |
Yang J Q, Ma H Y, Liu R H, et al. 2009. Cognitions on some problems in water-flooded layer log evaluation. Well Logging Technology (in Chinese), 33(6): 511-516. |
Yong S H, Zhang C M. 2007. Logging Data Processing and Comprehensive Interpretation (in Chinese). Dongying: China University of Petroleum Press: 533-566.
|
Yu J Q, Liu H Q, Sun Y S, et al. 2020. PNN logging response characteristics and evaluation analysis in E31 reservoir of GS oilfield. Progress in Geophysics (in Chinese), 35(3): 1085-1091. DOI:10.6038/pg2020CC0536 |
Yue D F, Zhang Z F, Song H, et al. 2013. ECOS Through casing resistivity logging technology and its application in Gudao Oilfield. Journal of Oil and Gas Technology (Journal of Jianghan Petroleum Institute) (in Chinese), 35(8): 81-84. |
Zhang B C, Shi X Y, Liu Y, et al. 2005. On conventional log interpretation of water flooded layer and water flooded characteristics. Well Logging Technology (in Chinese), 29(6): 545-547. |
Zhang C M, Zhang Z S, Guo H M, et al. 2009. Theoretical eduction and numerical simulation researches on the relationship between resistivity and water saturation of waterflood oil zone. Science in China Series D: Earth Sciences, 52(S1): 165-170. DOI:10.1007/s11430-009-5011-y |
Zhang D, Mei H, Ran W Q. 1996. Identification of flooded formation with artificial neural network. Well Logging Technology (in Chinese), 20(3): 210-214. |
Zhang H G. 2018. The quantitative evaluation of water-flooded zones and prediction of remaining oil distribution in F block [Master′s thesis] (in Chinese). Daqing: Northeast Petroleum University.
|
Zhang H Y, Gao Q M, Qi X L. 2016. fisher discriminating and analyzing method for thin-and-poor watered-out-oil reservoir. Petroleum Geology & Oilfield Development in Daqing (in Chinese), 35(4): 147-151. |
Zhang J, Wang X G, Huang Y Z, et al. 2016. Analysis and application on freshwater flooding layer logging response of W region. Journal of Shandong University of Technology (Natural Science Edition) (in Chinese), 30(1): 58-62. |
Zhang Q G, Bao Z D, Na W H. 2006. Characteristics of well-logging response to water-flooded reservoir in water-driven oil field. Journal of Daqing Petroleum Institute (in Chinese), 30(4): 101-105, 154. |
Zhang Q G, Song Z B, Liu M M, et al. 2014. On acoustic and resistivity response features of waterflooded layer after polymer flooding. Well Logging Technology (in Chinese), 38(4): 421-424. |
Zhang T. 2018. Comprehensive assessment and effect analysis of well logging in water flooded layer in Su 36-25 reservoir. Petrochemical Industry Technology (in Chinese), 25(4): 153-154. |
Zhang T X. 2010. Well logging residual oil saturation evaluation methods. Science & Technology Review (in Chinese), 28(8): 104-109. |
Zhang Z S, Zhang C M. 2011. Two-step determination method of formation water resistivity in water-flooded zone. Well Logging Technology (in Chinese), 35(4): 340-343. |
Zhao G L, Song Y J, Huang Q Z, et al. 2019. Comprehensive evaluation method of water-flooded layers based on dynamic development data and well logs: a case study from reservoirs in P Block, South Sudan. Progress in Geophysics (in Chinese), 34(1): 266-276. DOI:10.6038/pg2019BB0587 |
Zhao J, Yuan S S, Li W, et al. 2019. Computation method of formation water resistivity for water-out reservoir based on ion-exchange. Progress in Geophysics (in Chinese), 34(2): 676-680. DOI:10.6038/pg2019CC0077 |
Zheng L J, Sun Y L, Che R, et al. 2019. Identification of complex waterflooded layers using PNN+ saturation log data. Well Logging Technology (in Chinese), 43(4): 434-439, 444. |
Zhu X J, Ge X M, Kong X, et al. 2018. Qualitative identification of sandstone water flooded layer by conventional logging curves. Geophysical and Geochemical Exploration (in Chinese), 42(6): 1215-1220. |
Zou C C, Wei Z L, Pan L Z. 1999. An effective method to calculate resistivity of mixing solution. Computing Techniques for Geophysical and Geochemical Exploration (in Chinese), 21(3): 216-219. |
白松涛, 万金彬, 杨锐祥, 等. 2017. 地层水电阻率评价方法综述. 地球物理学进展, 32(2): 566-578. |
陈四平, 李木元, 仲艳华. 2004. 剩余油饱和度测井技术进展. 测井技术, 28(1): 7-10. DOI:10.3969/j.issn.1004-1338.2004.01.002 |
丁次乾. 2008. 矿场地球物理. 东营: 中国石油大学出版社: 203-205.
|
丁圣, 周志峰. 2016. 基于改进型阿奇公式法定量评价水淹层. 断块油气田, 23(5): 599-602. |
丁一. 2014. L油田水淹层测井评价方法研究[硕士论文]. 武汉: 长江大学.
|
方鹏. 2011. 水淹层测井精细评价方法研究[硕士论文]. 青岛: 中国石油大学(华东).
|
高华美. 2013. 聚驱后水淹层测井解释方法研究[硕士论文]. 大庆: 东北石油大学.
|
郭元岭, 鲁国明. 1996. 水淹层含水率与含水饱和度的区域性直线模型及应用. 油气采收率技术, 3(2): 45-49. |
郭元岭, 苏国英. 1998. 水淹油层含水率解释精度影响因素分析. 石油勘探与开发, 25(4): 59-61. DOI:10.3321/j.issn:1000-0747.1998.04.018 |
韩学辉, 崔玉峰, 李峰弼, 等. 2012. DB气田非均质储层级别划分及常规测井识别方法. 地球物理学进展, 27(1): 186-192. |
韩学辉, 崔玉峰, 李林祥, 等. 2014. 孤东油田七区西馆陶组聚驱后水淹层测井识别方法. 地球物理学进展, 29(4): 1657-1665. DOI:10.6038/pg20140422 |
韩学辉, 支乐菲, 李峰弼, 等. 2011. 应用Bayes逐步判别方法识别东辛油田沙四段储层流体性质. 地球物理学进展, 26(4): 1243-1248. DOI:10.3969/j.issn.1004-2903.2011.04.015 |
贺顺义, 谢楠, 彭洪波, 等. 2010. 水淹层测井识别方法研究及效果验证. 海洋石油, 30(2): 91-95. DOI:10.3969/j.issn.1008-2336.2010.02.091 |
洪有密. 2008. 测井原理与综合解释. 东营: 中国石油大学出版社: 165-195.
|
黄洪奎. 2017. N区块淡水水淹层测井评价方法研究[硕士论文]. 青岛: 中国石油大学(华东).
|
黄玉珍, 寇小攀, 金韦华. 2016. 基于常规测井的水淹层识别方法研究. 石化技术, 23(9): 170-171. DOI:10.3969/j.issn.1006-0235.2016.09.123 |
惠钢, 王友净, 闫林辉, 等. 2016. AS油田WY区特低渗透油藏水淹层评价方法. 西南石油大学学报(自然科学版), 38(6): 138-146. |
贾国伟. 2018. 基于常规测井方法的水淹层识别探讨. 石化技术, 25(7): 209. DOI:10.3969/j.issn.1006-0235.2018.07.162 |
李闯, 杨清山, 卢艳, 等. 2018. 基于岩石物理相的水淹层测井解释方法. 测井技术, 42(5): 562-567. |
李坤. 2017. 新老测井技术在老油田水淹层评价中的综合应用[硕士论文]. 荆州: 长江大学.
|
李桢, 骆淼, 杨曦, 等. 2006. 水淹层测井解释方法综述. 工程地球物理学报, 3(4): 288-294. DOI:10.3969/j.issn.1672-7940.2006.04.009 |
李振英. 2004. 水淹层测井解释方法研究[硕士论文]. 成都: 西南石油学院.
|
刘江, 李广菊, 刘江玉, 等. 2013. 高含水后期水淹层测井解释难点及研究方向. 大庆石油地质与开发, 32(3): 126-130. DOI:10.3969/J.ISSN.1000-3754.2013.03.026 |
刘洋. 2017. 春光油田复杂油水层测井解释技术研究[硕士论文]. 成都: 西南石油大学.
|
路云峰, 杨学国, 赵雨, 等. 2013. 过套管电阻率测井在大路沟二区长6储层剩余油评价中的应用. 国外测井技术, 34(1): 50-52. |
马燕. 2018. S区块低渗透水淹层测井解释方法研究[硕士论文]. 大庆: 东北石油大学.
|
毛玉丹. 2018. F区块水淹层定性识别方法研究[硕士论文]. 大庆: 东北石油大学.
|
牟立伟, 张美玲, 颜旭. 2016. BP神经网络在低孔渗储层水淹层识别中的应用. 当代化工, 45(7): 1586-1588, 1592. DOI:10.3969/j.issn.1671-0460.2016.07.079 |
秦菲莉, 李冀秋, 傅阳春. 2002. 油田注水后混合液电阻率的确定. 国外测井技术, 17(4): 29-30. |
宋子齐, 赵磊, 王瑞飞, 等. 2003. 利用常规测井方法识别划分水淹层. 西安石油学院学报(自然科学版), 18(6): 50-53. DOI:10.3969/j.issn.1673-064X.2003.06.013 |
孙建孟, 王克文, 李伟. 2008. 测井饱和度解释模型发展及分析. 石油勘探与开发, 35(1): 101-107. DOI:10.3321/j.issn:1000-0747.2008.01.018 |
孙杨沙, 刘红岐, 田杰, 等. 2019. PNN测井在跃进油田水淹层中的应用. 地球物理学进展, 34(3): 1105-1112. DOI:10.6038/pg2019CC0171 |
王美珍, 俞军. 2007. 用测井资料确定大庆长垣水淹层混合液电阻率. 大庆石油地质与开发, 26(2): 120-122. DOI:10.3969/j.issn.1000-3754.2007.02.030 |
王旻轲, 罗明高, 梁成钢, 等. 2013. 过套管电阻率测井技术在水淹层识别中的应用——以沙南油田沙丘5井区梧桐沟组为例. 国外测井技术, 34(1): 45-49. |
吴长虹, 曲丽萍, 王艺景, 等. 2000. 高含水期地层混合液电阻率的求取方法. 江汉石油学院学报, 22(4): 85-87. DOI:10.3969/j.issn.1000-9752.2000.04.028 |
谢关宝, 李三国, 李永杰. 2012. 过套管电阻率测井资料预处理方法研究. 科技导报, 30(3): 57-60. DOI:10.3981/j.issn.1000-7857.2012.03.009 |
谢莹峰. 2017. W油田盐水水淹层测井评价方法研究[硕士论文]. 青岛: 中国石油大学(华东).
|
徐锦绣, 赵书铮, 陈红兵, 等. 2018. SZ油田基于常规测井资料的水淹层定量评价. 测井技术, 42(4): 401-406. |
杨景强, 卢艳, 马宏宇, 等. 2006. 水淹层地层水电阻率变化规律研究. 测井技术, 30(3): 195-197. DOI:10.3969/j.issn.1004-1338.2006.03.002 |
杨景强, 马宏宇, 刘如红, 等. 2009. 对水淹层测井评价中几个问题的认识. 测井技术, 33(6): 511-516. DOI:10.3969/j.issn.1004-1338.2009.06.003 |
雍世和, 张超谟. 2007. 测井数据处理与综合解释. 东营: 中国石油大学出版社: 533-566.
|
余鉴桥, 刘红岐, 孙杨沙, 等. 2020. GS油田E31油藏水淹层PNN测井响应特征与评价分析. 地球物理学进展, 35(3): 1085-1091. DOI:10.6038/pg2020CC0536 |
乐大发, 张振芳, 宋红, 等. 2013. ECOS过套管电阻率测井技术及其在孤岛油田的应用. 石油天然气学报(江汉石油学院学报), 35(8): 81-84. |
张斌成, 石晓燕, 刘瑛, 等. 2005. 水淹层测井综合解释及水淹特性研究. 测井技术, 29(6): 545-547. DOI:10.3969/j.issn.1004-1338.2005.06.021 |
张超谟, 张占松, 郭海敏, 等. 2008. 水驱油电阻率与含水饱和度关系的理论推导和数值模拟研究. 中国科学D辑: 地球科学, 38(S2): 151-156. |
张玎, 梅红, 冉文琼. 1996. 应用人工神经网络识别水淹层. 测井技术, 20(3): 210-214. |
张海光. 2018. F区块水淹层定量评价与剩余油分布[硕士论文]. 大庆: 东北石油大学.
|
张姮妤, 高庆冕, 齐秀丽. 2016. 薄差水淹层Fisher判别分析方法. 大庆石油地质与开发, 35(4): 147-151. DOI:10.3969/J.ISSN.1000-3754.2016.04.029 |
张俊, 王向公, 黄玉珍, 等. 2016. W区块淡水水淹层测井响应特性分析及其应用. 山东理工大学学报(自然科学版), 30(1): 58-62. DOI:10.3969/j.issn.1672-6197.2016.01.013 |
张庆国, 鲍志东, 那未红. 2006. 注水开发油田水淹油层测井响应特征. 大庆石油学院学报, 30(4): 101-105, 154. |
张庆国, 宋增彬, 刘茗茗, 等. 2014. 聚驱后水淹层声电响应特征研究. 测井技术, 38(4): 421-424. DOI:10.3969/j.issn.1004-1338.2014.04.009 |
张铁轩. 2010. 剩余油饱和度的测井评价方法. 科技导报, 28(8): 104-109. |
张婷. 2018. 苏36-25水淹层测井综合评价及效果分析. 石化技术, 25(4): 153-154. DOI:10.3969/j.issn.1006-0235.2018.04.121 |
张占松, 张超谟. 2011. 水淹层地层水电阻率的二步确定方法. 测井技术, 35(4): 340-343. DOI:10.3969/j.issn.1004-1338.2011.04.009 |
赵国良, 宋延杰, 黄奇志, 等. 2019. 基于开发动态的水淹层测井综合评价方法——以南苏丹P区块为例. 地球物理学进展, 34(1): 266-276. DOI:10.6038/pg2019BB0587 |
赵军, 袁淞珊, 李维, 等. 2019. 基于离子交换的水淹层地层水电阻率计算方法. 地球物理学进展, 34(2): 676-680. DOI:10.6038/pg2019CC0077 |
郑利江, 孙雅琳, 车蓉, 等. 2019. PNN+饱和度测井复杂水淹层识别. 测井技术, 43(4): 434-439, 444. |
朱学娟, 葛新民, 孔雪, 等. 2018. 砂泥岩水淹层的常规测井曲线定性识别方法. 物探与化探, 42(6): 1215-1220. |
邹长春, 尉中良, 潘令枝. 1999. 计算混合液电阻率的一种有效方法. 物探化探计算技术, 21(3): 216-219. DOI:10.3969/j.issn.1001-1749.1999.03.005 |