2. 北京大学理论与应用地球物理研究所, 北京 100871;
3. 地震动力学国家重点实验室, 中国地震局地质研究所, 北京 100029;
4. 河北红山地球物理国家野外科学观测研究站, 北京大学, 北京 100871;
5. 中国地震局地震预测研究所, 北京 100036
2. Institute of Theoretical and Applied Geophysics, Peking University, Beijing 100871, China;
3. State Key Laboratory of Earthquake Dynamics, Institute of Geology, China Earthquake Administration, Beijing 100871, China;
4. Hebei Hongshan Geophysical National Observation and Research Station, Peking University, Beijing 100871, China;
5. Institute of Earthquake Prediction, China Earthquake Administration, Beijing 100036, China
据中国地震台网正式测定,2021年5月21日21时48分,在云南大理州漾濞县发生6.4级地震(简称漾濞地震),震中北纬25.67°,东经99.87°,震源深度8 km.极震区烈度高达Ⅷ度(8度),Ⅵ度(6度)区及以上面积约6600 km2,造成大理州56个乡镇受灾(云南省地震局,http://www.yndzj.gov.cn/).截至2021年5月24日9时,共发生3.0级以上余震31次,其中5.0~5.9级2次,4.0~4.9级8次,3.0~3.9级21次(国家地震数据中心,https://data.earthquake.cn/).
中国地震局地球物理研究所利用全球台网数据得到了漾濞地震P波初动震源机制解,断层节面Ⅰ:走向141°/倾角68°/滑动角-153°,节面Ⅱ:走向40°/倾角65°/滑动角-24°,初步判断此次事件为走滑兼正断型地震(郭祥云等,http://www.cea-igp.ac.cn/kydt/278248.html).另外,利用区域地震台网记录采用CAP方法反演得到的震源机制解断层节面Ⅰ:走向138°/倾角82°/滑动角-161°,节面Ⅱ:走向45°/倾角71°/滑动角-8°,最佳矩心深度为5 km(韩立波等,http://www.cea-igp.ac.cn/kydt/278248.html).余震精定位初步结果(房立华等,http://www.cea-igp.ac.cn/kydt/278248.html)显示余震序列呈北西向分布,发震断层向西南倾斜,余震主要集中在6~15 km深度.
漾濞地震震中位于维西—乔后断裂南段(F1,图 1a).该断裂位于川滇菱形块体西部边缘,北接金沙江断裂(F2,图 1a)、南连红河断裂(F3,图 1a),晚第四纪以来表现为右旋走滑运动特征(常祖峰等, 2016a, b).该断裂附近曾发生过2013年洱源MS5.5地震(常祖峰等,2014)以及2017年漾濞M5.1地震,此次漾濞M6.4地震是该断裂附近有记载以来震级最大的一次地震.

|
图 1 (a) 漾濞MS6.4地震的大地构造背景以及大地电磁测点分布.活动断裂(徐锡伟等,2016)以黑线表示,其中F1:维西—乔后断裂;F2:金沙江断裂;F3:红河断裂.川滇菱形块体由黑色粗线所围限.红色五角星代表漾濞地震.黑色线框所示为子图(b)的经纬度范围. (b)震源区附近的大地电磁宽频带阵列台站(黑色三角所示),红色五角星代表漾濞地震,震源机制解为中国地震局地球物理研究所韩立波等人的结果(http://www.cea-igp.ac.cn/kydt/278248.html).地震烈度资料据云南省地震局http://www.yndzj.gov.cn/. Fig. 1 (a) Tectonic background of the Yangbi MS6.4 earthquake and distribution of the magnetotelluric data in western Yunnan. Black lines represent active faults (Xu et al., 2016), where F1: Weixi-Qiaohou fault; F2: Jinshajiang fault; F3: Red River fault. The bold black diamond shows the Yunnan-Sichuan block. The red star indicates the location of Yangbi MS6.4 earthquake. The black rectangle is the region shown in Figure 1b. (b) Distribution of broadband magnetotelluric array (black triangles) near the focal area. The focal mechanism shown in beach ball is quoted from Institute of Geophysics, China Earthquake Administration (http://www.cea-igp.ac.cn/kydt/278248.html). Map of the Earthquake intensity distribution is quoted from the Yunnan Seismological Bureau, http://www.yndzj.gov.cn/. |
此次地震地震烈度线呈现NNW向的椭圆形分布(图 1b,云南省地震局,http://www.yndzj.gov.cn/),郭祥云等人的震源机制解结果节面Ⅰ为NW向(http://www.cea-igp.ac.cn/kydt/278248.html), 二者均与维西—乔后断裂走向基本一致.然而,此次地震的地震序列发生在维西—乔后断裂西侧,并未直接发生在该断层上.张旭等人的地震破裂过程初步反演结果显示漾濞地震没有破裂到地表(http://www.cea-igp.ac.cn/kydt/278248.html).基于这些资料推测漾濞地震的发震构造是维西—乔后断裂西南侧的北西向右旋走滑型隐伏断裂.该隐伏断裂是如何运动与变形的?是如何孕育和发生漾濞地震的?亟待深入研究.
震源区深部结构能够提供有关地震深部孕育环境以及发震机制等重要信息.漾濞地震发生后,我们基于2017年前后在滇西地区布设的宽频带大地电磁测深阵列台站数据(图 1a)获得的三维地壳电阻率结构,迅速开展了漾濞地震震源区三维深部孕震电性结构回溯分析,进而探讨了漾濞MS6.4地震的发震机制.
1 方法与数据由于岩石矿物成分和结构的不同,壳幔岩石电阻率会在较大范围内变化(石应骏等,1985);同时由于地球内部高温高压条件下出现的物理化学过程(如相变脱水,部分熔融等),岩石中的流体也会对电阻率产生重要影响(Unsworth et al., 2005),因此岩石电阻率是描述地球深部结构和状态的重要参数.大地电磁测深法是研究地壳和上地幔电阻率分布规律的一种地球物理探测方法(Tikhonov, 1950;Cagniard, 1953).它以天然交变电磁场为场源,当交变电磁场以扩散场的形式在地下介质中传播时,由于电磁感应作用,地面电磁场的观测值将包含地下介质电阻率分布的信息.而且,由于电磁场的趋肤效应,不同周期的电磁场信号具有不同的穿透深度,因此,研究大地对天然电磁场的频率响应,可获得地下不同深度介质电阻率分布的信息.该方法具有对地球内部温度、熔融以及含盐水流体敏感等优点,已成为地球深部探测方法中的一个重要分支.尤其是近年来随着大地电磁三维反演解释技术的发展,其应用效果进一步得到显著提升,在中国大陆地震活动区的三维深部电性结构研究中已取得良好的应用效果(Zhang et al., 2016; Cai et al., 2017; Ye et al., 2018, 2020; Cheng et al., 2019; Sun et al., 2020).
2017年前后,我们在红河断裂以西的整个滇西地区布设了宽频带大地电磁阵列台站(图 1a),观测范围覆盖腾冲地块、保山地块以及这次漾濞地震所在的大理州地区.野外数据观测采用了德国Metronix公司GMS-07e和加拿大Pheonix公司V5-2000系统,观测点采用标准“十”字型电磁场5分量测量方式,记录2个水平电场分量(Ex,Ey)以及3个正交磁场分量(Hx,Hy,Hz)(x-地理北,y-地理东,z-垂向).每个台站数据观测时间均为40 h左右,观测过程中采用仪器自带的GPS进行了同步.对采集的时间序列使用仪器配备的商用数据处理软件Mapros以及SSMT2000进行人工噪音剔除、快速傅里叶变换(FFT)以及带远参考技术的Robust传输函数估计(Gamble et al., 1979; Jones et al., 1989),最终获得了滇西地区较高置信度的阻抗以及倾子等频率域大地电磁资料.
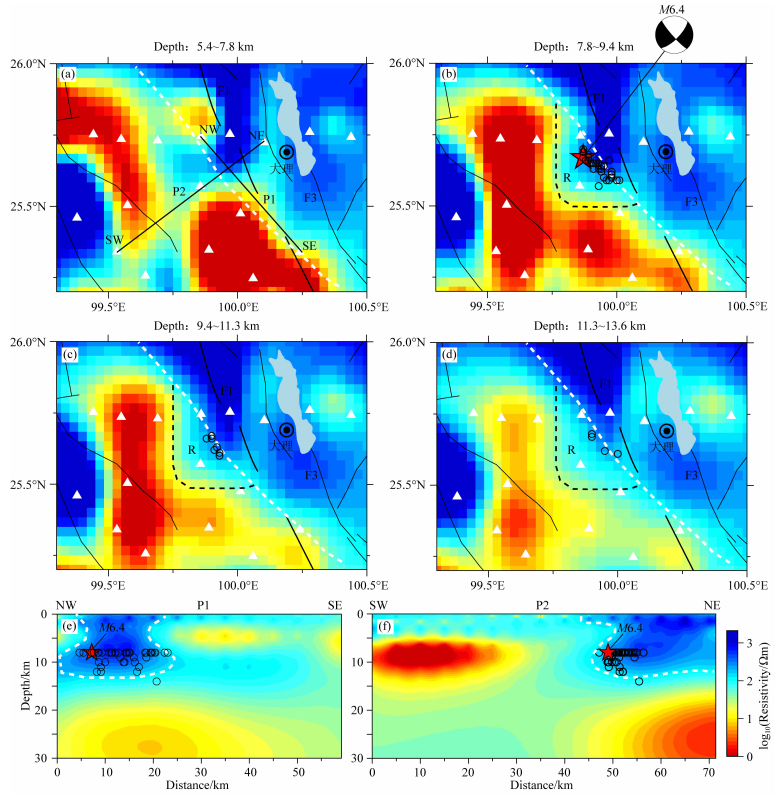
2 震源区三维电性结构特征应用大地电磁三维反演开源程序ModEM(Egbert and Kelbert, 2012;Kelbert et al., 2014)我们对图 1a中所示的大地电磁阵列台站阻抗资料进行了三维反演计算,获得了整个滇西地区三维深部电性结构模型(尚未发表,具体反演参数与过程见附件).基于该模型,我们将漾濞地震震源区附近区域(即图 1b所示的区域)的深部电性结构提取出来进行漾濞地震深部孕震环境的分析与讨论.提取出来的漾濞地震震源区三维深部电性结构如图 2所示.图 2a—2d分别是上地壳5.4 km到中地壳13.6 km深度范围内的水平切片结果,图 2e—2f分别是沿地震序列走向的P1剖面以及垂直地震序列走向的P2剖面切片结果.漾濞M6.4主震震源深度8 km,地震序列分布深度8~14 km (https://data.earthquake.cn),根据地震序列分布深度我们将地震投影至对应深度的水平切片以及垂直剖面结果中进行分析.
|
图 2 漾濞MS6.4地震震源区三维电性结构模型 (a)水平切片深度5.4~7.8 km;(b)水平切片深度7.8~9.4 km;(c)水平切片深度9.4~11.3 km;(d)水平切片深度11.3~13.6 km;(e)沿地震序列的北西方向模型垂直切片结果(P1剖面);(f)垂直地震序列的北东方向垂直切片结果(P2剖面).子图(b)—(d)中的黑色虚线指示楔入到低阻柔性岩体中的高阻楔嵌体结构.活动断裂(徐锡伟等,2016)以黑线表示,其中F1:维西—乔后断裂;F3:红河断裂.红色五角星代表漾濞M6.4地震.黑色空心圆表示漾濞M6.4地震序列(截至5月24号9时3级以上地震,https://data.earthquake.cn/).大地电磁阵列台站以白色三角所示.震源机制解为中国地震局地球物理研究所韩立波等人的结果(http://www.cea-igp.ac.cn/kydt/278248.html).白色虚线示意电性分界面. Fig. 2 Three-dimensional electrical resistivity model in the focal area of the Yangbi MS6.4 earthquake Horizontal slices at different depths: (a) 5.4~7.8 km, (b) 7.8~9.4 km, (c) 9.4~11.3 km, and (d) 11.3~13.6 km. Vertical slices along (e) P1 profile (the northwest direction) and (f) P2 profile (the northeast direction). The black dashed lines in Fig. 2b—Fig. 2d indicate the high-resistivity structure wedged into the low-resistivity rock mass. Black lines represent active faults (Xu et al., 2016), where F1: Weixi-Qiaohou Fault; F3: Red River fault. The red star indicates the Yangbi MS6.4 earthquake. Black hollow circles represent the Yangbi MS6.4 earthquake sequence (up to May 24 at 9 o′clock, M > 3, https://data.earthquake.cn/). White solid triangles are magnetotelluric stations. The focal mechanism solution is quoted from the Institute of Geophysics, China Earthquake Administration (http://www.cea-igp.ac.cn/kydt/278248.html). White dashed lines indicate the electrical resistivity interface. |
电性模型水平切片结果(图 2b)显示,震源区电阻率结构呈现显著的横向不均匀性,东北侧为高阻地壳结构,电阻率1000~3000 Ωm,西南侧为低阻地壳结构,电阻率1~10 Ωm,在震源区附近形成一个北西走向的高-低阻电性横向分界面(图 2a—2d,白色虚线所示).该分界面正好对应于前面所述的位于维西—乔后断裂南侧略偏西南的隐伏发震断层位置.从地层分布看(云南省地质矿产局,1990),维西—乔后断裂东北侧主要为一套下远古界苍山群变质岩,在电性结构上表现为高阻特征,而西南侧主要为一套三叠系、侏罗系以及白垩系地层,整体具有较低电阻率结构.因此,震源区的电性结构差异较好地反映了地表调查得到的断裂两侧岩性构造的差异.
漾濞地震序列空间上基本沿着该电性过渡区分布(图 2b—2d).从垂直剖面切片结果(图 2e—2f)可以进一步看到,纵向深度上震源区地壳结构在15 km深度左右存在一个高低阻电性分界面,界面之上为电阻率1000~3000 Ωm的地壳高阻层,之下为电阻率10~30 Ωm地壳低阻层,漾濞地震序列几乎全部位于高低阻电性过渡区并发生在15 km以上高阻地壳层内(图 2e—2f).亦即漾濞地震发生在电性结构中的高低阻过渡区靠近高阻的一侧.
3 发震机制讨论类似于漾濞地震,强震发生于高低阻过渡区并靠近高阻一侧,这一深部孕震电性结构特征已被诸多强震区的电性结构研究结果中报道,如美国圣安德列斯断裂地震(Becken and Ritter, 2012)、汶川7.9级地震(Zhao et al., 2012)以及芦山7.0级地震(詹艳等,2013)等.地震速度结构研究中也有类似的孕震结构特征报道(张中杰等,2005;杨晓涛等,2011;Liu et al., 2021),即强震发生在地震波高低速过渡区靠近高速的一侧.通常可以认为,高阻、高速结构意味着刚度系数大、不易变形的介质,而低阻、低速结构意味着柔度系数大、易于变形的介质(本文采用刚度系数(简称刚度)和柔度系数(简称柔度)来描述介质在应力作用下变形的能力,对应的刚性介质表示刚度系数大,变形能力小,柔性介质表示柔度系数大,变形能力强.本文没有采用更常用的脆性和韧性,我们认为脆性和韧性更适合于描述介质变形的方式和特征,而非变形的能力).因此综合强震震源区电性结构和速度结构特征,可以归纳出以下一个认识:强震发生在深部结构的刚柔性过渡区且靠近刚性介质的一侧,我们将其简称为“刚柔性过渡区现象”.迄今为止,尚未出现一个合理的地震动力学模型对刚柔性过渡区现象的内在力学变形过程进行解释,认识主要还停留在现象描述上,没有上升为理论模型.
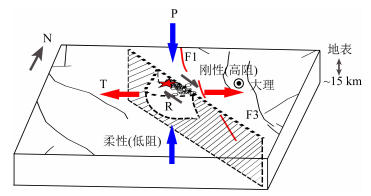
从图 2中可以看出,漾濞地震区附近电性结构呈现出一个有趣的高低阻分布特征:若以地震序列所揭示的隐伏断裂的走向线为边界,那么高阻体“越过”了这一边界而楔入到高导体之中,形成一个局部楔嵌体结构.漾濞地震可视为隐伏断裂沿着其断裂面运动时对高阻楔入体的切割导致,是一种小型、局部的“截弯取直”效应.
受到漾濞地震区上述电性结构特征的启发,本文构建了一个理论模型来解释强震孕育与发生的刚柔性过渡区现象.其主要内容包括以下4个方面:
(1) 发震断层的空间分布代表了其附近区域的最大有效剪应力(由于介质的剪切强度与正应力分布有关,破裂往往不是发生在最大剪应力所在的位置,为便于描述,我们将破裂位置上的剪应力称为最大有效剪应力)集中分布的区域,形成最大有效剪应力集中带;
(2) 较多情况下,断裂两侧介质存在物性上的显著差异:一侧为刚性介质,一侧为柔性介质,二者的分界面为断裂;
(3) 在断裂活动过程中,断裂两侧岩石的相互作用是非均匀的,刚性介质由于不易破损变形,有可能越过最大有效剪应力集中带而楔入到易于破损变形的柔性介质之中,形成刚柔性介质混杂的楔嵌凹凸体结构;
(4) 在一个相当长的时期内,最大有效剪应力集中带是基本稳定不变的,将对上述楔嵌凹凸体结构中越界的刚性体进行切割,从而在刚柔性过渡区靠近刚性介质的一侧孕育和发生强震,构成小型局部的“截弯取直”效应.
可以看出,上述这一模型对于强震孕育与发生的刚柔性过渡区现象,从区域应力分布、介质属性和构造变形过程做出了完整的解释,为便于描述,我们将其称为“刚柔性楔嵌体地震动力学模型”,简称为“刚柔性楔嵌体模型”.需要注意的是,该模型是专门用于解释强震孕育与发生的刚柔性过渡区现象的.强震孕育与发生可能还有别的表现形式,如断裂带两侧可能都是刚性介质,其所孕育的强震则是两侧刚性体的强力作用,不是刚柔性楔嵌体模型所要解释的对象.
我们将刚柔性楔嵌体模型用于解释此次漾濞MS6.4地震的发震机制,其卡通模型如图 3所示.在近南北向挤压、东西向拉张的区域应力作用下(Zhao et al., 2013),最大有效剪应力集中于本次漾濞地震的发震断裂——维西—乔后断裂南段西南侧北西走向的隐伏断裂带上,产生右旋走滑运动.而这条隐伏断裂正好是刚柔性介质的分界线,在断层活动与强震孕育过程中,局部的刚性高阻体“越过”隐伏断裂带(最大有效剪应力带),形成楔嵌体结构(R,图 2和图 3).这次漾濞地震及其序列是该地震区受最大有效剪应力切割楔入到柔性区的刚性凹凸体的结果.我们认为,该模型能够较好解释为什么漾濞地震发生在高-低阻电性过渡区并靠近高阻一侧,同时也能较好解释地震序列的水平空间位置分布.
|
图 3 漾濞MS6.4地震发震模型示意图 其中斜线截面表示震源区附近的高-低阻电性分界面.字母R表示电性过渡界面的高阻凸出体.P代表近南北向区域主压应力,T代表近东西向区域拉张应力.红色五角星表示漾濞MS6.4地震,黑色空心圆圈代表地震序列震中. F1:维西—乔后断裂;F3:红河断裂. Fig. 3 Schematic diagram of seismogenic model for the Yangbi MS6.4 earthquake The oblique cross section represents the high-low electrical resistivity interface near the foci. The R represents the high-resistivity protrusion "embedded" in the low-resistivity layer on west side of the resistivity transition zone. The letter P represents the regional principal compressive stress and the letter T means the regional tensile stress. The red star indicates the Yangbi MS6.4 earthquake. Black hollow circles represent the epicenters of the earthquake sequence. F1: Weixi-Qiaohou fault; F3: Red River fault. |
本文通过大地电磁测深数据三维反演研究,获得了云南漾濞6.4级地震三维深部孕震电性结构.电性结构揭示震源区存在显著电性横向不均匀性,地震发生在高-低阻电性过渡区并靠近高阻地壳内.本文将这一现象归纳为“刚柔性过渡区现象”.在漾濞地震区的电性结构分布特征的启发下,我们提出了“刚柔性楔嵌体地震动力学模型”(简称为“刚柔性楔嵌体模型”)对强震孕育与发生的刚柔性过渡区现象进行了较全面的解释,认为这次漾濞地震及其序列是该地震区最大有效剪应力切割楔入到柔性区的局部刚性凹凸体的结果.诚然,我们在这里提出的刚柔性楔嵌体模型仅是一种可能的地震动力学理论模型,未来还需更多震例研究进行进一步验证.
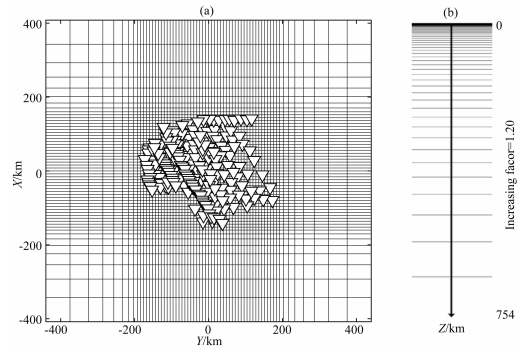
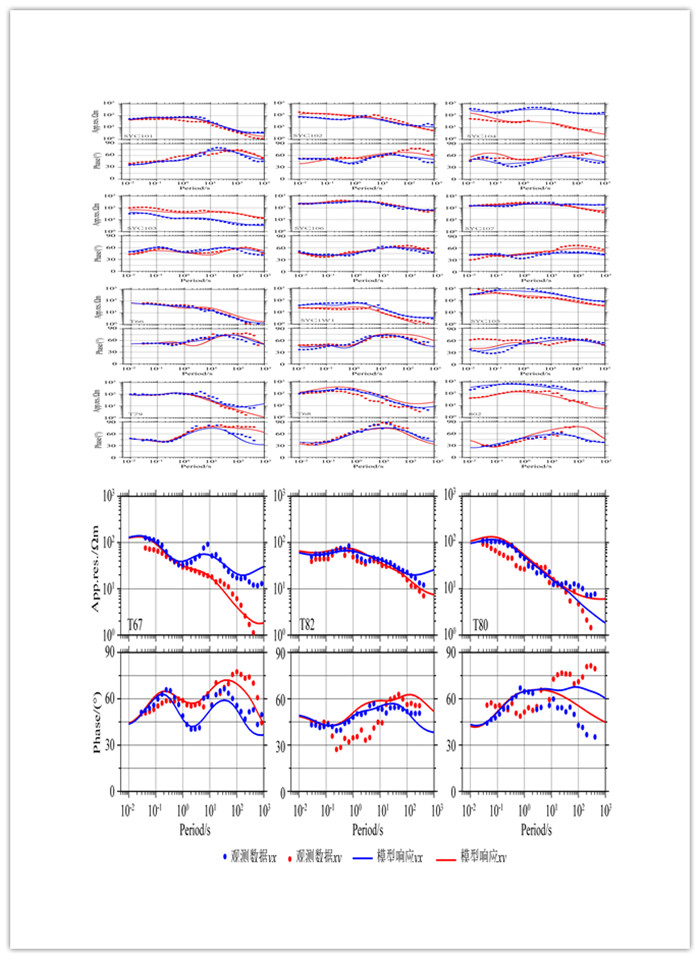
附录A 大地电磁数据三维反演过程、反演模型拟合曲线对图 1a中所示的213个宽频带大地电磁测点统一进行三维反演.三维反演前,首先对德国GSM-07e和凤凰观测仪器MT的响应数据的频率列表进行插值统一,插值频率数40个,有效周期范围0.01 s~1000 s.反演数据类型单独采用数据质量高的辅对角阻抗元素(Zxy, Zyx),数据门限误差为相对值5%.由于网格划分对反演结果可能具有较大影响,三维反演过程中采用了不同稀疏程度的剖分网格进行初步试算.通过比较不同网格的反演结果后,最终采用了三维反演网格为56(X)×64(Y)×53(Z)(附图 1所示).其中,中心计算域网格水平尺度8 km×8 km,离散模型中,经度与纬度方向上的扩展区域由8个以1.3倍递增的网格构成;垂向网格第一层为20 m, 以比例因子1.2向下递增.初始模型采用100 Ωm均匀半空间,x-y-z方向模型协方差因子均为0.3.反演迭代过程中,初始正则化因子1000,反演经过52次迭代,拟合RMS从初始15.15最终减小至2.30,反演模型较好拟合观测数据(附图 2),反演结果稳定可靠.
|
附图 1 三维反演网格 (a)反演网格鸟瞰图; (b)垂向网格; 白色倒三角为测点位置分布. FigureS 1 Three-dimensional inversion grid (a) Bird′s-eye view of the inversion grid; (b) Vertical grid. The white inverted triangles are the distribution of MT stations. |
|
附图 2 观测数据与反演模型响应曲线 实心圆和粗线分别为观测数据以及反演模型响应,其中蓝色为yx模式,红色为xy模式. FigureS 2 Comparisons of the responses of the original inversion model (solid lines) and the observation (solid circles) The solid circles and thick lines are the observation data and the inversion model response respectively. The blue is the yx mode, and the red is the xy mode. |
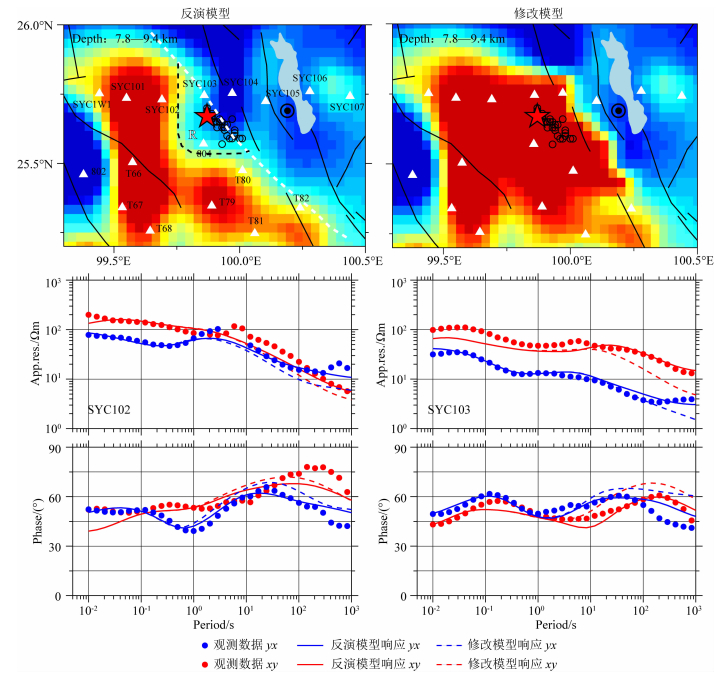
进一步,对震源区高阻体结构R进行灵敏度可靠性验证,其分析结果如附图 3所示.测试过程中,首先将反演模型(图 2)中位于5.4~13.6 km深度范围的高阻楔嵌体R结构修改为1 Ωm(附图 3).对修改后的模型进行三维正演得到修改模型的视电阻率和相位响应,并比较修改与原反演模型相关测点视电阻率和相位曲线的差异.可以看出模型修改后,位于高阻异常体R周围测点(如,测点SYC102、SYC103)的视电阻率响应曲线普遍降低,相位响应曲线普遍抬升,与观测曲线发生明显偏离,指示R结构为数据约束较强区域,表明漾濞震源区的高阻楔嵌体结构是可靠的.
|
附图 3 漾濞地震震源区高阻体R灵敏度测试结果 上一行分别为原反演模型(左)以及修改模型(右).下一行为反演模型响应以及修改模型响应曲线比较,其中红色(蓝色)圆点代表观测点xy(yx)支观测数据;红色(蓝色)实线代表原反演模型的xy(yx)支响应;红色(蓝色)虚线代表原修改模型的xy(yx)支响应. FigureS 3 Sensitivity test results of the high-resistance body R in the focal area of the Yangbi earthquake The upper row is the original inversion model (left) and the modified model (right). The bottom row is the comparisons of the responses of the inversion model and the modified model, where the red (blue) dot represents the xy(yx) observation data; the red (blue) solid line represents the xy(yx) of the original inversion model response; the red (blue) dashed line represents the xy(yx) response of the modified model. |
Becken M, Ritter O. 2012. Magnetotelluric studies at the San Andreas fault zone: implications for the role of fluids. Surveys in Geophysics, 33(1): 65-105. DOI:10.1007/s10712-011-9144-0 |
Bureau of Geology and Mineral Resources of Yunnan Province. 1990. Geological map of Yunnan Province of the People′s Republic of China, 1:4000000 (in Chinese). Beijing: The Geological Publishing House..
|
Cagniard L. 1953. Basic theory of the magneto-telluric method of geophysical prospecting. Geophysics, 18(3): 605-635. DOI:10.1190/1.1437915 |
Cai J T, Chen X B, Xu X W, et al. 2017. Rupture mechanism and seismotectonics of the MS6.5 Ludian earthquake inferred from three-dimensional magnetotelluric imaging.. Geophysical Research Letters, 44(3): 1275-1285. DOI:10.1002/2016GL071855 |
Chang Z, Zhang Y F, Zhou Q Y, et al. 2014. Intensity distribution characteristics and active tectonic background in area of the 2013 Eryuan MS5.5 earthquake.. Earthquake Research in China (in Chinese), 30(4): 560-570. |
Chang Z F, Chang H, Zang Y, et al. 2016a. Recent active features of Weixi-Qiaohou fault and its relationship with the Honghe fault. Journal of Geomechanics (in Chinese), 22(3): 517-530. |
Chang Z F, Chang H, Lin J L, et al. 2016b. The characteristic of active normal faulting of southern segment of Weixi-Qiaohou fault. Journal of Seismological Research (in Chinese), 39(4): 579-586. |
Cheng Y Z, Tang J, Chen X B, et al. 2019. Crustal structure and magma plumbing system beneath the Puer basin, southwest china: insights from three-dimensional magnetotelluric imaging. Tectonophysics, 763: 30-45. DOI:10.1016/j.tecto.2019.04.032 |
Egbert G D, Kelbert A. 2012. Computational recipes for electromagnetic inverse problems. Geophysical Journal International, 189(1): 251-267. DOI:10.1111/j.1365-246X.2011.05347.x |
Gamble T D, Goubau W M, Clarke J. 1979. Magnetotellurics with a remote magnetic reference. Geophysics, 44(1): 53-68. DOI:10.1190/1.1440923 |
Jones A G, Chave A D, Egbert G D, Auld D, Bahr K. 1989. A comparison of techniques from magnetotelluric response function estimation. Journal of Geophysical Research: Solid Earth, 94(B10): 14201-14213. DOI:10.1029/JB094iB10p14201 |
Kelbert A, Meqbel N, Egbert G D, et al. 2014. ModEM: A modular system for inversion of electromagnetic geophysical data. Computers & Geosciences, 66: 40-53. |
Shi Y J, Liu G D, Wu G Y, et al. 1985. Course of Magnetotelluric Sounding Method (in Chinese). Beijing: Seismological Publishing House.
|
Sun X Y, Zhan Y, Unsworth M, et al. 2020. 3-D Magnetotelluric imaging of the easternmost Kunlun fault: Insights into strain partitioning and the seismotectonics of the Jiuzhaigou MS7.0 earthquake.. Journal of Geophysical Research: Solid Earth, 125(5): e2020JB019731. DOI:10.1029/2020JB019731 |
Tikhonov A N. 1950. Determination of the electrical characteristics of the deep strata of the earth′s crust. Doklady. Akadamia. Nauk, 73(2): 295-297. |
Unsworth, M ., Jones, A ., W ei, W B., et al. 2005. Crustal rheology of the Himalaya and Southern Tibet inferred from magnetotelluric data. Nature, 438: 78-81. DOI:10.1038/nature04154 |
Xu X W, Han Z J, Yang X P, et al. 2016. Seismotectonic Map of China and Its Adjacent Areas (in Chinese). Beijing: Seismological Press.
|
Yang X T, Xu Y, Liu J H, et al. 2011. Seismic tomography in the Tengchong volcanic area and its tectonic implication. Chinese Journal of Geophysics (in Chinese), 54(8): 2050-2059. |
Liu Y., Yao H J., Zhang H J, et al. 2021. The community velocity model V.1.0 of southwest China, constructed from joint body- and surface- wave travel-time tomography.. Seismological Research Letters., XX: 1-16. DOI:10.1785/0220200318 |
Ye T, Huang Q H, Chen X B, et al. 2018. Magma chamber and crustal channel flow structures in the Tengchong volcano area from 3-D MT inversion at the intracontinental block boundary southeast of the Tibetan Plateau. Journal of Geophysical Research: Solid Earth, 123(12): 11112-11126. DOI:10.1029/2018JB015936 |
Ye T, Chen X B, Huang Q H, et al. 2020. Bifurcated crustal channel flow and seismogenic structures of intraplate earthquakes in western Yunnan, China as revealed by three-dimensional magnetotelluric imaging. Journal of Geophysical Research: Solid Earth, 125(9): e2019JB018991. DOI:10.1029/2019JB018991 |
Zhan Y, Zhao G Z, Unsworth M, et al. 2013. Deep structure beneath the southwestern section of the Longmenshan fault zone and seimogenetic context of the 4.20 Lushan MS 7.0 earthquake.. Chinese Science Bulletin, 58(20): 1917-1924. DOI:10.1360/csb2013-58-20-1917 |
Zhang H Q, Huang Q H, Zhao G Z, et al. 2016. Three-dimensional conductivity model of crust and upper mantle at the northern Trans North China Orogen: evidence for a mantle source of Datong volcanoes. Earth and Planetary Science Letters, 453: 182-192. DOI:10.1016/j.epsl.2016.08.025 |
Zhang Z J, Bai Z M, Wang C Y, et al. 2005. The crustal structure under Sanjiang and its dynamic implications: Revealed by seismic reflection/refraction profile between Zhefang and Binchuan, Yunnan. Science in China Series D: Earth Sciences, 48(9): 1329-1336. DOI:10.1360/01yd0567 |
Zhao G Z, Unsworth M J, Zhan Y, et al. 2012. Crustal structure and rheology of the Longmenshan and Wenchuan MW7.9 earthquake epicentral area from magnetotelluric data.. Geology, 40(12): 1139-1142. DOI:10.1130/G33703.1 |
Zhao L, Luo Y, Liu T Y, et al. 2013. Earthquake focal mechanisms in Yunnan and their inference on the regional stress field. Bulletin of the Seismological Society of America, 103(4): 2498-2507. DOI:10.1785/0120120309 |
常祖峰, 张艳凤, 周青云, 等. 2014. 2013年洱源MS5.5地震烈度分布及震区活动构造背景研究.. 中国地震, 30(4): 560-570. DOI:10.3969/j.issn.1001-4683.2014.04.009 |
常祖峰, 常昊, 臧阳, 等. 2016a. 维西—乔后断裂新活动特征及其与红河断裂的关系. 地质力学学报, 22(3): 517-530. |
常祖峰, 常昊, 李鉴林, 等. 2016b. 维西—乔后断裂南段正断层活动特征. 地震研究, 39(4): 579-586. |
石应骏, 刘国栋, 吴广耀, 等. 1985. 大地电磁测深法教程. 北京: 地震出版社.
|
徐锡伟, 韩竹军, 杨晓平, 等. 2016. 中国及邻近地区地震构造图. 北京: 地震出版社.
|
杨晓涛, 胥颐, 刘建华, 等. 2011. 腾冲火山区的地震层析成像及其构造意义. 地球物理学报, 54(8): 2050-2059. DOI:10.3969/j.issn.0001-5733.2011.08.012 |
云南省地质矿产局. 1990. 中华人民共和国云南省地质图(1:400万). 北京: 地质出版社.
|
詹艳, 赵国泽, Unsworth M, 等. 2013. 龙门山断裂带西南段4.20芦山7.0级地震区的深部结构和孕震环境.. 科学通报, 58(20): 1917-1924. |
张中杰, 白志明, 王椿镛, 等. 2005. 三江地区地壳结构及动力学意义:云南遮放—宾川地震反射/折射剖面的启示. 中国科学D辑:地球科学, 35(4): 314-319. |
 2021, Vol. 64


