 2021, Vol. 64


2. 中国地震局震源物理重点实验室, 北京 100081
2. Key Laboratory of Seismic Observation and Geophysical Imaging, China Earthquake Administration, Beijing 100081, China
青藏高原东南缘横跨中国西南的四川和云南两省,以印度-欧亚板块碰撞过程形成的复杂的新生代构造为特征(Molnar and Tapponnier, 1975; Yin and Harrison, 2000).这一区域断裂众多,目前发育较大的断裂有:南北向为主的小江断裂、普渡河断裂和程海断裂、北西-南东向的红河断裂以及北东-南西向的丽江-宁蒗断裂等(图 1b).这些断裂把该地区划分为不同的地质构造单元,主要的地质构造单元有中部的川滇菱形块体、西部的滇缅泰块体、西南部的印支块体、东部的扬子块体和东北部的四川盆地.丽江-宁蒗断裂进一步把川滇菱形块体分为川西北次级块体和滇中次级块体(图 1b).

|
图 1 (a) 研究区流动地震台站分布图. 三角形代表319个流动地震台站, 其中红色和蓝色三角形分别代表后续研究所使用的4505和53196台站, 红色方框框出了研究区域, 如图(b)所示. (b) 研究区地形与地质构造图. 蓝色实线代表研究区内一般断裂, 黑色实线表示研究区内主要断裂, 红色圆点代表峨眉山大火成岩省内带、中带和外带的边界, 品红色圆点代表1970年以来发生的MW≥5.0地震震中的分布, 红色五角星表示腾冲火山, 白色三角形代表鲁甸地震的震中. YMTB: 滇缅泰块体; CXBB: 川西北次级块体; DZB: 滇中次级块体; ICB: 印支块体; YZB: 扬子块体; ANHF: 安宁河断裂; XJF: 小江断裂; PDHF: 普渡河断裂; RRF: 红河断裂; LJ-NLF: 丽江-宁蒗断裂; CHF: 程海断裂; SM: 思茅盆地; CX: 楚雄盆地 Fig. 1 (a) The distribution map of the temporary seismic stations in the study area. The triangles show 319 temporary seismic stations, where the red and blue triangles represent 4505 and 53196 stations used in the follow-up study; The red box outlines the study region as shown in (b). (b) The topography and tectonic sketch map of study region. The blue lines show general faults; The black lines show major faults; The red dots outline the boundaries between the inner, intermediate and outer zones of Emeishan Large Igneous Province (ELIP); The magenta filled circles show epicenters of earthquakes (MW≥5.0) since 1970; The red pentagram represents the location of Tengchong volcano; The white triangle represents epicenter of Ludian earthquake. YMTB: Yunnan-Myanmar-Thailand Block; CXBB: Chuanxibei Sub-Block; DZB: Dianzhong Sub-Block; ICB: Indo-China Block; YZB: Yangtze Block; ANHF: Anninghe Fault; XJF: Xiaojiang Fault; PDHF: Puduhe Fault; RRF: Red River Fault; LJ-NLF: Lijiang- Ninglang Fault; CHF: Chenghai Fault; SM: Simao Basin; CX: Chuxiong Basin |
从地震的角度来看,研究区域(21°N-29.5°N,97.5°E-107.5°E)位于地震危险性很高的青藏高原东南缘的南北地震带南段,该区域内地震频发,中国历史上有记载的大地震(MW>7)中,有三分之一以上发生在该区域(张培震等, 2003).2014年8月3日在云南省昭通市鲁甸县发生的6.5级地震使一百多万人受灾,三千多人伤亡,造成了巨大的人员伤亡和财产损失.图 1b给出了研究区域1970年以来发生的MW≥5.0的地震分布.从构造的角度来看,研究区域位于西部高原中心地带和东部稳定的华南块体之间(Shen et al., 2005),是高度形变的青藏高原与扬子块体的过渡区.青藏高原是新生代时期印度板块与欧亚板块碰撞的产物,碰撞使平均海拔为4500 m的青藏高原发生剧烈隆起和地壳收缩增厚,造成其地壳厚度是平均地壳厚度的2倍(Molnar et al., 1993; Yin and Harison, 2000; Chen et al., 2010).为了很好地解释青藏高原的构造演化和地壳形变,前人提出了三种模型:(1)刚性块体侧向挤压模型:该模型认为印度板块对青藏高原没有进行大规模的俯冲下插,而是水平推挤,导致刚性块体的挤压变形主要发生于沿块体边界的走滑断裂(Tapponnier and Molnar, 1976; Tapponnier et al., 1982, 2001);(2)连续变形模型:该模型认为印度板块对青藏高原的挤压作用使得构造变形在整个岩石圈至少是中下地壳发生了连续变形(England and Houseman, 1986, 1989; England and Molnar, 1997);(3)地壳通道流模型:该模型认为青藏高原下地壳物质从高原中部被挤出到高原边缘,并在此堆积,从而导致上地壳和下部地幔之间的解耦变形(Clark and Royden, 2000; Clark et al., 2005; Royden et al., 1997, 2008).近年来,又有学者提出新的结构模型来解释青藏高原的形成演化机制,如“大地幔楔”结构模型:该模型认为青藏高原东缘存在由印度板块深俯冲至地幔转换带并在地幔转换带内形成“大地幔楔”结构(Lei et al., 2009, 2019; Lei and Zhao, 2016),该模型对于更好地理解青藏高原的构造演化同样具有重要的科学意义.青藏高原东南缘作为高原的边缘地带,地震活动频繁,地质构造复杂,是检验上述模型的热点区域和理想场所.因此对该地区地壳结构的精细化研究可能对上述模型的区分和地震危险性评估起到关键作用.
21世纪以来,地球物理工作者通过各种各样的地球物理学方法对青藏高原东南缘地壳结构开展了一系列研究.包括接收函数(李永华等, 2009; Zhang et al., 2010; Xu et al., 2013; Hu et al., 2018)、面波层析成像(Yao et al., 2008; Li et al., 2014b; Wang and Gao, 2014; Qiao et al., 2018; 张智奇等, 2020)、体波层析成像(王椿镛等, 2002; Huang et al., 2002; Wang et al., 2003; Huang et al., 2015; Lei et al., 2009, 2019; Lei and Zhao, 2016)、背景噪声层析成像(Yao et al., 2006, 2008; Yang et al., 2012; 鲁来玉等, 2014)、衰减(Bao et al., 2011)和深地震测深(张中杰等, 2005a; Wang et al., 2007, 2009; Zhang et al., 2011)等.这些研究成果普遍支持在研究区中下地壳存在低速体(LVZ)和通道流.然而,之前研究得到的地壳模型(Royden et al., 1997; Cook and Royden, 2008)认为青藏高原东南缘中下地壳流流动很通畅,没有受到阻碍,这与峨眉山大火成岩省(Emeishan Large Igneous Province,ELIP)的研究成果不符.峨眉山大火成岩省形成于约259 Ma,是存在于研究区内的唯一被国际学术界认可的大火成岩省(徐义刚和钟孙霖, 2001).它分布于扬子克拉通的西缘,以红河断裂为西南界(图 1b),出露面积为250000 km2,通常认为它的形成与古地幔柱有关(徐义刚和钟孙霖, 2001; Ali et al., 2010; 徐涛等, 2015).根据分布于西南三省中-晚二叠纪茅口灰岩的侵蚀程度,可将ELIP自西向东大致分为内带(深度剥蚀带)、中带(部分剥蚀带)、外带(古分化带)和边缘连续沉积带,且在空间上具有明显的变化规律.其中,内带大致为圆形,直径约400 km,包括四川省南部和云南省西部,以密度大、P波和S波速度高、VP/VS比高及地壳厚度大为特征(Chen et al., 2015);中带为300 km宽的弧形环带,包括四川省的西南部和云南省东部(何斌等, 2003).
在之前的研究中,学者们用体波、面波及联合反演等方法得到了研究区三维S波速度模型(Yao et al., 2010; Liu et al., 2014; Bao et al., 2015; Shen et al., 2016; Li et al., 2016; 郑晨等, 2016).这些研究所得到的S波速度模型在一定程度上是相似的,但在很多细节方面又有不同,比如低速体的位置和形态.这可能与数据的敏感性以及反演方法的非唯一性有关.最近,在与研究区相似的区域内同样进行了S波速度结构方面的研究(Yang et al., 2020; 张智奇等, 2020).他们的研究结果与前人的研究结果一样,同样观测到在中下地壳存在两个低速体,但是低速体的空间分布特征又互不相同.可以看出,在青藏高原东南缘地壳存在低速体已得到一致的认同.为了通过提高横向分辨率来更好地刻画低速体的位置和形态,本文利用更加密集的台阵数据通过联合反演的方法将更多敏感性互补的资料加进来以约束研究区地壳S波速度结构.接收函数对台站下方地壳和上地幔的速度间断面很敏感,对绝对速度不敏感;而面波频散可以反演得到绝对S波速度结构,却对速度间断面约束较差.因此利用接收函数和面波频散联合反演可以很好地约束地下介质S波速度结构(Last et al., 1997; Özalaybey et al., 1997; Sun et al., 2014; Bao et al., 2015; 郑晨等, 2016).ZH振幅比(ZH ratio)(Tanimoto and Alvizuri, 2006)是指基阶瑞雷面波垂向(Z)分量振幅与径向(R)分量振幅的比值,是一个随频率变化的函数.它与地下浅部结构有密切的关系.ZH振幅比主要对近地表或地壳浅部的速度结构敏感(Boore and Toksöz, 1969).高频(>1 Hz)的瑞雷面波ZH振幅比经常用来反演台站下方最顶部几百米的速度结构(Fäh et al., 2001),中长周期的ZH振幅比可用来反演地壳结构(Yano et al., 2009).从敏感核来说,在相同周期,ZH振幅比的敏感核深度大约为瑞雷面波频散的一半(Tanimoto and Rivera, 2008; Yano et al., 2009), 因此相比于同周期的相速度频散来说,ZH振幅比对更浅部地壳敏感的同时也可以对地壳结构提供独立的约束.因此,在接收函数和面波频散的基础上加入ZH振幅比信息来共同约束地壳和上地幔的S波速度结构方面,也得到越来越多的应用(Kang et al., 2016; Yang et al., 2020).
在本文中,首先利用在青藏高原东南缘布设的流动地震台站记录到的远震波形数据分别计算瑞雷面波频散曲线(10~60 s)、ZH振幅比(12~60 s)和接收函数(0~12 s).其次,使用了Shen等(2016)利用背景噪声面波层析成像方法得到的光滑S波速度模型作为初始模型,用来提高最终反演得到的S波速度模型的准确性.接下来,对研究区内的每个台站采用Zhang和Yao (2017)提出的分步线性反演算法联合反演上述三种资料得到一维S波速度结构,通过插值得到研究区新的三维S波速度模型.最后探讨新模型所揭示的构造意义.
1 数据处理我们使用了2010年9月由中国地震局地球物理研究所牵头的“中国地震科学探测台阵-南北地震带南段”项目在青藏高原东南缘布设的350个宽频带流动地震台站在2011年6月到2014年2月记录到的远震体波和面波数据.图 2展示了布设在贵州省、四川省和云南省内的一些流动台站记录到2011年8月22日在日本海发生的一个震级为5.9级地震的原始波形数据.由于研究区某些流动地震台站记录到的数据质量较差,无法计算接收函数和ZH振幅比,所以最终本文反演得到了共计319个台站的一维S波速度模型.这319个台站(图 1a)都有接收函数和ZH振幅比值,而瑞雷面波相速度值可以通过整个研究区相速度分布插值到每个台站的位置上.接下来我们将详细描述数据处理的具体流程.

|
图 2 (a) GZ(贵州省)、SC(四川省)和YN(云南省)一些流动地震台站的分布(黑色三角形)以及2011年8月22日在日本海发生的一个5.9级地震的震中位置(红色五角星). (b-d) 由GZ、SC及YN台站记录到的日本海5.9级地震的原始波形数据图(b)、(c)和(d)左侧的数字代表台站名称, 中间的数字表示震中距(km). Fig. 2 (a) Distribution of some temporary seismic stations (black triangles) in GZ (Guizhou Province), SC (Sichuan Province) and YN (Yunnan Province) and the epicenter (red pentagram) of an earthquake (M5.9) that occurred in the Sea of Japan on 22 August 2011. (b-d) Examples showing original seismograms recorded by GZ, SC and YN seismic stations for the earthquake (M5.9) in the Sea of Japan The numbers on the left of figures (b), (c) and (d) represent the code of seismic stations, and the numbers on the middle represent the epicentral distance in km. |
本文的联合反演使用了瑞雷面波相速度频散资料,该频散资料使用了“中国地震科学探测台阵-南北地震带南段”项目的垂直向记录.对原始数据进行预处理后采用双台法计算得到超过3500条独立路径上的瑞雷面波10~60 s相速度频散曲线,最终通过面波层析成像方法反演得到研究区不同周期分辨率为0.5°×0.5°相速度分布(Li et al., 2014b; 潘佳铁等, 2015).最后,从研究区相速度分布中提取各个台站位置所对应的周期范围为10~60 s的相速度值.通过计算后验协方差矩阵(Tarantola and Valette, 1982)作为相速度误差值.若该误差小于相速度值的2%,则取相速度值的2%作为最终的误差值.把得到的相速度值及相速度误差值作为联合反演的面波频散资料.图 3给出了周期为10 s和40 s的瑞雷面波相速度分布图.10 s的相速度分布反映了研究区上地壳的S波速度变化.从分布图可以看出,研究区最显著的低速异常位于川西北次级块体、红河断裂南部、小江断裂、普渡河断裂、滇中次级块体南部以及楚雄盆地和思茅盆地等处.从40 s的相速度分布图可以看出低速主要位于川西北次级块体.在10 s显示为低速异常的其他区域在40 s的相速度分布图中不再明显,这主要是因为川西北次级块体下方地壳较厚,此时还处于地壳部分,而其他区域已经进入上地幔.

|
图 3 研究区10 s和40 s周期的瑞雷波相速度分布图棕色细实线表示研究区内一般断裂, 黑色粗实线表示研究区内主要断裂, 红色圆点代表峨眉山大火成岩省内带、中带和外带的边界. 黑色五角星表示腾冲火山. Fig. 3 Phase velocity maps of Rayleigh wave in the study region at 10 s and 40 s The brown thin lines indicate general faults, while the black thick solid lines indicate major faults in the study region. The red dots outline the boundaries between the inner, intermediate and outer zones of Emeishan Large Igneous Province (ELIP). The black pentagram represents the location of Tengchong volcano. |
我们使用了研究区布设的350个流动地震台站在2011年6月到2014年2月期间记录的MW≥5的地震事件.对所有地震数据进行去均值、去线性趋势、波形尖灭和去仪器响应,然后将三分量中的南北分量(N)和东西分量(E)旋转到径向分量(R)和切向分量(T)上,然后将垂直分量(Z)和水平分量(R)提取出来,以2.5~5.0 km·s-1的相速度范围作为瑞雷面波窗进行截取.使用时域多次滤波法(time domain multiple-filter method)(Sexton et al., 1977; Chong et al., 2015)来计算瑞雷面波ZH振幅比.ZH振幅比计算的周期范围为12~60 s,用来联合反演地壳和最上层地幔的S波速度结构.
由于受到地下介质微观结构等因素的影响(Ferreira and Woodhouse, 2007),ZH振幅比在实际计算过程存在较大的误差范围,且其值也很难呈高斯状分布.而Tanimoto和Rivera(2008)认为这种误差是稳定的,可以通过统计的方法加以约束.参考Lin等(2012)、袁艺等(2016)及Yang等(2020)计算ZH振幅比的流程,我们在数据处理过程中设置多个筛选条件以提高计算结果的准确度和避免潜在误差.具体的计算过程和筛选条件为:1) 遍历所有地震事件,删除垂直分量信噪比(SNR)小于8的三分量事件;2) 计算每一个地震事件的ZH振幅比值.由于ZH振幅比值的分布范围为0.6~1.8,删除在此范围外的明显异常值;3) 对于周期范围内的每一个时间点,统计台站在该时间点处有记录的地震事件数.若事件数大于15,则计算其对应的平均值υ和标准差σ;4) 对于周期范围内的每一时间点,若存在计算结果且为了避免计算值过于分散,删除2σ范围外的值(删除[υ-2σ,υ+2σ]外的值);5) 对于剩下的值,再次计算平均值υ和标准差σ,若呈高斯分布,则表明计算结果较为可靠.图 4b-d为利用53196台站瑞雷面波信号计算得到的周期为20 s、35 s和45 s ZH振幅比分布情况,可以看出它们大致呈高斯分布,说明计算结果可靠.6) 由于计算得到的ZH振幅比曲线不光滑,所以以5个相邻周期点为单位,对ZH振幅比曲线作滑动平均,得到的结果如图 4a蓝色圆点所示.对于误差(图 4a标准误差棒)的确定,若标准误差小于ZH振幅比值的2%,则将ZH振幅比的2%作为误差值,否则将标准误差作为误差值.为了减少反演时间,通过抽取,把12~60 s周期范围内的15个ZH振幅比及误差值作为联合反演需要的ZH振幅比资料.

|
图 4 利用53196台站瑞雷面波信号计算得到的ZH振幅比 (a) 12~60 s ZH振幅比及误差值, 误差用标准误差棒来表示. (b-d) 20 s、35 s和45 s不同地震事件计算得到的ZH振幅比分布直方图. 蓝色竖直线为对应各周期的ZH振幅比均值, 均值标注在蓝色竖直线右边, 事件总数标注在图的右侧. Fig. 4 ZH ratio measured by Rayleigh waves at station 53196 (a) ZH ratio at periods of 12~60 s with the associated uncertainties plotted in standard deviation error bars. (b-d) The histograms of ZH ratio measurements from different events at 20 s, 35 s and 45 s. The blue vertical line in each figure represents the mean value of ZH ratio at the corresponding period, with the mean value labeled on the right of the blue vertical line and the total number of events marked on the right of the figure. |
瑞雷波相速度在接近其波长的1/3深度处对S波速度最敏感(Lin et al., 2012),而长周期ZH振幅比对S波速度的灵敏度在地表几公里处是最大的(Tanimoto and Rivera, 2008; Yano et al., 2009).图 5b为瑞雷波相速度的深度敏感核,可以看出,周期越小,面波相速度的敏感核深度就越浅;图 5c为ZH振幅比的深度敏感核,相比于相速度敏感核,ZH振幅比的敏感核在更浅的深度其敏感度达到最大,当深度再大时,ZH振幅比对速度的敏感度几乎为0.图 6为周期20 s和40 s通过插值得到的二维ZH振幅比及其误差分布图.从20 s和40 s的ZH振幅比分布图可以看出,研究区最显著的高ZH振幅比位于川西北次级块体,这可能与四川盆地西南部至攀枝花地区的高速体对川西北次级块体下方低速物质的运移具有阻挡作用所导致的地壳增厚和地形隆升有关.另外在20 s的ZH振幅比分布图中,低ZH振幅比区域与研究区内的主要沉积盆地(思茅盆地和楚雄盆地,见图 1b)有很好的相关性.同时在这两个周期的ZH振幅比分布图中,在四川盆地都可以看到低的ZH振幅比分布,这可能是由面波在四川盆地沉积层中的水平放大效应所导致.

|
图 5 (a) 台站4505联合反演得到的一维S波速度模型. (b) 基阶瑞雷面波相速度在周期10 s、20 s、40 s和60 s的深度敏感核. (c) ZH振幅比在周期12 s、20 s、30 s和40 s的深度敏感核. 相速度敏感核和ZH振幅比敏感核的计算都是基于(a)的一维S波速度模型 Fig. 5 (a) 1D S-wave velocity model obtained by joint inversion at station 4505. (b) Depth sensitivity to VS of the Rayleigh wave phase velocity at 10 s, 20 s, 40 s and 60 s. (c) Depth sensitivity to VS of the Rayleigh wave ZH ratio at 12 s, 20 s, 30 s and 40 s. These sensitivities are computed based on the 1D S-wave velocity model of (a) |

|
图 6 研究区20 s和40 s瑞雷面波ZH振幅比及误差分布图 图中线条及黑色五角星所表示的含义与图 3相同. Fig. 6 ZH ratio maps of Rayleigh wave and associated uncertainties in the study region at 20 s and 40 s The meanings of the lines and black pentagram in the figure are same as those in Fig. 3. |
我们使用了在研究区布设的350个流动地震观测台站于2011年6月到2014年2月间记录到的远震波形中震中距在30°~90°、MW≥5.5和波形信噪比高的900个远震事件.图 7给出了远震事件的震中位置分布,可以看出事件的方位覆盖较好.在计算接收函数时,先对三分量记录进行去均值、去线性趋势和去仪器响应等预处理,然后以频率范围为0.02~1 Hz进行带通滤波,之后在P波到时前50 s、后100 s的时间窗内截取P波波形,并将三分量中的南北分量(N)和东西分量(E)旋转到径向分量(R)和切向分量(T)上.应用时间域迭代反褶积算法(Ligorría and Ammon, 1999)对被5个以上台站记录到的且有清晰P波震相的记录进行接收函数的计算.计算过程中设置高斯系数为3.对计算结果进行适当筛选,波形明显异常且PmS到时明显不同的均被删除.对研究区域350个台站接收到的900个地震进行计算并筛选共得到37139条径向接收函数.图 8为计算得到的台站4505和53196径向接收函数结果.图中可以看到很清晰的PmS震相.联合反演所使用的接收函数是对所有径向接收函数叠加所得(图 8a和b上侧).我们把叠加接收函数与所有单个接收函数均方根(RMS)差的绝对值作为接收函数误差(图 10和图 11c灰色带状区域).最终的联合反演取叠加接收函数前12 s波形.

|
图 7 本研究中计算接收函数所使用的远震事件的震中分布 蓝色五角星代表台阵中心位置, 带有颜色的圆点代表地震. Fig. 7 Epicentral distribution of teleseismic events for receiver functions used in this study The blue pentagram represents the center of the seismic array and the colored dots represent earthquakes. |

|
图 8 台站4505 (a)和53196 (b)计算得到的径向接收函数结果 右侧为相应的射线参数, 上侧为接收函数叠加结果. Fig. 8 Radial receiver functions of stations 4505 (a) and 53196 (b) The right side is the corresponding ray parameters, and the upper side is the stack result of the receiver functions. |

|
图 9 4505台站加入高斯随机噪声的反演结果 (a) 瑞雷面波相速度; (b) 瑞雷面波ZH振幅比; (c) 接收函数; (d) 联合反演获得的S波速度模型. 图(a-c)中黑色实线为台站4505真实数据. (d)中黑色实线为真实数据联合反演获得的S波速度模型. 图(a-c)中各种颜色的实线为添加了随机噪声的数据. (d)中各种颜色的实线为与(a-c)对应的联合反演获得的S波速度模型. Fig. 9 Inversion results with random Gaussian noise from station 4505 (a) Rayleigh wave phase velocities; (b) Rayleigh wave ZH ratio; (c) Receiver functions; (d) S-wave velocity model obtained by joint inversion. The black line in (a-c) and (d) show the real data and S-wave velocity model obtained by joint inversion of station 4505, respectively. The colored lines in (a-c) and (d) show the real data with random noise added and the corresponding S-wave velocity models obtained by joint inversion, respectively. |

|
图 10 联合反演4505台站下方S波速度结构 (a) 瑞雷面波相速度, 误差由蓝色标准误差棒表示. (b) 瑞雷面波ZH振幅比, 误差由蓝色标准误差棒表示. (c) 接收函数, 误差由灰色带状表示. 图(a-c)中红色实线表示由联合反演模型正演得到的数据, 黄色虚线表示由初始模型正演得到的数据. 图(d)中蓝色实线表示由Shen等(2016)得到的S波速度初始模型, 红色实线表示联合反演得到的S波速度模型. Fig. 10 Joint inversion of S velocity structure under station 4505 (a) Rayleigh wave phase velocities, with the uncertainties presented as blue one standard deviation error bars. (b) Rayleigh wave ZH ratio, with the uncertainties presented as blue one standard deviation error bars. (c) Receiver functions, with the uncertainties shown as gray shaded areas. The red solid lines and yellow dashed lines in (a-c) correspond to the forward datasets of the final model and initial model, respectively. (d) The blue solid line represents the initial S-wave velocity model obtained by Shen et al. (2016), and the red solid line represents the S-wave velocity model obtained by joint inversion. |

|
图 11 联合反演53196台站下方S波速度结构 (a) 瑞雷面波相速度, 误差由蓝色标准误差棒表示. (b) 瑞雷面波ZH振幅比, 误差由蓝色标准误差棒表示. (c) 接收函数, 误差由灰色带状表示. 图(a-c)中红色实线表示由联合反演模型正演得到的数据, 黄色虚线表示由初始模型正演得到的数据. 图(d)中蓝色实线表示由Shen等(2016)得到的S波速度初始模型, 红色实线表示联合反演得到的S波速度模型. Fig. 11 Joint inversion of S velocity structure under station 53196 (a) Rayleigh wave phase velocities, with the uncertainties presented as blue one standard deviation error bars. (b) Rayleigh wave ZH ratio, with the uncertainties presented as blue one standard deviation error bars. (c) Receiver functions, with the uncertainties shown as gray shaded areas. The red solid lines and yellow dashed lines in (a-c) correspond to the forward datasets of the joint inversion model and initial model, respectively. (d) The blue solid line represents the initial S-wave velocity model obtained by Shen et al. (2016), and the red solid line represents the S-wave velocity model obtained by joint inversion. |
联合反演所使用的初始模型为Shen等(2016)利用瑞雷面波频散资料通过贝叶斯-蒙特卡罗方法反演得到的中国及邻近地区分辨率为0.5°×0.5°地壳和上地幔0~150 km的三维S波速度模型.我们从中提取与各个台站位置相对应的0~100 km范围内的深度-速度值,并对速度值进行高斯函数平滑处理作为初始S波速度模型.平滑处理的目的是为了减小初始模型中明显的速度间断面对线性反演结果的影响.初始模型文件中所需要的P波速度和密度通过VP-VS及ρ-VP的经验公式得到(Brocher, 2005).
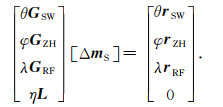
2 反演方法本文使用的反演程序基于Zhang和Yao(2017)提出的分步线性迭代反演算法,该算法联合反演接收函数、面波频散和ZH振幅比得到每个台站下方地壳的S波速度结构.该算法的正演过程可以写为:

|
(1) |
d为n维数据向量,表示这三种数据向量的组合;G为非线性正演算子;m为由每个台站下方S波速度分层模型参数组成的m维向量.用最小失配函数表示反演过程:

|
(2) |
式中,η为平滑参数,用来平衡数据拟合(第一项)和模型正则化(第二项);Δm为模型修正量;L为一阶或高阶Tikhonov平滑算子(Aster et al., 2011, 2013).
由于这三种数据主要对S波速度敏感,因此将模型向量简化为固定层厚的S波速度m维向量mS,然后利用线性迭代阻尼最小二乘法最小化(2)式中的目标函数ϕ(m),每次迭代的方程为:
|
(3) |
通过mS(n+1)=mS(n)+ΔmS(n)来迭代更新S波速度模型向量,ΔmS为模型迭代量,从初始模型mS(0)开始迭代.三种数据的权重为:

|
(4) |
p,q,r为权重系数,用来表示不同数据对反演结果的贡献大小,且满足p+q+r=1;下标SW,ZH,RF分别表示反演需要的面波频散、ZH振幅比和接收函数资料;N代表不同数据参与反演的点数;σ2代表不同数据的测量误差;(3)式中的rSW, rZH, rRF表示不同数据的修正剩余向量;GSW, GZH, GRF表示不同数据的敏感核,可以通过数值差分算法计算.
为了更好地利用不同数据对S波速度结构的敏感性,采用“两步反演法”进行:1) 对初始模型通过联合反演面波频散和ZH振幅比获得较为平滑的地壳和上地幔S波速度结构.相比于单独的面波频散反演,加入ZH振幅比可以更好地约束地壳浅部的S波速度结构.在反演中设置这两种数据的权重系数是相等的,即p=q=0.5.理论测试结果表明(Zhang and Yao, 2017),通过7次迭代反演就可以实现这两种数据的很好拟合.将第一步得到的S波速度结构作为下一步反演的初始模型;2) 在反演中加入接收函数数据以获得更精细的S波速度结构.这一步中为了更好地约束速度结构中小尺度的速度间断面信息,给接收函数较大的权重值(r>p,q),但也保留面波频散和ZH振幅比一定的权重值,这样可以在一定程度上避免接收函数对初始模型的依赖.理论测试结果表明(Zhang and Yao, 2017),共计20次迭代就可以实现三种数据很好地拟合,S波速度结构也会得到很好的恢复.由于这三种数据都对S波速度敏感,所以联合反演只得到S波速度结构,P波速度和密度通过经验关系得到(Brocher, 2005).
如1.4节所述,我们从Shen等(2016)面波层析成像的结果中提取对应台站位置的S波速度结构,建立了从地表到半空间深度为100 km的初始模型.初始模型的设置如下:在Shen等(2016)得到的Moho面位置下方5 km设置一边界,从地表到该边界,每2 km设置一层;从该边界到100 km处,每10 km设置一层.这样设置一方面是因为反演方法对地壳比对地幔有更好的垂向分辨率,另一方面是在联合反演过程中可以得到更精细尺度上Moho面随深度的变化.
对于可以计算得到接收函数和ZH振幅比值的319个地震台站,我们把整个研究区相速度分布插值到这319个地震台站的位置上,然后对这三种资料通过“两步反演法”得到每个台站下方一维S波速度结构.在反演中,使用一阶Tikhonov平滑算子,并设置平滑系数为2.5.第一步只反演面波频散和ZH振幅比,且满足权重系数p=q=0.5.在第二步反演中,分别计算了两种权重系数比例:p∶q∶r=1∶1∶8和p∶q∶r=2∶2∶6.反演结果表明:对于绝大多数台站,这两种结果几乎没有区别.但是对于部分台站,接收函数权重系数设置过大,会导致最终反演结果被接收函数所主导.所以在对所有台站进行联合反演时,使用p∶q∶r=2∶2∶6.根据接收函数和面波资料(包括面波频散和ZH振幅比)的噪声水平,在三种数据中加入高斯随机噪声,然后进行联合反演,称为蒙特卡罗误差分析(噪声数据反演)(Zhang and Yao, 2017).我们对4505台站进行了100次蒙特卡罗误差分析(图 9),设置面波频散和ZH振幅比的噪声水平为2%,接收函数的噪声水平为10%.从图 9d可以看出反演结果都收敛于真实模型,表明该联合反演方法具有稳定性.最后,在每2 km深度的0.5°×0.5°的网格上对一维模型进行插值,得到三维S波速度模型.
3 结果利用前面介绍的联合反演方法对研究区319个台站逐个进行联合反演,得到各个台站一维S波速度模型.图 10和图 11作为示例给出了台站4505和53196的联合反演结果.从图 10d和图 11d来看,相比于初始模型,联合反演得到的速度模型在地壳最上层几公里和中地壳(20~30 km)低速带(LVZs)存在明显的低速异常.从图 10和图 11a-c来看,联合反演得到的速度模型正演结果比初始速度模型的正演结果拟合度更好.
由于本文只关注地壳和最上层地幔的S波速度结构,同时考虑到深度敏感核(图 5)对60 km以上深度约束较好、ZH振幅比的最长周期为60 s以及反演方法主要对地壳结构约束效果好等诸多因素,所以最终确定反演深度为60 km.图 12联合反演得到了深度为2 km、4 km、10 km、15 km、20 km、30 km、40 km和50 km S波速度水平分布.可以看出VS分布情况在不同深度表现出不同的特征.2 km深度的水平速度切片显示,在普渡河断裂和小江断裂南部呈现低速异常(VS<2.75 km·s-1),楚雄盆地和思茅盆地内由于分布有较厚的中新代沉积而呈现低速异常.在腾冲下方也存在一定程度的低速异常,这反映了腾冲盆地火山区的高热流特性(胥颐等, 2013).高速异常主要分布于扬子块体的南部以及红河断裂的西部区域.4 km深度的水平速度分布和2 km的一样有很明显的横向不均匀性,低速异常(VS<3.05 km·s-1)主要分布在研究区存在较厚沉积层的盆地中,如四川盆地、楚雄盆地和思茅盆地,高速异常分布于扬子块体下方部分区域.10 km深度的水平速度切片显示,在扬子块体下方部分区域存在高速异常,在川西北次级块体、程海断裂和红河断裂下方存在低速异常,这似乎是一条连通的低速体,从川西北次级块体沿着安宁河-丽江-宁蒗-程海断裂向西南方向延伸到达红河断裂下方.15 km深度的水平速度切片与10 km的大致相同,有区别的是在普渡河断裂和小江断裂下方出现了相对周围区域明显的低速异常.20 km深度的水平速度切片显示,在扬子块体和四川盆地下方呈现明显高速异常.该切片最显著的特征是存在两个低速体,一个是从川西北次级块体沿着安宁河-丽江-宁蒗-程海断裂向西南延伸穿过红河断裂进入滇缅泰块体;另一个是沿着小江断裂和普渡河断裂分布,向南延伸至24°N左右,两个低速体被相对高速的滇中次级块体中部(ELIP内带)所隔开,同时可以看出高低速体边界与主要断裂有着很好的对应关系.30 km深度的水平速度切片显示,其S波速度分布特征与20 km深度处的基本一致,在腾冲火山和川滇菱形块体下方存在低速异常.40 km和50 km深度的水平速度切片显示,只在研究区西北部存在明显且大尺度的低速异常分布,其余区域呈现高速异常.这是因为在40~50 km深度范围内,研究区西北部区域地壳较厚(~60 km),此时还处于地壳部分,S波速度较低.而研究区的其他区域已经开始进入上地幔,其S波速度相对较高.这在一定程度上也可以反映出地壳厚度的南北向差异.

|
图 12 深度为2 km (a)、4 km (b)、10 km (c)、15 km (d)、20 km (e)、30 km (f)、40 km (g)和50 km (h) S波速度水平切片 棕色细实线表示研究区一般断裂, 黑色粗实线表示研究区主要断裂, 红色圆点代表峨眉山大火成岩省内带、中带和外带的边界. (e)中蓝色虚线标出了两个低速体的形状, 黑色五角星表示腾冲火山. Fig. 12 Horizontal slices of VS model at depths of 2 km (a), 4 km (b), 10 km (c), 15 km (d), 20 km (e), 30 km (f), 40 km (g) and 50 km (h) The brown thin lines indicate general faults, while the black thick solid lines indicate major faults in the study region. The red dots outline the boundaries between the inner, intermediate and outer zones of Emeishan Large Igneous Province (ELIP). The blue dashed line in (e) marks the shapes of the two low-velocity zones. The black pentagram represents the location of Tengchong volcano. |
青藏高原东南缘中下地壳流一直是地球物理探测关注的重点.许多学者在相同或相近的研究区域内用各种方法进行了很详细的3D速度结构研究(Liu et al., 2014; Bao et al., 2015; 郑晨等, 2016; Shen et al., 2016; Qiao et al., 2018; Xin et al., 2019; 刘伟等, 2019; 张智奇等, 2020).Shen等(2016)和Xin等(2019)分别用面波层析成像方法和双差走时层析成像方法得到了中国大陆S波速度结构,虽然他们的结果可以反映出更全面的速度分布情况,但也有为了使反演稳定以及为了拟合更多数据对平滑因子和阻尼因子等参数设置过大导致对浅部速度结构不能进行很好约束的缺憾.刘伟等(2019)同样用双差层析成像方法对青藏高原东南缘进行地震重定位并获得了研究区3D地壳速度结构,但由于所使用的台站较少且反演的深度范围为30 km,所以不能很准确地反映低速体在整个地壳内的分布情况.由于在研究区西部的台站相对稀疏,导致射线覆盖较差,所以Qiao等(2018)没有很清晰地识别出西部低速体的位置和形态.Bao等(2015)和郑晨等(2016)利用流动密集台网观测资料联合接收函数和面波频散反演地壳和上地幔速度结构,但由于频散数据的最小周期都在10 s左右,所以其结果对浅部地壳没有很好的射线覆盖和敏感性,因此可能会把约束浅部地壳的偏差传递到中下地壳.Liu等(2014)同样利用密集台阵观测资料联合接收函数和面波频散反演青藏高原东部的地壳和上地幔S波速度结构,但由于他们的台阵位置在100°E-105°E之间,所以不能反映青藏高原东南缘西侧低速体的位置和形态.最近,张智奇等(2020)利用布设在青藏高原东南缘132个固定台站10年的地震面波频散数据,使用面波直接反演方法得到了研究区地壳和上地幔0~280 km的三维S波速度结构.由于他们所使用的相速度频散的周期范围为15~150 s,所以存在对浅部地壳约束不精确的可能性.此外,他们文章的重点是得到更准确的上地幔速度结构,他们在进行地壳速度结构反演时选择了一个精细程度很高的模型,所以他们反演得到的地壳模型可能很依赖于初始模型.相比之下,我们加入ZH振幅比后的联合反演结果不仅得到了中下地壳低速体的分布情况,而且还给出了与研究区地表地形和地质分布情况有很好相关性的最上层地壳的速度结构(图 12a-b),因此速度模型更加精细且是前人在该研究区域没有做过的.另外,在反演方法上,本文采用分步迭代算法进行线性反演,通常来说,对接收函数和面波资料(包括相速度和ZH振幅比) 使用线性反演方法进行联合反演时会对初始模型有一定的依赖性(Ammon et al., 1990; Yano et al., 2009).但是根据Zhang和Yao(2017)对初始模型依赖性测试的结果表明,选择不同初始模型近乎得到相同的反演结果,这证实了该联合反演方法对初始模型的依赖性很小.
本文的联合反演结果与以前的研究结果大体一致.在我们的S波速度结构中同样可以看到两个很明显的低速体,但是低速体的具体位置和形态与以前的研究结果存在一定的差异.例如Bao等(2015)在深度为21 km的水平速度切片上可以看到两个低速体围绕着东喜马拉雅构造结(EHS)穿过了整个研究区域;Qiao等(2018)的结果显示了东低速体由北向南延伸穿过红河断裂进入越南,也贯穿整个研究区域.张智奇等(2020)在深度为25 km的中下地壳水平速度切片显示出西侧低速体广泛分布于研究区的西北部,而东侧低速体从云贵高原下方开始向西南方向延伸穿过小江断裂和红河断裂并继续向南延伸到达了越南的奠边府断裂带西侧区域.从低速体的整体分布来看,两个低速体分别在研究区的西北部和东南部贯穿了整个研究区域.同时图 14展示了本文结果与张智奇等(2020)在研究区内沿26°N的S波速度垂直切片,对比可以看出本文的两个低速体主要分布于10~30 km的深度范围内,且主要沿着红河断裂、普渡河断裂及小江断裂等主要走滑断裂分布,两个低速体被中间呈高速异常的滇中次级块体中部(ELIP内带)所隔开;而张智奇等(2020)得到的低速体主要分布于15~40 km的深度范围内,且低速体是相互连通的.与此同时本文的研究结果显示两个低速体的延伸范围有限,由北向南只延伸到24°N左右.导致这种结果的差异可能与我们使用了多种资料的联合反演有关.

|
图 14 沿图 13a中V3剖面的地形图(a)、本文的S波速度垂直切片(b)以及张智奇等(2020)的S波速度垂直切片(c) 其中(b)和(c)用图 13的色标绘制, 图中黑色叉号的含义与图 13的相同. (a)中黑色字母缩写的含义与图 1b中的相同. Fig. 14 Topography (a), S-wave vertical sections of (b) this paper and (c) Zhang et al. (2020) along the V3 cross section of Fig. 13a (b) and (c) are drawn by same color-bar shown in Fig. 13 and the black crosses are same as in Fig. 13. The black abbreviations are the same as in Fig. 1b. |
青藏高原东南缘中下地壳广泛存在弱物质的低速层已经得到多种地球物理学证据的支持.然而不同数据和不同反演方法得到的中下地壳弱物质层具有不同的位置和形态(Yao et al., 2008; Bai et al., 2010; Bao et al., 2015; 郑晨等, 2016; Peng et al., 2017; Qiao et al., 2018; Yang et al., 2020; 张智奇等, 2020).图 12和图 13显示了在研究区内不同深度和不同垂直切片的S波速度反演结果.Litvinovsky等(2000)认为在大约900 ℃时处于30 km深度处的干燥地壳岩石开始熔融,此时所需要的剪切波速度大约为3.45 km·s-1.所以在图 13的垂直切片中,我们在中下地壳用VS=3.45 km·s-1的等值线圈出低速体,在速度低于3.45 km·s-1时可能会发生部分熔融.在低速体的位置出现高导电性(Bai et al., 2010)、强衰减(周龙泉等, 2009; Zhao et al., 2013)、高VP/VS比(Sun et al., 2014; Wang et al., 2017)、高热流(Hu et al., 2000)和正径向各向异性(Xie et al., 2013)等异常时也暗示着部分熔融的发生.在三种资料的共同约束下,我们结果中壳内低速体的分布深度(10~30 km)要浅于前人的结果,且其空间分布也更复杂.在20 km深度处可以看到两个显著的低速体(图 12e中蓝色虚线圈出区域),西北侧的低速体以安宁河-丽江-宁蒗-程海断裂为南部边界,分布在川西北次级块体内,并继续向西南方向延伸到滇缅泰块体;东南侧的低速体主要沿着小江断裂和普渡河断裂分布,向南延伸至24°N左右(郑晨等, 2016).这两个低速体在之前的研究中也都有体现(Bai et al., 2010; Bao et al., 2015; Li et al., 2016; Qiao et al., 2018; 张智奇等, 2020).例如,Bai等(2010)利用大地电磁观测资料得到的结果显示,在青藏高原东部20~40 km的深度内存在两个高导带,西侧的高导带位于东喜马拉雅构造结附近,东侧的高导带沿着鲜水河和小江断裂分布;Bao等(2015)对接收函数和面波频散联合反演得到的结果显示,在青藏高原东南缘中下地壳存在着两个低速体,西侧的低速体从川滇菱形块体的北部向南延伸穿过金沙江-红河断裂进入滇缅泰块体,东侧的低速体从川滇菱形块体的东南部向南延伸穿过红河断裂进入印支块体;Li等(2016)联合反演接收函数和面波频散资料得到的结果显示,在青藏高原东南缘20~30 km的深度内存在两个低速体,这两个低速体从研究区北部开始分别向西南和东南方向延伸最终交汇于云南南部;Qiao等(2018)利用背景噪声面波层析成像方法得到的结果显示,在中下地壳中同样存在低速体,低速体从小江断裂开始向南延伸穿过红河断裂进入越南,并以东部的小江断裂和奠边府断裂为边界.张智奇等(2020)利用面波直接反演方法得到的地壳S波速度结果显示,西侧的低速体以龙门山-丽江-小金河-程海断裂为界,广泛分布于研究区的西北部,东侧的低速体则广泛分布于云贵高原和小江断裂下方,并向西南方向延伸进入越南奠边府断裂西侧.虽然他们得到的低速体的位置和形态各有不同,但是其空间分布与主要断裂有很好的关联性,这在我们的结果中也有体现,这证实了深大断裂在青藏高原东南缘构造演化过程中起到的重要作用(Yao et al., 2008; Liu et al., 2014; Qiao et al., 2018).

|
图 13 沿5个剖面的S波速度垂直切片, 5个剖面的位置如图(a)中红色直线所示 图(a)中绿色圆点代表峨眉山大火成岩省内带、中带和外带的边界.5个剖面中的黑色叉号代表1970年以来发生的震级MW≥5.0地震震源位置. 白色虚线代表勾画出的莫霍面的位置和形态. 每个剖面上方的深灰色阴影区域代表所对应的地形, 红色箭头代表主要断层的位置, 红色字母缩写的含义与图 1b相同. Fig. 13 Five vertical cross sections, which are showed by the red lines in (a) The green dots in (a) outline the boundaries between the inner, intermediate and outer zones of Emeishan Large Igneous Province (ELIP). The black crosses denote the hypocenter of earthquakes (MW≥5) since 1970. The white dashed lines represent the position and shape of the Moho. The dark gray shaded areas above each vertical cross section represent the corresponding topography, the red arrows represent the locations of major faults, and the red abbreviations are the same as in Fig. 1b. |
从图 13所示的S波速度垂直切片中都可以观测到低速体的存在,但是这些低速体在空间分布上的大小和相互连通性方面仍然是复杂的.在剖面V2、V3和V4中可以很明显地看到两个大尺度的低速体.而V1剖面(24°N)显示,中下地壳没有很大尺度且明显的低速体分布,这也验证了前面提到的两个低速体只向南延伸到24°N.从V5剖面来看,低速体主要分布在川西北次级块体,以安宁河断裂为其南部边界.一些小的分散的低速体也可以在研究区南部看到(V1、V4和V5).同时注意到低速体主要沿着红河断裂和小江断裂等主要的走滑断裂分布.Leloup等(1999)认为沿主要走滑断裂的不同块体之间的相对运动所产生的热量会降低中下地壳的速度和黏度,从而形成低速体;而低黏度的低速体又可以减小形成断裂的坚硬地壳块体之间的摩擦,有助于其运动,从而使走滑断裂的滑动不受阻碍.从图 13中MW≥5的地震分布来看,少量地震位于低速体内部,绝大多数地震分布于更容易积累应变的高低速体分界区域,说明低速体的存在有助于断裂发生剪切运动而诱发地震.
Royden等(1997)提出的下地壳侧向流动模型认为:青藏高原中部中下地壳弱物质在高原东部聚集形成了一黏性流动层,致使高原弱物质沿此通道流出,这个模型很好地解释了青藏高原东缘的低海拔以及没有大规模上地壳缩短的现象(Clark and Royden, 2000; Clark et al., 2005; Schoenbohm et al., 2006b).地球物理学观测以及数值模拟结果都给予了中下地壳流模型强有力的支持,得到了很多研究人员的认可.因此寻找中下地壳流存在的依据就是地球物理学要面对的主要问题.
偏低的地震波速度是判断地壳流的主要依据.结合前人的研究成果(Hu et al., 2000; Bai et al., 2010; Zhao et al., 2013; Sun et al., 2014),我们认为本文中观测到的两个低速体是中地壳通道流.推测这很可能是印度板块与欧亚板块碰撞中,中下地壳的弱物质从青藏高原中部向南部运移的有效通道.同时我们也认为呈现低速异常的青藏高原东部上地幔,其内部热而潮湿的物质上涌可能也会对其上部的中下地壳通道流有一定的补充作用(Lei et al., 2019).我们的结果(图 12c-e)也显示在滇中次级块体中部(ELIP内带)呈现高速异常(Bao et al., 2015; 郑晨等, 2016; Yang et al., 2020),在图 13垂直切片V2和V3中,同样可以清楚地看到被地震包围的高速异常.结合前人在这一地区观测到的高VP/VS比(Chen et al., 2017; Wang et al., 2017)、低大地热流(Chen et al., 2015, 2017)、低衰减(Zhao et al., 2013)和高密度异常(Deng et al., 2014, 2016)等特征,证实了滇中次级块体中部(ELIP内带)地壳的强度很大.根据研究区高低速体分布的横向不均匀性以及前人的研究成果,我们推测滇中次级块体中部(ELIP内带)刚性地壳阻挡了来自青藏高原中部东南方向的中下地壳弱物质流,使其发生剪刀式的流动,进而分为两支,东南侧的地壳流很可能是由西北侧的主地壳流沿着安宁河断裂流入.因为小江断裂的平均滑移速率约为7~11 mm·a-1(Shen et al., 2005),这么高的滑移率再加上普渡河断裂的滑移,所产生的剪切热量导致地壳温度升高,从而加剧了地壳物质的塑形变形和部分熔融,导致普渡河断裂和小江断裂下方地壳物质相对较弱,因此有助于从沿安宁河断裂流入的东南侧中地壳通道流在小江断裂和普渡河断裂下方通畅地流动.至于为什么东南侧地壳流只向南延伸到24°N而没有继续向南延伸,以及热而潮湿的上地幔物质对中下地壳通道流的补充作用有多大可能还需要做进一步的研究.
根据上面的讨论,我们认为除了受到滇中次级块体中部(ELIP内带)阻碍的中下地壳流模型外,沿着主要走滑断裂的刚性块体的挤压滑动对于青藏高原东南缘的地壳形变和动力学演化也起着非常重要的作用(Liu et al., 2014; Bao et al., 2015; Qiao et al., 2018).
4.3 峨眉山大火成岩省高速异常峨眉山大火成岩省位于研究区的中部,内带位于滇中次级块体内(图 1b),普遍认为它的形成与古地幔柱有关(徐义刚和钟孙霖, 2001; Ali et al., 2010; 徐涛等, 2015).图 12中的红色圆点代表ELIP的内带、中带和外带的边界,从图 12c-e可以看出内带地壳相对于周围地区呈现高速异常.且王健等(2018)对川滇黔地区铅锌矿床成矿流体来源研究时发现,在高速异常的内带分布有很多大中型铅锌矿床,这在一定程度上佐证了在内带观测到高速异常的可靠性(张智奇等, 2020).为了更直观地看到ELIP在整个地壳的S波速度分布情况,我们分别纵穿ELIP内带(图 13a剖面V6)和横跨ELIP三个带(图 13a剖面V7)给出了联合反演获得的S波速度结构.在图 15的垂直切片V6中,在ELIP内带25°N附近15 km和30 km的深度处分布有两块小尺度的低速体,那是东南侧低速体(图 12e)在此处的体现.从图 13的垂直切片V3、图 15的垂直切片V6和V7可以看到在内带总体速度偏高,Moho面呈部分上隆特征.徐涛等(2015)认为Moho面局部上隆可能与岩浆的底侵作用和青藏高原区域构造活动有关.同时我们速度异常的结果也得到了该地区地震学研究的支持:Liu等(2014)利用密集台阵观测资料联合反演接收函数和面波频散得到的结果显示,在滇中次级块体中部(ELIP内带)下方10~30 km的范围内呈现高速异常;Qiao等(2018)利用背景噪声面波层析成像方法得到的结果显示,在10 km以下内带部分区域整体呈现高速异常;郑晨等(2016)利用接收函数和面波频散资料联合反演地壳S波速度结构显示,在中上地壳(10~25 km)深度,内带下方S波速度呈高速异常.该高速特征并结合前人在地球化学等方面的研究(Farnetani et al., 1996; 吴建平等, 2013; 徐涛等, 2015),我们推测在ELIP内带下方的高速体很可能是二叠纪峨眉山大火成岩省形成时期火山作用和基性超基性岩浆侵入地壳所致.

|
图 15 图 13a中V6和V7剖面的S波速度垂直切片 黑色字母缩写INZ、IMZ和OTZ分别代表峨眉山大火成岩省的内带、中带和外带. 白色虚线代表勾画出的莫霍面的位置和形态, 图中黑色叉号的含义与图 13中的相同. 红色字母缩写的含义与图 1b相同. Fig. 15 V6 and V7 vertical sections, which are showed in Fig. 13a The black abbreviations INZ, IMZ and OTZ represent the inner, intermediate and outer zones of Emeishan Large Igneous Province (ELIP). The white dashed lines represent the position and shape of the Moho. The black crosses in the figures are same as in Fig. 13. The red abbreviations are the same as in Fig. 1b. |
同时我们注意到在图 15的V7垂直切片中,ELIP中带在深度为10~20 km范围内存在高速体,在高速体的下方分布有向东北倾斜的低速体.ELIP内带和中带下方显示的高低速体分布特征在前人的研究成果也有体现(Bao et al., 2015; 郑晨等, 2016; Qiao et al., 2018).同时Chen等(2017)对在云南西部的福贡到贵州的贵定横跨ELIP三带的人工地震测线资料进行综合地球物理分析的结果显示,内带与中带相比,呈现高VS、高VP/VS比、低大地热流和高布格重力异常等特征,这也说明了内带和中带存在着差异.综上所述,在ELIP内带下方10 km到Moho面总体所表现的高速以及高VP/VS比、低大地热流和高布格重力异常等地球物理学特征,表明峨眉山大火成岩省的地幔柱柱头位于内带下方(Xu et al., 2004; Chen et al., 2017; 张智奇等, 2020).
5 结论青藏高原东南缘地处南北地震带南段,这里地壳高度破碎,地震活动频繁,强烈的造山运动和大型走滑断裂使得该区域地质构造十分复杂.自20世纪70年代以来,在研究区内发生过多次震级超过8级的大地震,造成了巨大的人员伤亡和财产损失.因此对地壳结构的精细研究有助于深入了解发震机制以减少地震的破坏.接收函数和面波资料对于研究地下精细结构是非常有用的.本文利用由中国地震局地球物理研究所牵头的中国科学台阵探测项目一期在青藏高原东南缘布设的350个宽频带流动地震台站2011年6月到2014年2月期间记录到的地震波形数据进行瑞雷面波相速度频散、ZH振幅比和远震P波接收函数的联合反演,得到了该研究区高分辨率的地壳S波速度模型.本文得到的结论如下:
(1) S波速度结构显示,地壳顶部速度结构存在着明显的横向不均匀性,速度异常与地表地形和地质特征密切相关,四川盆地、楚雄盆地和思茅盆地受到沉积层的影响而呈现低速异常.
(2) 最显著的特征是在研究区中地壳由北向南呈条带状分布有两个低速通道流,且这两个通道流与主要断裂有着很好的关联性.呈高速异常的滇中次级块体中部(ELIP内带)刚性地壳阻挡了来自青藏高原中部东南方向的中下地壳弱物质流,使其分为两支,东南侧的地壳流很可能是西北侧的主地壳流沿着安宁河断裂流入的.同时注意到地震分布和速度结构存在一定的相关性,绝大多数地震分布于更容易积累应变的低速通道流的边界区域,说明低速通道流的存在有助于断裂发生剪切运动而诱发地震.
(3) 在峨眉山大火成岩省内带下方10 km到Moho面总体呈现高速,这可能是二叠纪峨眉山大火成岩省形成时期火山作用和基性超基性岩浆侵入地壳所致.我们观测到峨眉山大火成岩省内带和中带存在着速度差异,同时综合前人的地球物理探测结果认为峨眉山大火成岩省的地幔柱柱头位于内带下方.
致谢 感谢中国科学技术大学姚华建教授和中国科学院精密测量科学与技术创新研究院崇加军副研究员在数据处理及反演程序调试过程中给予的非常细致与耐心的指导.感谢李永华研究员为本研究提供的瑞雷面波相速度频散数据.感谢两位审稿专家对本文提出的宝贵和有建设性的意见和建议.感谢中国地震局地球物理研究所中国地震科学台阵数据中心为本研究提供的地震波形数据.
Ali J R, Fitton J G, Herzberg C. 2010. Emeishan large igneous province (SW China) and the mantle-plume up-doming hypothesis. Journal of the Geological Society, 167(5): 953-959. DOI:10.1144/0016-76492009-129 |
Ammon C J, Randall G E, Zandt G. 1990. On the nonuniqueness of receiver function inversions. Journal of Geophysical Research: Solid Earth, 95(B10): 15303-15318. DOI:10.1029/JB095iB10p15303 |
Aster R C, Borchers B, Thurber C H. 2011. Tikhonov regularization. //Aster R C, Borchers B, Thurber C H. Parameter Estimation and Inverse Problems. 2nd ed. Boston: New York: Academic Press, 93-127.
|
Aster R C, Borchers B, Thurber C H. 2013. Parameter Estimation and Inverse Problems. 3rd ed. Amsterdam: Elsevier Inc., doi: 10.1016/C2009-0-61134-X.
|
Bai D H, Unsworth M J, Meju M A, et al. 2010. Crustal deformation of the eastern Tibetan plateau revealed by magnetotelluric imaging. Nature Geoscience, 3: 358. DOI:10.1038/Ngeo830 |
Bao X W, Sun X X, Xu M J, et al. 2015. Two crustal low-velocity channels beneath SE Tibet revealed by joint inversion of Rayleigh wave dispersion and receiver functions. Earth and Planetary Science Letters, 415: 16-24. DOI:10.1016/j.epsl.2015.01.020 |
Bao X Y, Sandvol E, Ni J, et al. 2011. High resolution regional seismic attenuation tomography in eastern Tibetan Plateau and adjacent regions. Geophysical Research Letters, 38(16): 129-135. DOI:10.1029/2011GL048012 |
Boore D, Toksöz M N. 1969. Rayleigh wave particle motion and crustal structure. Bulletin of the Seismological Society of America, 59(1): 331-346. |
Brocher T M. 2005. Empirical relations between elastic wavespeeds and density in the earth′s crust. Bulletin of the Seismological Society of America, 95(6): 2081-2092. DOI:10.1785/0120050077 |
Chen Y, Badal J, Hu J F. 2010. Love and Rayleigh wave tomography of the Qinghai-Tibet Plateau and surrounding areas. Pure and Applied Geophysics, 167(10): 1171-1203. DOI:10.1007/s00024-009-0040-1 |
Chen Y, Xu Y G, Xu T, et al. 2015. Magmatic underplating and crustal growth in the Emeishan Large Igneous province, SW China, revealed by a passive seismic experiment. Earth and Planetary Science Letters, 432: 103-114. DOI:10.1016/j.epsl.2015.09.048 |
Chen Y, Wang Z H, Guo X, et al. 2017. Geophysical signature of the ancient mantle plume activities: a case study of the Emeishan Large Igneous province. Bulletin of Mineralogy, Petrology and Geochemistry (in Chinese), 36(3): 394-403. DOI:10.3969/j.issn.1007-2802.2017.03.003 |
Chong J J, Ni S D, Chu R S, et al. 2015. Joint inversion of body-wave receiver function and Rayleigh-wave ellipticity. Bulletin of the Seismological Society of America, 106(2): 537-551. DOI:10.1785/0120150075 |
Clark M K, Royden L H. 2000. Topographic ooze: Building the eastern margin of Tibet by lower crustal flow. Geology, 28(8): 703-706. DOI:10.1130/0091-7613(2000)28〈703:TOBTEM〉2.0.CO;2 |
Clark M K, House M A, Royden L H, et al. 2005. Late Cenozoic uplift of southeastern Tibet. Geology, 33(6): 525-528. DOI:10.1130/G21265.1 |
Cook K L, Royden L H. 2008. The role of crustal strength variations in shaping orogenic plateaus, with application to Tibet. Journal of Geophysical Research: Solid Earth, 113(B8): B08407. DOI:10.1029/2007JB005457 |
Deng Y F, Zhang Z J, Mooney W, et al. 2014. Mantle origin of the Emeishan large igneous province (South China) from the analysis of residual gravity anomalies. Lithos, 204: 4-13. DOI:10.1016/j.lithos.2014.02.008 |
Deng Y F, Chen Y, Wang P, et al. 2016. Magmatic underplating beneath the Emeishan large igneous province (South China) revealed by the COMGRA-ELIP experiment. Tectonophysics, 672-673: 16-23. DOI:10.1016/j.tecto.2016.01.039 |
England P, Houseman G. 1986. Finite strain calculations of continental deformation: 2. Comparison with the India-Asia collision zone. Journal of Geophysical Research: Solid Earth, 91(B3): 3664-3676. DOI:10.1029/jb091ib03p03664 |
England P, Houseman G. 1989. Extension during continental convergence, with application to the Tibetan Plateau. Journal of Geophysical Research: Solid Earth, 94(B12): 17561-17579. DOI:10.1029/JB094iB12p17561 |
England P, Molnar P. 1997. The field of crustal velocity in Asia calculated from Quaternary rates of slip on faults. Geophysical Journal International, 130(3): 551-582. DOI:10.1111/j.1365-246X.1997.tb01853.x |
Fäh D, Kind F, Giardini D. 2001. A theoretical investigation of average H/V ratios. Geophysical Journal International, 145(2): 535-549. DOI:10.1046/j.0956-540x.2001.01406.x |
Farnetani C G, Richards M A, Ghiorso M S. 1996. Petrological models of magma evolution and deep crustal structure beneath hotspots and flood basalt provinces. Earth and Planetary Science Letters, 143(1-4): 81-94. DOI:10.1016/0012-821X(96)00138-0 |
Ferreira A M G, Woodhouse J H. 2007. Observations of long period Rayleigh wave ellipticity. Geophysical Journal International, 169(1): 161-169. DOI:10.1111/j.1365-246X.2006.03276.x |
He B, Xu Y G, Xiao L, et al. 2003. Generation and spatial distribution of the Emeishan large Igneous province: new evidence from stratigraphic records. Acta Geologica Sinica (in Chinese), 77(2): 194-202. DOI:10.3321/j.issn:0001-5717.2003.02.007 |
Hu J F, Badal J, Yang H Y, et al. 2018. Comprehensive crustal structure and seismological evidence for lower crustal flow in the southeastern margin of Tibet revealed by receiver functions. Gondwana Research, 55: 42-59. DOI:10.1016/j.gr.2017.11.007 |
Hu S B, He L J, Wang J Y. 2000. Heat flow in the continental area of China: a new data set. Earth and Planetary Science Letters, 179(2): 407-419. DOI:10.1016/S0012-821X(00)00126-6 |
Huang J L, Zhao D P, Zheng S H. 2002. Lithospheric structure and its relationship to seismic and volcanic activity in southwest China. Journal of Geophysical Research: Solid Earth, 107(B10): ESE 13-1-ESE 13-14. DOI:10.1029/2000JB000137 |
Huang Z C, Wang P, Xu M J, et al. 2015. Mantle structure and dynamics beneath SE Tibet revealed by new seismic images. Earth and Planetary Science Letters, 411: 100-111. DOI:10.1016/j.epsl.2014.11.040 |
Kang D, Shen W S, Ning J Y, et al. 2016. Seismic evidence for lithospheric modification associated with intracontinental volcanism in northeastern China. Geophysical Journal International, 204: 215-235. DOI:10.1093/gji/ggv441 |
Last R J, Nyblade A A, Langston C A, et al. 1997. Crustal structure of the East African Plateau from receiver functions and Rayleigh wave phase velocities. Journal of Geophysical Research: Solid Earth, 102(B11): 24469-24483. DOI:10.1029/97JB02156 |
Lei J S, Zhao D P, Su Y J. 2009. Insight into the origin of the Tengchong intraplate volcano and seismotectonics in southwest China from local and teleseismic data. Journal of Geophysical Research: Solid Earth, 114(B5): B05302. DOI:10.1029/2008JB005881 |
Lei J S, Zhao D P. 2016. Teleseismic P-wave tomography and mantle dynamics beneath Eastern Tibet. Geochemistry, Geophysics, Geosystems, 17(5): 1861-1884. DOI:10.1002/2016GC006262 |
Lei J S, Zhao D P, Xu X W, et al. 2019. Is there a big mantle wedge under eastern Tibet?. Physics of the Earth and Planetary Interiors, 292: 100-113. DOI:10.1016/j.pepi.2019.04.005 |
Leloup P H, Ricard Y, Battaglia J, et al. 1999. Shear heating in continental strike-slip shear zones: model and field examples. Geophysical Journal International, 136(1): 19-40. DOI:10.1046/j.1365-246X.1999.00683.x |
Li M K, Zhang S X, Wang F, et al. 2016. Crustal and upper-mantle structure of the southeastern Tibetan Plateau from joint analysis of surface wave dispersion and receiver functions. Journal of Asian Earth Sciences, 117: 52-63. DOI:10.1016/j.jseaes.2015.12.002 |
Li Y H, Wu Q J, Tian X B, et al. 2009. Crustal structure in the Yunnan region determined by modeling receiver functions. Chinese Journal of Geophysics (in Chinese), 52(1): 67-80. |
Li Y H, Pan J T, Wu Q J, et al. 2014b. Crustal and uppermost mantle structure of SE Tibetan plateau from Rayleigh-wave group-velocity measurements. Earthquake Science, 27(4): 411-419. DOI:10.1007/s11589-014-0090-z |
Ligorría J P, Ammon C J. 1999. Iterative deconvolution and receiver-function estimation. Bulletin of the Seismological Society of America, 89(5): 1395-1400. |
Lin F C, Schmandt B, Tsai V C. 2012. Joint inversion of Rayleigh wave phase velocity and ellipticity using USArray: constraining velocity and density structure in the upper crust. Geophysical Research Letters, 39(12): L12303. DOI:10.1029/2012GL052196 |
Litvinovsky B A, Steele I M, Wickham S M. 2000. Silicic magma formation in overthickened crust: Melting of charnockite and leucogranite at 15, 20 and 25 kbar. Journal of Petrology, 41(5): 717-737. DOI:10.1093/petrology/41.5.717 |
Liu Q Y, Van Der Hilst R D, Li Y, et al. 2014. Eastward expansion of the Tibetan Plateau by crustal flow and strain partitioning across faults. Nature Geoscience, 7(5): 361-365. DOI:10.1038/ngeo2130 |
Liu W, Wu Q J, Zhang R Q. 2019. Crustal structure of southeastern Tibetan Plateau inferred from double-difference tomography. Acta Seismologica Sinica (in Chinese), 41(2): 155-168. DOI:10.11939/jass.20180083 |
Lu L Y, He Z Q, Ding Z F, et al. 2014. Azimuth anisotropy and velocity heterogeneity of Yunnan area based on seismic ambient noise. Chinese Journal of Geophysics (in Chinese), 57(3): 822-836. DOI:10.6038/cjg20140312 |
Molnar P, Tapponnier P. 1975. Cenozoic Tectonics of Asia: Effects of a Continental Collision: Features of recent continental tectonics in Asia can be interpreted as results of the India-Eurasia collision. Science, 189(4201): 419-426. DOI:10.1126/science.189.4201.419 |
Molnar P, England P, Martinod J. 1993. Mantle dynamics, uplift of the Tibetan Plateau, and the Indian Monsoon. Reviews of Geophysics, 31(4): 357-396. DOI:10.1029/93RG02030 |
Özalaybey S, Savage M K, Sheehan A F, et al. 1997. Shear-wave velocity structure in the northern basin and range province from the combined analysis of receiver functions and surface waves. Bulletin of the Seismological Society of America, 87(1): 183-199. |
Pan J T, Li Y H, Wu Q J, et al. 2015. Phase velocity maps of Rayleigh waves in the southeast Tibetan plateau. Chinese Journal of Geophysics (in Chinese), 58(11): 3993-4006. DOI:10.6038/cjg20151109 |
Peng H C, Yang H Y, Hu J F, et al. 2017. Three-dimensional S-velocity structure of the crust in the southeast margin of the Tibetan plateau and geodynamic implications. Journal of Asian Earth Sciences, 148: 210-222. DOI:10.1016/j.jseaes.2017.09.004 |
Qiao L, Yao H J, Lai Y C, et al. 2018. Crustal structure of Southwest China and northern Vietnam from ambient noise tomography: implication for the large-scale material transport model in SE Tibet. Tectonics, 37(5): 1492-1506. DOI:10.1029/2018TC004957 |
Royden L H, Burchfiel B C, King R W, et al. 1997. Surface deformation and lower crustal flow in eastern Tibet. Science, 276(5313): 788-790. DOI:10.1126/science.276.5313.788 |
Royden L H, Burchfiel B C, Van Der Hilst R D. 2008. The geological evolution of the Tibetan Plateau. Science, 321(5892): 1054-1058. DOI:10.1126/science.1155371 |
Schoenbohm L M, Burchfiel B C, Chen L Z, et al. 2006b. Miocene to present activity along the Red River fault, China, in the context of continental extrusion, upper-crustal rotation, and lower-crustal flow. GSA Bulletin, 118(5-6): 672-688. DOI:10.1130/b25816.1 |
Sexton J L, Rudman A J, Mead J. 1977. Ellipticity of Rayleigh waves recorded in the Midwest. Bulletin of the Seismological Society of America, 67(2): 369-382. |
Shen W S, Ritzwoller M H, Kang D, et al. 2016. A seismic reference model for the crust and uppermost mantle beneath China from surface wave dispersion. Geophysical Journal International, 206(2): 954-979. DOI:10.1093/gji/ggw175 |
Shen Z K, Lü J N, Wang M, et al. 2005. Contemporary crustal deformation around the southeast borderland of the Tibetan Plateau. Journal of Geophysical Research: Solid Earth, 110(B11): B11409. DOI:10.1029/2004JB003421 |
Sun X X, Bao X W, Xu M J, et al. 2014. Crustal structure beneath SE Tibet from joint analysis of receiver functions and Rayleigh wave dispersion. Geophysical Research Letters, 41(5): 1479-1484. DOI:10.1002/2014GL059269 |
Tanimoto T, Alvizuri C. 2006. Inversion of the HZ ratio of microseisms for S-wave velocity in the crust. Geophysical Journal International, 165(1): 323-335. DOI:10.1111/j.1365-246X.2006.02905.x |
Tanimoto T, Rivera L. 2008. The ZH ratio method for long-period seismic data: Sensitivity kernels and observational techniques. Geophysical Journal International, 172(1): 187-198. DOI:10.1111/j.1365-246X.2007.03609.x |
Tapponnier P, Molnar P. 1976. Slip-line field theory and large-scale continental tectonics. Nature, 264(5584): 319-324. DOI:10.1038/264319a0 |
Tapponnier P, Peltzer G, Dain A Y L, et al. 1982. Propagating extrusion tectonics in Asia: new insights from simple experiments with plasticine. Geology, 10(12): 611-616. DOI:10.1130/0091-7613(1982)10〈611:PETIAN〉2.0.CO;2 |
Tapponnier P, Xu Z Q, Roger F, et al. 2001. Oblique stepwise rise and growth of the Tibet Plateau. Science, 294(5547): 1671-1677. DOI:10.1126/science.105978 |
Tarantola A, Valette B. 1982. Generalized nonlinear inverse problems solved using the least squares criterion. Reviews of Geophysics, 20(2): 219-232. DOI:10.1029/RG020i002p00219 |
Wang C Y, Lou H, Wu J P, et al. 2002. Seismological study on the crustal structure of Tengchong volcano-geothermal area. Acta Seismologica Sinica (in Chinese), 24(3): 231-242. |
Wang C Y, Chan W W, Mooney W D. 2003. Three-dimensional velocity structure of crust and upper mantle in southwestern China and its tectonic implications. Journal of Geophysical Research: Solid Earth, 108(B9): 2442. DOI:10.1029/2002JB001973 |
Wang C Y, Han W B, Wu J P, et al. 2007. Crustal structure beneath the eastern margin of the Tibetan Plateau and its tectonic implications. Journal of Geophysical Research: Solid Earth, 112(B7): B07307. DOI:10.1029/2005JB003873 |
Wang C Y, Lou H, Wang X L, et al. 2009. Crustal structure in Xiaojiang fault zone and its vicinity. Earthquake Science, 22(4): 347-356. DOI:10.1007/s11589-009-0347-0 |
Wang J, Zhang J, Zhong W B, et al. 2018. Sources of ore-forming fluids from Tianbaoshan and Huize Pb-Zn deposits in Yunnan-Sichuan-Guizhou region, Southwest China: Evidence from fluid inclusions and He-Ar isotopes. Earth Science (in Chinese), 43(6): 2076-2099. |
Wang Q, Gao Y. 2014. Rayleigh wave phase velocity tomography and strong earthquake activity on the southeastern front of the Tibetan Plateau. Science China Earth Science, 57(10): 2532-2542. DOI:10.1007/s11430-014-4908-2 |
Wang W L, Wu J P, Fang L H, et al. 2017. Crustal thickness and Poisson′s ratio in southwest China based on data from dense seismic arrays. Journal of Geophysical Research: Solid Earth, 122(9): 7219-7235. DOI:10.1002/2017jb013978 |
Wu J P, Yang T, Wang W L, et al. 2013. Three dimensional P-wave velocity structure around Xiaojiang fault system and its tectonic implications. Chinese Journal of Geophysics (in Chinese), 56(7): 2257-2267. DOI:10.6038/cjg20130713 |
Xie J Y, Ritzwoller M H, Shen W S, et al. 2013. Crustal radial anisotropy across eastern Tibet and the western Yangtze craton. Journal of Geophysical Research: Solid Earth, 118(8): 4226-4252. DOI:10.1002/jgrb.50296 |
Xin H L, Zhang H J, Kang M, et al. 2019. High-resolution lithospheric velocity structure of continental china by double-difference seismic travel-time tomography. Seismological Society of America, 90(1): 229-241. DOI:10.1785/0220180209 |
Xu T, Zhang Z J, Liu B F, et al. 2015. Crustal velocity structure in the Emeishan large igneous province and evidence of the Permian mantle plume activity. Science China: Earth Sciences (in Chinese), 58(7): 1133-1147. DOI:10.1007/s11430-015-5094-6 |
Xu X M, Ding Z F, Shi D N, et al. 2013. Receiver function analysis of crustal structure beneath the eastern Tibetan plateau. Journal of Asian Earth Sciences, 73: 121-127. DOI:10.1016/j.jseaes.2013.04.018 |
Xu Y, Yang X T, Liu J H. 2013. Tomographic study of crustal velocity structures in the Yunnan region southeast China. Chinese Journal of Geophysics (in Chinese), 56(6): 1904-1914. DOI:10.6038/cjg20130613 |
Xu Y G, Chung S L. 2001. The Emeishan large igneous Province: evidence for mantle plume activity and melting conditions. Geochimica (in Chinese), 30(1): 1-9. DOI:10.3321/j.issn:0379-1726.2001.01.002 |
Xu Y G, He B, Chung S L, et al. 2004. Geologic, geochemical, and geophysical consequences of plume involvement in the Emeishan flood-basalt province. Geology, 32(10): 917-920. DOI:10.1130/G20602.1 |
Yang Y, Yao H J, Wu H X, et al. 2020. A new crustal shear-velocity model in Southwest China from joint seismological inversion and its implications for regional crustal dynamics. Geophysical Journal International, 220(2): 1379-1393. DOI:10.1093/gji/ggz514 |
Yang Y J, Ritzwoller M H, Zheng Y, et al. 2012. A synoptic view of the distribution and connectivity of the mid-crustal low velocity zone beneath Tibet. Journal of Geophysical Research: Solid Earth, 117(B4): B04303. DOI:10.1029/2011JB008810 |
Yano T, Tanimoto T, Rivera L. 2009. The ZH ratio method for long-period seismic data: inversion for S-wave velocity structure. Geophysical Journal International, 179(1): 413-424. DOI:10.1111/j.1365-246X.2009.04293.x |
Yao H J, Van Der Hilst R D, De Hoop M V. 2006. Surface-wave array tomography in SE Tibet from ambient seismic noise and two-station analysis-I. Phase velocity maps. Geophysical Journal International, 166(2): 732-744. DOI:10.1111/j.1365-246X.2006.03028.x |
Yao H J, Beghein C, Van Der Hilst R D. 2008. Surface wave array tomography in SE Tibet from ambient seismic noise and two-station analysis-II. Crustal and upper-mantle structure. Geophysical Journal International, 173(1): 205-219. DOI:10.1111/j.1365-246X.2007.03696.x |
Yao H J, Van Der Hilst R D, Montagner J P. 2010. Heterogeneity and anisotropy of the lithosphere of SE Tibet from surface wave array tomography. Journal of Geophysical Research: Solid Earth, 115(B12): B12307. DOI:10.1029/2009JB007142 |
Yin A, Harrison T M. 2000. Geologic evolution of the Himalayan-Tibetan Orogen. Annual Review of Earth and Planetary Sciences, 28: 211-280. DOI:10.1146/annurev.earth.28.1.211 |
Yuan Y, Yao H J, Qin Y. 2016. Joint inversion of Rayleigh wave vertical-horizontal amplitude ratios and dispersion based on the Neighborhood Algorithm and its application. Chinese Journal of Geophysics (in Chinese), 59(3): 959-971. DOI:10.6038/cjg20160318 |
Zhang P, Yao H J. 2017. Stepwise joint inversion of surface wave dispersion, Rayleigh wave ZH ratio, and receiver function data for 1D crustal shear wave velocity structure. Earthquake Science, 30(5-6): 229-238. DOI:10.1007/s11589-017-0197-0 |
Zhang Z J, Yuan X H, Chen Y, et al. 2010. Seismic signature of the collision between the east Tibetan escape flow and the Sichuan Basin. Earth and Planetary Science Letters, 292(3-4): 254-264. DOI:10.1016/j.epsl.2010.01.046 |
Zhang Z J, Deng Y F, Teng J W, et al. 2011. An overview of the crustal structure of the Tibetan plateau after 35 years of deep seismic soundings. Journal of Asian Earth Sciences, 40(4): 977-989. DOI:10.1016/j.jseaes.2010.03.010 |
Zhang Z Q, Yao H J, Yang Y. 2020. Shear wave velocity structure of the crust and upper mantle in Southeastern Tibet and its geodynamic implications. Science China: Earth Sciences, 63(9): 1278-1293. DOI:10.1007/s11430-020-9625-3 |
Zhao L F, Xie X B, He J K, et al. 2013. Crustal flow pattern beneath the Tibetan Plateau constrained by regional Lg-wave Q tomography. Earth and Planetary Science Letters, 383: 113-122. DOI:10.1016/j.epsl.2013.09.038 |
Zheng C, Ding Z F, Song X D. 2016. Joint inversion of surface wave dispersion and receiver functions for crustal and uppermost mantle structures in Southeast Tibetan Plateau. Chinese Journal of Geophysics (in Chinese), 59(9): 3223-3236. DOI:10.6038/cjg20160908 |
Zhou L Q, Liu J, Su Y J, et al. 2009. Tomography for Q of Yunnan region from high-frequency attenuation of S wave. Chinese Journal of Geophysics (in Chinese), 52(6): 1500-1507. DOI:10.3969/j.issn.0001-5733.2009.06.011 |
陈赟, 王振华, 郭希, 等. 2017. 古地幔柱作用"遗迹"的深部地球物理探测-以峨眉山大火成岩省为例. 矿物岩石地球化学通报, 36(3): 394-403. DOI:10.3969/j.issn.1007-2802.2017.03.003 |
何斌, 徐义刚, 肖龙, 等. 2003. 峨眉山大火成岩省的形成机制及空间展布: 来自沉积地层学的新证据. 地质学报, 77(2): 194-202. DOI:10.3321/j.issn:0001-5717.2003.02.007 |
李永华, 吴庆举, 田小波, 等. 2009. 用接收函数方法研究云南及其邻区地壳上地幔结构. 地球物理学报, 52(1): 67-80. |
刘伟, 吴庆举, 张风雪. 2019. 利用双差层析成像方法反演青藏高原东南缘地壳速度结构. 地震学报, 41(2): 155-168. DOI:10.11939/jass.20180083 |
鲁来玉, 何正勤, 丁志峰, 等. 2014. 基于背景噪声研究云南地区面波速度非均匀性和方位各向异性. 地球物理学报, 57(3): 822-836. DOI:10.6038/cjg20140312 |
潘佳铁, 李永华, 吴庆举, 等. 2015. 青藏高原东南部地区瑞雷波相速度层析成像. 地球物理学报, 58(11): 3993-4006. DOI:10.6038/cjg20151109 |
王椿镛, 楼海, 吴建平, 等. 2002. 腾冲火山地热区地壳结构的地震学研究. 地震学报, 24(3): 231-242. DOI:10.3321/j.issn:0253-3782.2002.03.002 |
王健, 张均, 仲文斌, 等. 2018. 川滇黔地区天宝山、会泽铅锌矿床成矿流体来源初探: 来自流体包裹体及氦氩同位素的证据. 地球科学, 43(6): 2076-2099. |
吴建平, 杨婷, 王未来, 等. 2013. 小江断裂带周边地区三维P波速度结构及其构造意义. 地球物理学报, 56(7): 2257-2267. DOI:10.6038/cjg20130713 |
徐涛, 张忠杰, 刘宝峰, 等. 2015. 峨眉山大火成岩省地壳速度结构与古地幔柱活动遗迹: 来自丽江-清镇宽角地震资料的约束. 中国科学: 地球科学, 45(5): 561-576. DOI:10.1007/s11430-015-5094-6 |
胥颐, 杨晓涛, 刘建华. 2013. 云南地区地壳速度结构的层析成像研究. 地球物理学报, 56(6): 1904-1914. DOI:10.6038/cjg20130613 |
徐义刚, 钟孙霖. 2001. 峨眉山大火成岩省: 地幔柱活动的证据及其熔融条件. 地球化学, 30(1): 1-9. DOI:10.3321/j.issn:0379-1726.2001.01.002 |
袁艺, 姚华建, 秦岩. 2016. 基于邻域算法的瑞利面波垂直-水平振幅比及频散曲线联合反演及应用. 地球物理学报, 59(3): 959-971. DOI:10.6038/cjg20160318 |
张培震, 邓起东, 张国民, 等. 2003. 中国大陆的强震活动与活动地块. 中国科学(D辑), 33(S1): 12-20. DOI:10.3969/j.issn.1674-7240.2003.z1.002 |
张中杰, 白志明, 王椿镛, 等. 2005a. 三江地区地壳结构及动力学意义: 云南遮放-宾川地震反射/折射剖面的启示. 中国科学D辑: 地球科学, 35(4): 314-319. DOI:10.3969/j.issn.1674-7240.2005.04.003 |
张智奇, 姚华建, 杨妍. 2020. 青藏高原东南缘地壳上地幔三维S波速度结构及动力学意义. 中国科学: 地球科学, 50(9): 1242-1258. DOI:10.1360/SSTe-2020-0016 |
郑晨, 丁志峰, 宋晓东. 2016. 利用面波频散与接收函数联合反演青藏高原东南缘地壳上地幔速度结构. 地球物理学报, 59(9): 3223-3236. DOI:10.6038/cjg20160908 |
周龙泉, 刘杰, 苏有锦, 等. 2009. 利用S波高频衰减参数对云南地区地壳Q值成像. 地球物理学报, 52(6): 1500-1507. DOI:10.3969/j.issn.0001-5733.2009.06.011 |