 2021, Vol. 64


2. 中国气象局气象干部培训学院, 北京 100081;
3. 中国科学研究院大气物理研究所, 北京 100029;
4. 山西省长治市气象局, 山西 长治 046000
2. Training Centre, China Meteorological Administration, Beijing 100081, China;
3. Institute of Atmospheric Physics, Chinese Academy of Sciences, Beijing 100029, China;
4. Changzhi Meteorological Bureau of Shanxi Province, Changzhi Shanxi 046000, China
自从Dodson等(1974)发现太阳射电通量(10.7 cm,2800 MHz)的日平均值与太阳黑子数11a周期变化一致之后,由于太阳射电通量的观测精度优于太阳黑子数,人们常常用10.7 cm太阳射电通量数值代替太阳黑子数.太阳射电通量的观测系统所得资料比太阳黑子数的观测要精确和客观,与太阳黑子相对数的极大和极小值非常重合,位相几乎完全相同,相关系数超过了0.9,信度水平在0.01以上(吴统文等, 1989a, b).
太阳辐射对地球气候系统有显著的影响(Haigh, 1996; Svensmark, 2007; 蒋样明等, 2011),在几十到百年时间尺度上,太阳活动异常曾经对地球气候产生较大影响(Nesme-Ribes, 1995; Gray et al., 2009; Solomon et al., 2007),与全球气候变化之间存在着较为密切的联系(Lean et al., 1995; Friis-Christensen and Lassen, 1991; 竺可桢, 1973; 赵娟等, 1999; 汤懋苍等, 2001; 杨保等, 2002; 陈星等, 2005; 徐群, 2010; 张亮等, 2011; 顾震年, 1991),在对流层大气和地表面气象场中都留下了痕迹(Van Loon and Shea, 2000; Lean and Rind, 2001; Gleisner and Thejll, 2003; Weng, 2003; Coughlin and Tung, 2004; Foukal et al., 2006).
海洋是地球气候系统的重要组成部分,其对太阳活动有着较为明显的响应(Reid, 1987, 1991; White et al., 1997, 1998; 曲维政, 2004).科学家们发现,热带太平洋SST对太阳活动11a周期的响应具有La Nina型信号特征(Van Loon et al., 2007; Van and Meehl, 2008; Meehl et al., 2008, 2009; Meehl and Arblaster, 2009),有的则发现弱的El Nino的信号(White et al., 1997, 1998; Tung and Zhou, 2010; Roy and Haigh, 2010),这些研究成果的差异,除去对数据的处理方法不同之外(Van Loon and Meehl, 2008; Tung and Zhou, 2010),很有可能是强的ENSO年际信号强于太阳活动的信号所致(Roy et al., 2012).所以,研究太阳活动对气候影响最好去除ENSO强信号的污染和干扰.本文在处理SRF对海温影响的时候采用了5a滑动平均的方法,以达到去除ENSO信号干扰的目的.
降水作为一个较为敏感的气候要素,与温度相比要复杂得多,受到各种因子的影响,其中太阳活动和海温就是比较重要的两个物理因子.很多研究表明,太阳活动对全球各地的降水有着不可忽视的影响(Zhao and Wang, 2014; Zhao et al., 2017; 宋燕, 2016a, b; 刘广深等, 1996; 贾鹏群等, 2001; 丁一汇, 2019; Ma et al., 2007; 潘静等, 2010; 段长春和孙绩华, 2006; 董安祥等, 1999).海温对降水的影响研究结果更为丰富,其中ENSO对全球和中国降水研究文献较多(李海燕等, 2016; 金祖辉和陶诗言, 1999; 伍红雨和吴遥, 2018; 董婕和刘丽敏, 2000; 强学民和杨修群, 2013; 赵永晶和钱永甫, 2009; 吴洪宝和段安民, 1998; 赵强和严华生, 2014; 王澄海等, 2002).
但是太阳活动如何通过对全球海温的影响,进而影响全球降水,这个研究领域鲜有人涉及.本文通过研究太阳活动对不同全球垂向海温的影响,得到对太阳活动响应显著的海温区域,检测其太阳活动11a周期信号,然后定义一个海温异常指数,研究海温异常指数对全球和中国冬、夏季降水的影响.
1 资料和方法 1.1 资料本文采用表征太阳活动的参数来自美国国家海洋局(NOAA)数据中心的10.7 cm(2800 MHz)太阳射电通量数据(SRF), 网址是http://www.esrl.noaa.gov/psd/data/correlation/solar.data, 其单位为sfu(1sfu=10-22W·m-2·Hz-1)(1947—2016年).海温距平资料源自美国国家海洋地理数据中心(NODC)的WOA09数据集(World Ocean Atlas, http://www.nodc.noaa.gov)(1955—2016年),格点分辨率为1°×1°,垂向包括0~700 m和0~2000 m两套水深,本文用的是垂向0~700 m海温资料,经过5a滑动平均处理.全球降水资料为NOAA的CMAP月降水率资料(CPC merged analysis of precipitation)(1979/1—2017/9),格点分辨率为2.5点×2.5点.NCEP海洋位温资料来自GODAS(Global ocean data assimilation system)的月位温资料(1981/1—2017/12),T62高斯格点,垂直方向分为40层.
1.2 方法(1) 功率谱方法介绍
功率谱分析是以傅里叶变换为基础的频域分析方法,其意义为将时间序列的总能量分解到不同频率上的分量,根据不同频率波的方差贡献诊断出序列的主要周期,从而确定周期的主要频率,即序列隐含的显著周期.
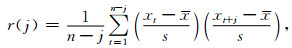
对于一个时间序列xt,最大滞后时间长度为m的自相关系数r(j)(j=0, 1, 2, …, m)为
|
(1) |
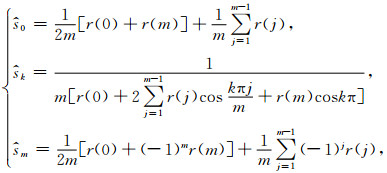
公式(1)中x为序列的均值,s为序列的标准差.由下式得到不同波数k的粗谱估计值:
|
(2) |
式中r(j)表示第j个时间间隔上的相关函数.本文最大滞后时间长度m取为21,时间序列为距平场.
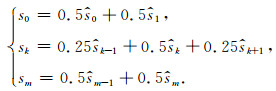
对上述方法得到的谱估计采用Hanning平滑系数进行平滑处理,得到平滑谱估计值.
|
(3) |
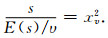
用红噪声标准谱对谱估计作显著性检验.假设总体谱是某一随机过程的谱,记为E(s),则
|
(4) |
公式(4)遵从自由度为υ的χ2分布.自由度υ与样本量n及最大滞后长度m有关,即
|
(5) |
给定显著性水平α,查χ2分布表得到

|
(6) |
若谱估计值sk>s′0k,则表明k波数对应的周期波动是显著的.本文
以上方法引自《现代气候统计诊断与预测技术》(魏凤英,2007).
(2) CMD方法介绍
CMD方法通常用来推断对太阳活动响应的气候要素场的空间分布型(Camp and Tung, 2007),在本文中通过运用CMD方法计算获得太阳活动高年和低年气候要素差值场的空间分布型,即将SRF标准化数值大(小)于零的年份划归为太阳活动高(低)年,从而得到两组对应太阳活动高低年的气候要素数据,计算两组数据的差值,从而得到气候要素对SRF响应的空间分布.
2 结果分析 2.1 全球海温原始资料对太阳射电通量的响应事实表明,1947—2016年太阳射电通量(SRF)与太阳总辐射(Total Solar Irradiance, 缩写为TSI)相关系数是0.92,为显著的正相关关系,通过0.001的显著性检验.因此,用SRF代表太阳活动是合适的.首先,将SRF序列标准化(图 1),根据SRF的标准化量值将1955—2016年共62 a时间序列分为太阳活动高值年和低值年两类.前者包括SRF标准化后量值>0的25 a,后者包括SRF标准化后量值<0的37 a.然后采用合成平均差(将全球各格点海温距平按照太阳活动高值年和低值年分为两组,计算两组的平均值之差),得到全球0~700 m各层海温对太阳辐射变化的响应空间分布模态(图略),发现其中0~200 m的响应比较显著,深于200 m的各层海温反应不很明显,因此,给出全球0~200 m各层海温距平对SRF的响应累加值空间分布模态,如图 2所示.

|
图 1 太阳射电通量SRF的标准化序列(1955—2016年) Fig. 1 The normalized Solar Radio Flux during 1955—2016 |

|
图 2 全球0~200 m海温距平对太阳射电通量(SRF)响应的合成平均差值(CMD). A区域和B区域分别是海温对太阳辐射响应显著的区域,暖色为正响应,冷色为负响应 Fig. 2 The composite mean difference (CMD) of global 0~200 m sea temperature anomaly response to SRF. Region A and Region B stand for the two areas where sea temperature respond to solar radiation significantly. Region A is the negative-responding area while Region B is the positive-responding area |
从图 2可以看出,海温对太阳射电通量的响应具有空间分布的不均匀性,热带太平洋上有两个对SRF响应显著的海温区域,即A区域(125—160°E,0—20°N)和B区域(160°E—130°W,10°S—10°N),与Wang等(2015)利用海洋热容量资料所检测到的对太阳活动响应显著的区域非常一致.这种响应强弱的空间分布不均匀可能是太阳与地球气候系统的非线性相互作用导致的,使得局部海温对太阳活动有显著的影响(Christoforou and Hameed, 1997).为了检测A区和B区是否具有与太阳活动同样的11a周期,我们做了功率谱分析和红噪声显著周期检验,结果表明,海温显著异常A区域没有11a显著周期,而B区域具有近似10a的显著性周期,并且通过了0.05的显著性水平检验,如图 3所示.

|
图 3 海温异常A区域(a)和B区域(b)的功率谱分析和红噪声显著周期检验 Fig. 3 Red noise significant test for the sea temperature anomalies and power spectrum analysis of Region A and Region B |
从图 3可以看出,A区域和B区域都存在3~4 a的显著周期信号,毋庸置疑,这是ENSO强信号的主周期.在分析太阳活动的影响时,应该去除海温中ENSO的强年际信号,更加突出太阳活动的影响.为此,我们对全球海温距平数据进行了5 a滑动平均,以去除ENSO信号.
2.2 去除ENSO信号影响后全球海温对太阳辐射的响应将全球海温距平场进行5 a滑动平均后,我们得到1957—2014年共58a的全球海温距平时间序列资料.同样地,将SRF标准化后量值>0的24 a和SRF标准化后量值<0的34 a作为太阳活动高值年和低值年.然后采用合成平均差(将全球各格点海温距平按照太阳活动高值年和低值年分为两组,计算两组的平均值之差),得到全球海平面以下0~700 m共8层海温异常对太阳活动响应的合成差场图,如图 4所示.

|
图 4 经过5 a滑动平均后的全球海温距平对太阳射电通量响应的合成差场 (a)、(b)、(c)、(d)、(e)、(f)、(g)、(h)分别对应海温垂向0 m、100 m、200 m、300 m、400 m、500 m、600 m、700 m. Fig. 4 The composite mean difference (CMD) derived spatial pattern of global sea temperature anomalies responded to SRF after 5-year running mean (a) (b), (c), (d), (e), (f), (g) and (h) correspond to the sea temperature anomaly of 0 m, 100 m, 200 m, 300 m, 400 m, 500 m, 600 m and 700 m below the sea surface respectively. |
由图 4可以看出,各层海温对太阳辐射的响应空间模态表明0~200 m海温对太阳射电通量的响应比较强,尤其是100 m海温异常最为显著,而200 m以下海温对太阳活动的响应就变得比较弱了.100 m热带太平洋上海温异常存在A区域(120—150°E,0—20°N)和B区域(120—170°W,5°S—10°N)两个响应的显著区域,前者为海温异常的负值响应区,后者为海温异常的正值响应区.经过功率谱检测A区和B区的年序列显著性周期发现,A区域的显著性周期分别为17a、11.3a、3.4a;B区域的显著性周期为17a、11.3a和8.5a.可见,两个区域都存在太阳活动的11.3a周期.因此,热带太平洋地区海温存在对太阳活动的显著响应.
由于0~200 m对SRF的响应比较显著,我们将0~200 m层海温异常累加起来分析其对SRF高值年和低值年响应的合成差场,结果如图 5所示.图中显示太平洋有6个对SRF显著响应的海温异常区域,分别是A、B、C、D、E、F区域,其中B、D、F区域是对太阳活动的正响应,A、C、E区域为负响应;南印度洋有2个显著区域,分别是G区域和H区域,前者是正响应,后者是负响应;南大西洋有2个显著区域,分别是I区域和J区域,其中J区域是正响应,I区域是负响应.全球海温共有10个显著响应的区域.

|
图 5 经过5 a滑动平均后的全球海洋0~200 m海温距平累加对太阳射电通量响应的合成差场. A—J区域分别是海温对太阳辐射响应显著的区域,暖色为正响应,冷色为负响应 Fig. 5 The composite mean difference (CMD) of the global ocean 0~200 m accumulated sea temperature anomalies responded to SRF after 5-year running mean. The Boxes A—J are the regions with significant responses to SRF, with the warm colors as the positive responses and the cold colors as the negative responses |
图 5中10个显著响应区域的范围和显著周期如表 1所示,其中B、D、F、G、J为正响应显著区,而A、C、E、H、I为负响应显著区.
|
|
表 1 全球海洋0~200 m海温距平累加对太阳射电通量响应的显著区域范围和显著周期 Table 1 Ranges and periods of high-responding regions to SRF of 0~200 m accumulated global sea temperature anomalies |
从表 1可以看出,全球十个显著的响应区域中有6个区域可以检测出与太阳活动相近的11.3a显著周期,并都通过了红噪声95%的信度检验.这6个区域分别是A、C、D、E、I、J区域,前4个在太平洋,后2个在南大西洋,南印度洋的两个显著区域不具有显著的11a周期,太平洋的B区和F区域也不具有太阳活动11a显著周期.利用NCEP再分析海温资料进行同样的分析,得到类似的结果(图略),说明所得结论是可靠的.
选取发生在热带太平洋的海温负、正响应显著区域,即A、D区域进一步分析太阳活动的11a周期信号.首先将这两个区域的海温距平沿经向展开(如图 6所示),两个区域的海温距平都表现出准11a的周期振荡信号.对两个区域进行功率谱分析(图 7),可见两个区域的平均海温距平都具有11a左右的显著周期,均通过了红噪声95%信度水平的检验.说明这2个区域的海温对SRF的异常活动比较敏感,反应比较明显.

|
图 6 图 5中热带太平洋A(a)、D(b)区域0~200 m海温距平时间-经向剖面图 Fig. 6 Time-longitudinal diagram of 0~200 m accumulated sea temperature anomalies of Region A (a) and Region D (b) in the tropical central Pacific Ocean in Fig. 5 |

|
图 7 图 5中热带太平洋A(a)、D(b)区域0~200 m海温的功率谱分析(实线为谱估计值,虚线为α=0.05的红噪声标准谱) Fig. 7 Power spectrum of 0~200 m accumulated sea temperature anomalies in Region A (a) and Region D (b) of tropical Pacific Ocean in Fig. 5(the solid line is the actual estimated spectrum, and the dotted line is the red noise standard spectrum with α=0.05) |
现在我们再把南北太平洋中部地区的2个显著区域C和E海温距平沿经向展开(如图 8所示),两个区域的海温距平也能发现较为明显的准11a周期振荡信号,E区有明显的年代际变化,在1991年之前11a周期信号比较显著,而1991年之后11a周期信号比较弱,可能与太阳活动第24个周期峰值较弱有关系.

|
图 8 图 5中南北太平洋中部地区C区域(a)、E区域(b)0~200 m海温距平时间-经向剖面图 Fig. 8 Time-longitudinal diagram of 0~200 m accumulated sea temperature anomalies of Region C (a) in the northern central Pacific Ocean and Region E (b) in the southern central Pacific Ocean in Fig. 5 |
2004年曲维政北太平洋中部地区400 m深海温度异常的功率谱分析表明其具有太阳活动的11a周期信号.在这里我们对C区和E区的海温异常进行功率谱分析,也发现两个区域的平均海温距平都具有11a左右的显著周期(如图 9所示).证明这2个区域的海温对SRF的响应也比较敏感.

|
图 9 南北太平洋中部地区C、E区域0~200 m海温的功率谱(a、b分别对应C、E区域,实线为谱估计值,虚线为α=0.05的红噪声标准谱) Fig. 9 Power spectrum of 0~200m accumulated sea temperature anomalies in Region C (a) in the northern central Pacific Ocean and Region E (b) in the southern central Pacific Ocean in Fig. 5(the solid line is the actual estimated spectrum, and the dotted line is the red noise standard spectrum with α=0.05) |
同样地,我们分析了大西洋I区域和J区域的0~200 m海温距平时间-经向剖面图(图略),得出了类似的结论,在此不再赘述.
2.3 显著响应太阳活动的海温异常对全球降水的影响根据上节研究得到的对太阳活动活动显著响应的全球海温异常区域,定义一个对太阳活动显著响应的海温异常指数Z=STD+STJ-STA-STC-STE-STI, 其中STD、STJ、STA、STC、STE、STI分别为D、J、A、C、E、I区域0~200 m海温距平的5a滑动区域平均值, 得到其时间序列和趋势线如图 10所示,可以看出,其年代际变化比较显著,表现在1995年之前,指数振荡比较平稳,趋势不明显,但是在1995年之后,其具有明显的下降趋势.总体来看,指数具有显著的下降趋势,说明海温响应的强度在近20a来明显变弱,以负位相为主.海温异常指数与SRF曲线非常吻合,去趋势前和去趋势之后与SRF同期相关系数均通过了0.001的显著性检验.可以看出,SRF比海温异常指数有明显的超前,滞后1年的相关系数同样通过了0.001的显著性检验.

|
图 10 海温异常指数Z的标准化曲线(黑色实线)和去趋势后的曲线(黑色粗点线)、趋势线(黑色虚线)、零线(黑色细点线)和SRF标准化序列(红色实线) Fig. 10 The annual-mean normalized sea temperature anomalies index Z (black solid line) and detrended index Z (black dotted line), index Z trend line (black dashed line), zero line (light dotted line) and normalized SRF (red solid line) |
将海温异常指数Z与全球夏季降水率(全部经过5a滑动平均)求取同期和滞后1年的相关,相关系数的空间分布如图 11所示,阴影区是通过90%信度水平的区域.

|
图 11 海温异常指数Z与全球夏季降水率同期(a)和滞后1年(b)的相关系数(小图为青藏高原地区),其中阴影区是达到90%信度水平的显著异常区,实线是0.5等值线,虚线是-0.5等值线 Fig. 11 Synchronization (a) and lag (b) correlation of sea temperature anomaly index Z and summer precipitation (the mini pictures show that in the Tibetan plateau area), (the shaded areas are those with over 90% confidence level, the solid line is 0.5 isoline, and the dotted line is -0.5 isoline) |
从图 11可以看出,太阳活动造成的海温异常,对同期和滞后1年的夏季降水的影响有相似的空间分布型,在热带中部太平洋和东南太平洋地区造成较为丰富的降水,南北半球太平洋中高纬度地区降水也偏多,南极地区降水显著偏少.这种降水分布与海温异常对太阳活动的响应(图 5)相对应,在热带中太平洋正的海温异常的区域对应丰富的夏季降水,在冷异常海温的南极地区对应少的降水,在南北两个半球中高纬度地区较暖的海温异常对应多的夏季降水.Von Loon和Meehl(2011)研究结果表明,太阳活动偏强时,Hadley环流偏强,热带降水偏多;副极地低压带气压偏低、降水偏多;南极涛动偏弱,南极地区夏季降水偏少.但是也有不一致的的地方,反映在热带太平洋海温异常分布有偏差,西太平洋地区海温异常为负值,中太平洋地区是正值,东太平洋地区又是负值(图 2和图 5),类似于中部型厄尔尼诺事件造成的对流偶极子分布.以上偏差的原因可能是所用的资料和方法不同,本文太阳活动数据用的是SRF(Van Loon用的是太阳黑子数据),海温为不同层次海温的累加,图 11所用是夏季降水资料,而Van Loon等人用的是冬季降水资料.
另外,从图 11可以看出,太阳活动造成的海温异常对中国地区夏季降水的显著影响集中在某些地区,比如江南东部地区福建、浙江和台湾地区一带、山东半岛、青藏高原中部和东北部地区,都是降水减少比较显著的区域,说明由太阳活动造成的海温异常在这些地区可以放大太阳活动的信号,从而对夏季降水产生影响.在做短期夏季降水预测时应该注意太阳活动对这些地区降水的影响.
同样,太阳活动造成的海温异常,对同期和滞后1年的冬季降水的影响有相似的空间分布型(图 12),在热带中部太平洋和东南太平洋地区造成较为丰富的降水,赤道西太平洋降水明显偏少.北极地区降水显著偏多,类似于北极涛动的正位相降水.这种降水分布与海温异常对太阳活动的响应的热带分布(图 5)相对应,热带西太平洋和孟加拉湾负的海温异常对应较少的降水,在南北两个半球中高纬度地区较暖的海温异常对应多的降水.

|
图 12 海温异常指数Z与全球冬季降水率同期(a)和滞后1年(b)的相关系数,其中阴影区是达到90%信度水平的显著异常区,实线是0.5等值线,虚线是-0.5等值线 Fig. 12 The same as Fig. 11 but for winter |
图 12分别是海温异常指数Z与全球冬季降水率(5a滑动平均)同期(图 12a)和滞后1年(图 12b)的相关系数的空间分布.从图 12可以看出,太阳活动造成的海温异常对中国地区冬季降水的影响也集中在某些地区,比如华南地区广西和广东西部、海南一带降水增多,东北地区降水减少,青藏高原地区降水显著增加,说明由太阳活动造成的海温异常在这些地区可以放大太阳活动的信号,从而对冬季降水产生影响.青藏高原地区海拔高度较高,冬季降水以降雪为主,因此,太阳活动造成的结果是太阳活动高值年通过对海温的影响造成冬季高原积雪增加,这与宋燕等(2016a, b)和Li等(2016)所指出的冬季太阳射电通量与高原冬春季积雪正相关的研究结果是一致的.
3 结论根据以上研究结果分析,我们发现全球海温异常对太阳射电通量的响应在某些区域比较显著,在去掉了ENSO较强的年际信号之后,结论仍然成立.这些显著响应的海温,可以进一步影响同期和滞后1年的夏季降水,从而放大太阳活动的信号,对全球降水异常产生影响.具体结论如下:
(1) 全球海洋不同层次的海温距平对太阳辐射响应有所不同,其中0~200 m深度的海温对太阳活动的响应更为显著,200 m以下的海温对太阳活动的响应明显减弱.功率谱分析表明,在太平洋、大西洋和印度洋地区都存在响应太阳活动的显著区域,其中热带太平洋和南北半球的太平洋中部地区海温异常、南大西洋地区共6个海温异常区域具有显著的太阳活动强11a周期信号,这些区域海温距平的时间-经向剖面图显示,海温异常具有较为明显的11a振荡现象,说明这些区域的海温异常确实受到了太阳活动的影响.
(2) 利用对太阳活动活动显著响应的全球海温异常区域,定义一个对太阳活动显著响应的海温异常指数Z=STD+STJ-STA-STC-STE-STI,其具有明显的年代际变化和1995年以来显著的下降趋势,由正位相转为负位相.
(3) 计算海温异常指数Z与全球夏季降水同期和滞后1年的相关系数空间分布发现,对太阳活动有显著响应的海温异常可以引起热带太平洋中部地区的降水增多,南北半球中高纬地区降水增加,呈带状分布.说明太阳活动通过对海温的影响会造成ITCZ降水和副极地低压带降水的增加,但是南极地区降水显著减少.另外,我国江南东部地区、山东半岛、青藏高原中部和东北部地区也是显著响应的地区,在太阳活动强的时期降水有明显的减少.
(4) 海温指数与全球冬季降水同期和滞后1年的相关系数空间分布发现,指数高时,热带中部太平洋和东南太平洋地区降水增多,赤道西太平洋降水明显偏少.北极地区降水显著偏多,类似于北极涛动的正位相降水.另外,热带西太平洋和孟加拉湾降水减少,南北两个半球中高纬度地区降水增多.中国地区冬季降水异常表现在,华南地区广西和广东西部、海南一带降水增多,东北地区降水减少,青藏高原地区降水显著增加.
以上的分析说明,由太阳活动造成的海温异常在这些地区可以放大太阳活动的信号,进而对全球降水产生影响.由此可见,全球海温某些区域对太阳活动有较为显著的响应,并且通过这些异常的响应对全球降水有明显的影响,从而放大太阳活动对气候系统的影响.但是,太阳活动的显著影响为何集中在海洋的某些区域,以及通过哪些物理过程影响这些海域,这都是需要利用包含太阳-气候系统的模型进一步研究的问题.
致谢 感谢国家气象卫星中心张效信研究员,在讨论中给予有益的建议.
Camp C D, Tung K K. 2007. Surface warming by the solar cycle as revealed by the composite mean difference projection. Geophysical Research Letters, 34(14): L14703. DOI:10.1029/2007GL030207 |
Chen X, Liu J, Wang S M. 2005. Climate simulation of little ice age over Eastern Asia. Scientia Meteorologica Sinica (in Chinese), 25(1): 1-8. |
Christoforou P, Hameed S. 1997. Solar cycle and the Pacific 'centers of action'. Geophysical Research Letters, 24(3): 293-296. DOI:10.1029/97GL00017 |
Coughlin K, Tung K K. 2004. Eleven-year solar cycle signal throughout the lower atmosphere. Journal of Geophysical Research: Atmospheres, 109(D21): D21105. DOI:10.1029/2004JD009873 |
Ding Y H. 2019. Effect of solar activity on earth's climate and weather. Meteorological Monthly (in Chinese), 45(3): 297-304. |
Dodson H W, Hedeman E R, Mohler O C. 1974. Comparison of activity in solar cycles 18, 19, and 20. Reviews of Geophysics, 12(3): 329-341. DOI:10.1029/RG012i003p00329 |
Dong A X, Zhu X N, Guo H. 1999. Sun activity and precipitation in Northwest China. Journal of Gansu Sciences (in Chinese), 11(4): 14-17. |
Dong J, Liu L M. 2000. The relationship of temperature and precipitation in China and the ocean temperature in the Equatorial East Pacific. Meteorological Monthly (in Chinese), 26(2): 25-28. |
Duan C C, Sun J H. 2006. Relationship between abnormal solar activities and precipitation and temperature in China. Meteorological Science and Technology (in Chinese), 34(4): 381-386. |
Foukal P, Fröhlich C, Spruit H, et al. 2006. Variations in solar luminosity and their effect on the Earth's climate. Nature, 443(14): 161-166. DOI:10.1038/nature05072 |
Friis-Christensen E, Lassen K. 1991. Length of the solar cycle: An indicator of solar activity closely associated with climate. Science, 254(5032): 698-700. DOI:10.1126/science.254.5032.698 |
Gleisner H, Thejll P. 2003. Patterns of tropospheric response to solar variability. Geophysical Research Letters, 30(13): 1711. DOI:10.1029/2003GL017129 |
Gray L J, Beer J, Geller M, et al. 2010. Solar influences on climate. Reviews of Geophysics, 48(4): RG4001. DOI:10.1029/2009RG000282 |
Gu Z N. 1991. The effect of solar activity on the terrestrial climate and Earth rotation. Progress in Astronomy (in Chinese), 9(1): 51-59. |
Haigh J D. 1996. The impact of solar variability on climate. Science, 272(5264): 981-984. DOI:10.1126/science.272.5264.981 |
Jia P Q, Shi G Y. 2001. Study on the effects of volcanic eruption and solar activity on climate in China in recent 50 years. Plateau Meteorology (in Chinese), 20(3): 225-233. |
Jiang Y M, Peng G X, Shao X D. 2011. Natural drive is the important factor of Global climate change. Meteorological and Environmental Sciences (in Chinese), 34(2): 7-13. |
Jin Z H, Tao S Y. 1999. A study on the relationships between ENSO cycle and rainfalls during summer and winter in Eastern China. Chinese Journal of Atmospheric Sciences (in Chinese), 23(6): 663-672. |
Lean J, Beer F, Bradley R. 1995. Reconstruction of solar irradiance since 1610:Implications for climate change. Geophysical Research Letters, 22(23): 3195-3198. DOI:10.1029/95GL03093 |
Lean J, Rind D. 2001. Earth's response to a variable Sun. Science, 292(5515): 234-236. DOI:10.1126/science.1060082 |
Li H Y, Zhang W J, H e J H. 2016. Influences of ENSO and its combination mode on seasonal precipitation over eastern China. Acta Meteorologica Sinica (in Chinese), 74(3): 322-334. |
Li Z C, Song Y, Zhang W, et al. 2016. Interdecadal correlation of solar activity with Tibetan Plateau Snow Depth and winter atmospheric circulation in East Asia. Sciences in Cold and Arid Regions, 8(6): 524-535. |
Liu G S, Mi J R, Qi C M, et al. 1996. Relationship between the solar forcing and periodic variations of meteoric water in the Northeastern China. Journal of Changchun University of Earth Sciences (in Chinese), 26(4): 422-427. |
Loon H V, Meehl G A, Shea D J. 2007. Coupled air sea response to solar forcing in the Pacific region during northern winter. Journal of Geophysical Research: Atmospheres, 112(D2): D02108. DOI:10.1029/2006JD007378 |
Ma L H, Han Y B, Yin Z Q. 2007. The possible influence of solar activity on Indian summer monsoon rainfall. Applied Geophysics, 4(3): 231-237. DOI:10.1007/s11770-007-0029-4 |
Meehl G A, Arblaster J M, Branstator G, et al. 2008. A coupled air-sea response mechanism to solar forcing in the Pacific region. Journal of Climate, 21(12): 2883-2897. DOI:10.1175/2007JCLI1776.1 |
Meehl G A, Arblaster J M. 2009. A lagged warm even-like response to peaks in solar forcing in the Pacific region. Journal of Climate, 22(13): 3647-3660. DOI:10.1175/2009JCLI2619.1 |
Meehl G A, Arblaster J M, Matthes K, et al. 2009. Amplifying the Pacific climate system response to a small 11-year solar cycle forcing. Science, 325(5944): 1114-1118. DOI:10.1126/science.1172872 |
Nesme-Ribes E. 1995. The maunder minimum and the deepest phase of the little ice age. Solar Output and Climate during the Holocene. German, 14th EPC/ESF Workshop, 131-144.
|
Pan J, Li C Y, Gu W. 2010. The possible impact of solar activity on summer rainfall anomaly in Eastern China. Scientia Meteorologica Sinica (in Chinese), 30(5): 574-581. |
Qiang X M, Yang X Q. 2013. Relationship between the first rainy season precipitation anomaly in South China and the sea surface temperature anomaly in the Pacific. Chinese Journal of Geophysics (in Chinese), 56(8): 2583-2593. DOI:10.6038/cjg20130808 |
Qu W Z, Deng S G, Huang F, et al. 2004. Response of change of deep sea temperature to sun activity. Quaternary Sciences (in Chinese), 24(3): 285-292. |
Reid G C. 1987. Influence of solar variability on global sea surface temperatures. Nature, 329(6135): 142-143. DOI:10.1038/329142a0 |
Reid G C. 1991. Solar total irradiance variations and the global sea surface temperature record. Journal of Geophysical Research: Atmospheres, 96(D2): 2835-2844. DOI:10.1029/90JD02274 |
Roy I, Haigh J D. 2010. Solar cycle signals in sea level pressure and sea surface temperature. Atmospheric Chemistry and Physics, 10(6): 3147-3153. DOI:10.5194/acp-10-3147-2010 |
Roy I, Haigh J D. 2012. Solar cycle signals in the Pacific and the issue of timings. Journal of the Atmospheric Sciences, 69(4): 1446-1451. DOI:10.1175/JAS-D-11-0277.1 |
Solomon S, Qin D, Manning M, et al. 2007. Climate Change 2007:The Physical Science Basis. Contribution of Working Group I to the Fourth Assessment Report of the Intergovernmental Panel on Climate Change. Cambridge: Cambridge University Press: 996.
|
Song Y, Li Z C, Xiao Z N, et al. 2016a. Analysis on interdecadal correlation between solar activity and snow depth over the Qinghai-Xizang Plateau and East Asian atmospheric circulation in winter. Plateau Meteorology (in Chinese), 35(5): 1135-1147. |
Song Y, Li Z C, Zhang J, et al. 2016b. Review of progress in modulation effects of solar activity on snow depth over the Tibetan Plateau and East Asian summer monsoon. Advances in Meteorological Science and Technology (in Chinese), 6(3): 148-154. |
Svensmark H. 2007. Cosmoclimatology: A new theory emerges. Astronomy & Geophysics, 48(1): 1.18-1.24. |
Tang M C, Liu Y X, Guo W D. 2001. Climatic condition and Chinese history(I): SCL and Chinese climate. Plateau Meteorology (in Chinese), 20(4): 368-373. |
Tung K K, Zhou J S. 2010. The Pacific's response to surface heating in 130 Yr of SST: La Niña-like or El Niño-like?. Journal of the Atmospheric Sciences, 67(8): 2649-2657. DOI:10.1175/2010JAS3510.1 |
Van Loon H, Shea D J. 2000. The global 11-year solar signal in July-August. Geophysical Research Letters, 27(18): 2965-2968. DOI:10.1029/2000GL003764 |
Van Loon H, Meehl G A. 2008. The response in the Pacific to the Sun's decadal peaks and contrasts to cold events in the Southern Oscillation. Journal of Atmospheric and Solar-Terrestrial Physics, 70(7): 1046-1055. DOI:10.1016/j.jastp.2008.01.009 |
Van Loon H, Meehl G A. 2011. The average influence of decadal solar forcing on the atmosphere in the South Pacific region. Geophysical Research Letters, 38(12): L12804. DOI:10.1029/2011GL047794 |
Wang C H, Wang S G, Yang D B, et al. 2002. The correlation between the Pacific sea surface temperature (SST) and precipitation over NW China. Journal of Tropical Meteorology (in Chinese), 18(4): 374-382. |
Wang G, Yan S X, Qiao F L. 2015. Decadal variability of upper ocean heat content in the Pacific: Responding to the 11-year solar cycle. Journal of Atmospheric and Solar-Terrestrial Physics, 135: 101-106. DOI:10.1016/j.jastp.2015.10.016 |
Wei F Y. 2007. Application of Modern Climate Statistical Diagnosis and Prediction Technology (in Chinese). 2nd ed. Beijing: China Meteorological Press.
|
Weng H Y. 2003. Impact of the 11-yr solar activity on the QBO in the climate system. Advances in Atmospheric Sciences, 20(2): 303-309. DOI:10.1007/s00376-003-0017-4 |
White W B, Lean J, Cayan D R, et al. 1997. Response of global upper ocean temperature to changing solar irradiance. Journal of Geophysical Research: Oceans, 102(C2): 3255-3266. DOI:10.1029/96JC03549 |
White W B, Cayan D R, Lean J. 1998. Global upper ocean heat storage response to radiative forcing from changing solar irradiance and increasing greenhouse gas/aerosol concentrations. Journal of Geophysical Research: Atmospheres, 1032(C10): 21355-21366. |
Wu H B, Duan A M. 1998. ACP analysis of precipitation and temperature of July in China with SSTA of the global tropical oceans. Journal of Nanjing Institute of Meteorology (in Chinese), 21(3): 123-128. |
Wu H Y, Wu Y. 2018. Possible impacts of El Niño events of different types and intensity on precipitation in the subsequent first rainy season in South China. Chinese Journal of Atmospheric Sciences (in Chinese), 42(5): 1081-1095. |
Wu T W, Zheng G, Qu Z. 1989a. Recommendation of the solar radio flux of 10.7 cm (2800 MHz) with the same period and evolution trend as the relative number of sunspots. Advance in Earth Sciences (in Chinese), 4(4): 54. |
Wu T W, Zheng G, Qu Z. 1989b. Discussion on replacing sunspot relative number with solar radio flux. Meteorological Monthly (in Chinese), 15(5): 51-53. |
Xu Q. 2010. Causal analysis and prospects on climate trend of global temperature and recent climate disasters in China. Scientia Meteorologica Sinica (in Chinese), 30(5): 582-590. |
Yang B, Shi Y F, Zhou Q B. 2002. Analyzing the effect of solar and volcanic activities on temperature variations in the Guliya ice core record and in the lower reaches of the Yangtze River over the last three centuries. Journal of Glaciology and Geocryology (in Chinese), 24(1): 40-45. |
Zhang L, Wang C, Fu S Y. 2011. Solar variation and global climate change. Chinese Journal of Space Science (in Chinese), 31(5): 549-566. |
Zhao J, Li Z A, Han T B. 1999. Effect of solar activity and El Nino for rainfall in Beijing and prediction of the rainfall. Progress in Geophysics (in Chinese), 14(1): 123-126. |
Zhao L, Wang J S. 2014. Robust respose of the East Asian monsoon rainband to solar variability. Journal of Climate, 27(8): 3043-3051. DOI:10.1175/JCLI-D-13-00482.1 |
Zhao L, Wang J S, Liu H W, et al. 2017. Amplification of the solar signal in the summer monsoon rainband in China by synergistic actions of different dynamical responses. Journal of Meteorological Research, 31(1): 61-72. DOI:10.1007/s13351-016-6046-6 |
Zhao Q, Yan H S. 2014. Influence of Pacific-Indian ocean SSTA on interannual variation of summer precipitation in Shaanxi. Plateau Meteorology (in Chinese), 33(6): 1608-1617. |
Zhao Y J, Qian Y F. 2009. Analyses of the impacts of global SSTA on precipitation anomaly in China. Journal of Tropical Meteorology (in Chinese), 25(5): 561-570. |
Zhu K Z. 1973. A preliminary study on climate change in China in the past five thousand years. Science in China (in Chinese), 16(2): 2-11. |
陈星, 刘健, 王苏民. 2005. 东亚地区小冰期气候的模拟. 气象科学, 25(1): 1-8. DOI:10.3969/j.issn.1009-0827.2005.01.001 |
丁一汇. 2019. 太阳活动对地球气候和天气的影响. 气象, 45(3): 297-304. |
董安祥, 祝小妮, 郭慧. 1999. 太阳活动与西北地区降水. 甘肃科学学报, 11(4): 14-17. DOI:10.3969/j.issn.1004-0366.1999.04.003 |
董婕, 刘丽敏. 2000. 赤道东太平洋海温与中国温度、降水的关系. 气象, 26(2): 25-28. |
段长春, 孙绩华. 2006. 太阳活动异常与降水和地面气温的关系. 气象科技, 34(4): 381-386. DOI:10.3969/j.issn.1671-6345.2006.04.006 |
顾震年. 1991. 太阳活动对地表气候和地球自转的影响. 天文学进展, 9(1): 51-59. |
贾鹏群, 石广玉. 2001. 近50年火山喷发和太阳活动对我国气候影响的研究. 高原气象, 20(3): 225-233. DOI:10.3321/j.issn:1000-0534.2001.03.001 |
蒋样明, 彭光雄, 邵小东. 2011. 自然驱动是全球气候变化的重要因素. 气象与环境科学, 34(2): 7-13. DOI:10.3969/j.issn.1673-7148.2011.02.002 |
金祖辉, 陶诗言. 1999. ENSO循环与中国东部地区夏季和冬季降水关系的研究. 大气科学, 23(6): 663-672. DOI:10.3878/j.issn.1006-9895.1999.06.03 |
李海燕, 张文君, 何金海. 2016. ENSO及其组合模态对中国东部各季节降水的影响. 气象学报, 74(3): 322-334. |
刘广深, 米家榕, 戚长谋, 等. 1996. 东北地区降水周期与太阳活动的关系. 长春地质学院学报, 26(4): 422-427. |
潘静, 李崇银, 顾薇. 2010. 太阳活动对中国东部夏季降水异常的可能影响. 气象科学, 30(5): 574-581. DOI:10.3969/j.issn.1009-0827.2010.05.002 |
强学民, 杨修群. 2013. 华南前汛期降水异常与太平洋海表温度异常的关系. 地球物理学报, 56(8): 2583-2593. DOI:10.6038/cjg20130808 |
曲维政, 邓声贵, 黄菲, 等. 2004. 深海温度变化对太阳活动的响应. 第四纪研究, 24(3): 285-292. DOI:10.3321/j.issn:1001-7410.2004.03.007 |
宋燕, 李智才, 肖子牛, 等. 2016a. 太阳活动与高原积雪及东亚环流的年代际相关分析. 高原气象, 35(5): 1135-1147. |
宋燕, 李智才, 张菁, 等. 2016b. 太阳活动对高原积雪和东亚夏季风调制影响的回顾和进展. 气象科技进展, 6(3): 148-154. |
汤懋苍, 柳艳香, 郭维栋. 2001. 天时、气候与中国历史(I): 太阳黑子周长与中国气候. 高原气象, 20(4): 368-373. DOI:10.3321/j.issn:1000-0534.2001.04.004 |
王澄海, 王式功, 杨德保, 等. 2002. 中国西北春季降水与太平洋海温相关特征的研究. 热带气象学报, 18(4): 374-382. DOI:10.3969/j.issn.1004-4965.2002.04.011 |
魏凤英. 2007. 现代气候统计诊断与预测技术. 2版. 北京: 气象出版社.
|
吴洪宝, 段安民. 1998. 全球热带SSTA与中国7月降水和气温的伴随相关型分析. 南京气象学院学报, 21(3): 123-128. |
伍红雨, 吴遥. 2018. 不同类型和强度的厄尔尼诺事件对次年华南前汛期降水的可能影响. 大气科学, 42(5): 1081-1095. |
吴统文, 郑光, 瞿章. 1989a. 推荐一种周期及其演变趋势与太阳黑子相对数一致的物理量-10.7 cm(2800 MHz)太阳射电通量. 地球科学进展, 4(4): 54. |
吴统文, 郑光, 瞿章. 1989b. 用太阳射电通量代替太阳黑子相对数的探讨. 气象, 15(5): 51-53. |
徐群. 2010. 全球气温趋势和近期中国气候灾害的成因分析和展望. 气象科学, 30(5): 582-590. DOI:10.3969/j.issn.1009-0827.2010.05.003 |
杨保, 施雅风, 周清波. 2002. 近300a来古里雅与长江下游温度变化所受太阳活动、火山活动的影响分析. 冰川冻土, 24(1): 40-45. DOI:10.3969/j.issn.1000-0240.2002.01.006 |
张亮, 王赤, 傅绥燕. 2011. 太阳活动与全球气候变化. 空间科学学报, 31(5): 549-566. |
赵娟, 李志安, 韩廷本. 1999. 太阳活动、El Niño对北京地区降雨的影响及预测. 地球物理学进展, 14(1): 123-126. |
赵强, 严华生. 2014. 太平洋-印度洋海温异常对陕西夏季降水年际变化的影响. 高原气象, 33(6): 1608-1617. |
赵永晶, 钱永甫. 2009. 全球海温异常对中国降水异常的影响. 热带气象学报, 25(5): 561-570. DOI:10.3969/j.issn.1004-4965.2009.05.006 |
竺可桢. 1973. 中国近五千年来气候变迁的初步研究. 中国科学, 16(2): 2-11. |