2. 美国地质调查局地震科学中心(USGS-ESC), 莫菲特菲尔德 94035;
3. 中国科学院地质与地球物理研究所, 北京 100029
2. U. S. Geological Survey Earthquake Science Center(USGS-ESC), Moffett Field, California 94035, USA;
3. Institute of Geology and Geophysics, Chinese Academy of Sciences, Beijing 100029, China
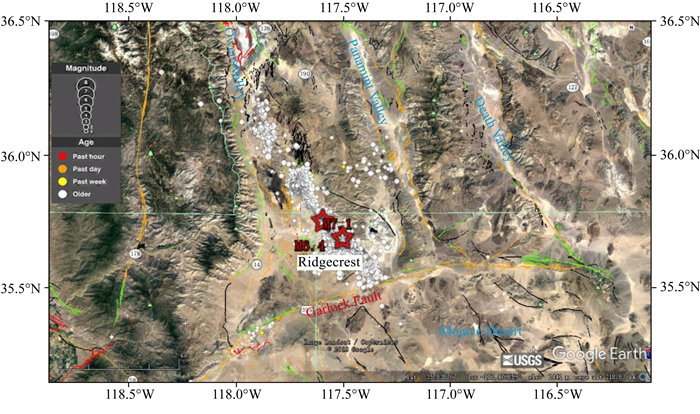
2019年7月4日17时33分(UTC时间),美国南加州城市Ridgecrest东北方向约10 km的沙漠中发生了MW6.4地震(图 1)(震中坐标35.705°N,117.504°W,震源深度10.5 km).在这次地震发生约34小时后,即2019年7月6日3时19分(UTC时间),又发生了一次MW7.1地震(图 1)(震中坐标35.770°N,117.599°W,震源深度8 km)(Brandenberg et al., 2019;https://www.usgs.gov/natural-hazards/earthquake-hazards/faults-and-earthquake-geology). Ridgecrest地震能量大且波及范围广,洛杉矶和拉斯维加斯都有明显震感.所幸震中区域人烟稀少,仅有1人因地震丧生.尽管未造成较大规模人员伤亡,但由于沙漠中有大量的工业企业和军事实验基地,造成了巨额财产损失,仅海军基地报道的损失就达到了约50亿美元(https://apnews.com/578bff4f32144c52bcbb62fdf8e020af).
|
图 1 Ridgecrest地震序列震中分布图(底图取自Google Earth,数据来自USGS,统计日期自7月1日至8月19日) 星形表示MW6.4和MW7.1震中位置,白色圆圈表示余震事件. Fig. 1 Epicentral distribution of the Ridgecrest earthquake sequence (Bottom image taken from Google Earth, data from USGS, statistical date from July 1 to August 19) Stars show the epicenter of the MW6.4 and MW7.1, and the white circles show the aftershock events. |
这种“双震”现象较为罕见,更为特殊的是,这一地区已有大量研究成果,震中周围许多其他断层已经被调查清楚,但本次地震并未发生在已知断裂上,在震后形成了两条接近正交的新破裂带.此外本次地震还产生了大量的余震,截至7月23日,余震次数已经超过了80000次(Brandenberg et al., 2019),并且仍在持续发生.
1 构造背景本次地震所处的南加州横跨太平洋-北美板块边界,位于圣安德列斯断层的大拐弯处,有超过300个断层可以产生6级地震,这一系列复杂的断层影响着洛杉矶和圣地亚哥市区的2000多万居民(Stein et al., 1992;Olsen et al., 1995;Bielak et al., 2010).本次地震震中位于圣安德烈斯断裂以东加利福尼亚州东部剪切带(Eastern California Shear Zone,ECSZ)内,是一个以走滑断层为主的区域,容纳了太平洋-北美板块近四分之一的滑动量(Frankel et al., 2008).这一区域内地震十分活跃,历史上发生过多次大于7级的地震,包括1872年的Owens谷7.6级地震(Hough and Hutton, 2008;Haddon et al., 2016),1992年的Landers 7.1级地震(Wald and Heaton, 1994;Olsen et al., 1997),1999年的Hector Mine 7.1级地震(Jónsson et al., 2002;Felzer et al., 2002;Hauksson et al., 2002).
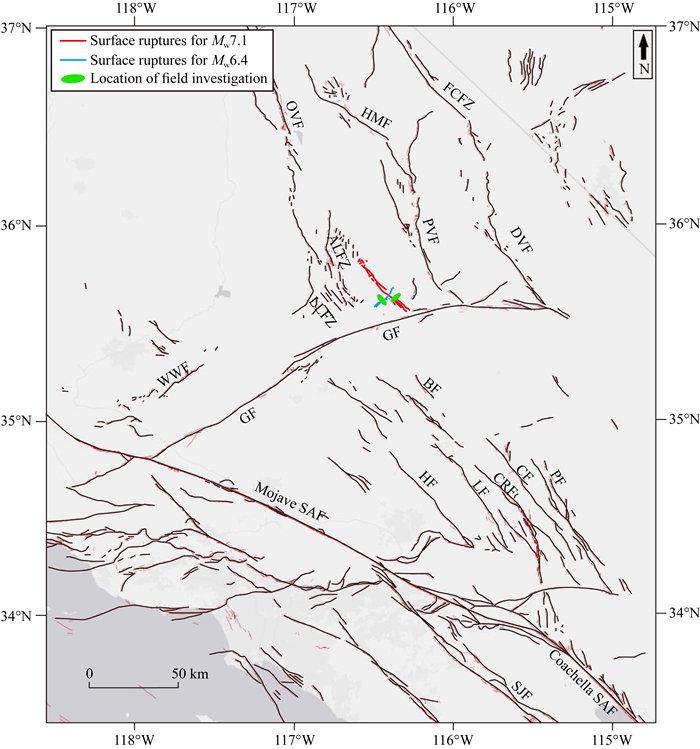
Garlock断层是距离震中最近的大断裂,它是一条长265 km的左旋走滑断层,从南加州的圣安德烈斯断裂向东北方向延伸.该断裂也是一条重要的地貌边界,将北部的Nevada山脉与南部的Mojave沙漠地块分隔开(Davis and Burchfiel, 1973).加利福尼亚州东部剪切带(Savage et al., 2001;Thatcher et al., 2016) 在Garlock断层以北主要由三组张扭性断裂组成,自东向西依次是Death Valley-Furnace Creek- Fish Lake Valley断裂带,Panamint Valley-Hunter Mountain-Saline Valley断裂带,Owens Valley-Airport Lake断裂带.这三组断裂带均有明显的右旋走滑性质(见图 2).
|
图 2 震中附近断层及震后破裂分布图(修改自Dixon and Xie, 2018) 断层名: ALFZ—Airport Lake fault zone; BF—Blackwater fault; CF—Calico fault; CRF—Camp Rock fault; Coachella SAF—Coachella section of the San Andreas fault; DVF—Death Valley fault; FCFZ—Furnace Creek fault zone; GF—Garlock fault; HF—Helendale fault; HMF—Hunter Mountain fault; LF—Lenwood fault; LLFZ—Little Lake fault zone; Mojave SAF—Mojave section of the San Andreas fault; WWF—White Wolf fault; OVF—Owens Valley fault; PVF—Panamint Valley fault; PF—Pisgah fault; SJF— San Jacinto fault. Fig. 2 Distribution of faults near epicenter and ruptures after earthquake (modified from Dixon and Xie, 2018) |
加利福尼亚州东部剪切带在Garlock断层以南主要由Mojave沙漠中的剪切带组成.Mojave沙漠是南加州一个主要的地质单元,Ridgecrest地震震中位于Mojave沙漠北部.Mojave沙漠中南部的剪切带主要由多条南北向接近平行的右旋走滑断层组成,它们都在以一定的速率滑动,其中滑动速率最大的是位于剪切带中心的Calico断层(Dixon and Xie, 2018). 在加州东部剪切带和Garlock断层的共同作用下,本次地震震后产生了两组近正交分布的交叉地震破裂带.
2 地表破裂野外调查由于震中位于军事基地内,7月7日进行的野外调查仅限于开放公路沿线附近的地表破裂处,主要考察震后形成的两条新断裂特征及其产生的地表破裂和位移,用以确定断裂性质.
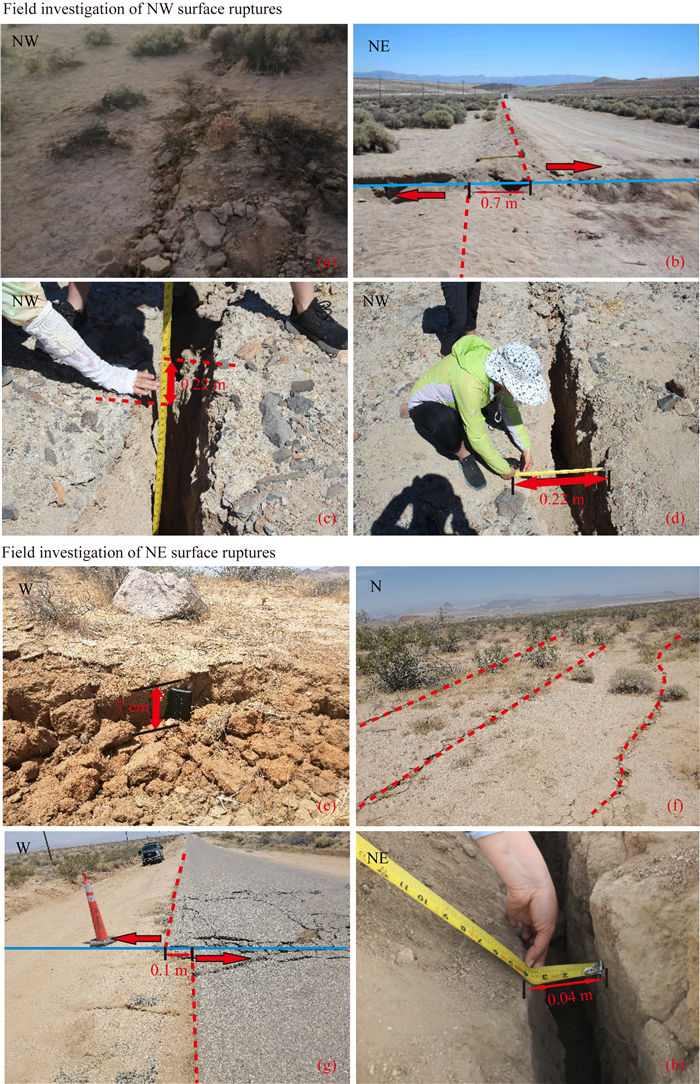
NW方向的破裂带在MW7.1地震发生后形成,大量余震也是沿NW方向分布,是本次地震序列产生的主破裂带.NW方向地表破裂调查点位于断裂与178高速公路的交叉点附近,坐标(35.6520°,-117.4667°).根据沙漠公路错动的指示(图 3b),该破裂属于右旋走滑型,破裂长度约为50 km(Brandenberg et al., 2019).在该点附近能勘测到的裂缝最深处0.47 m(图 3c),最大宽度为0.22 m(图 3d),最大走滑位错距离约0.7 m,断层走向约为332°,倾角约90°,滑动角约-180°.
|
图 3 震后地表破裂的野外调查 (a) NW走向地表破裂;(b) NW走向地表破裂对公路的破坏及其右旋走滑特征;(c) NW走向地表破裂深度测量;(d) NW走向地表破裂宽度测量;(e) NE走向地表破裂;(f) NE走向三条平行裂缝;(g) NE走向地表破裂对公路的破坏及其左旋走滑特征;(h) NE走向地表破裂宽度测量. Fig. 3 Field investigation of surface ruptures after earthquakes (a) NW trending surface ruptures; (b) The damage of NW trending surface ruptures to highway and its right lateral strike slip characteristics; (c) Measurement of surface ruptures depth in NW strike; (d) Measurement of NW trending surface rupture width; (e) NE trending surface ruptures; (f) Three parallel fractures in NE direction; (g) The damage of NE trending surface ruptures to highway and its left lateral strike slip characteristics; (h) Measurement of NE trending surface rupture width. |
NE方向地表破裂调查点位于断裂和Randsburg Wash公路的交叉点,坐标(35.6182°,-117.5730°).NE方向破裂带的规模小于NW方向的破裂带,形成于MW6.4地震发生之后,具有明显的左旋走滑特征(图 3g), 破裂长度约为10 km(Brandenberg et al., 2019).观测点附近裂缝的最大宽度为0.04 m(图 3h),最大走滑位错距离约0.1 m(图 3g),断层走向约为226°,倾角约90°,滑动角约-180°,部分区域地表出现多条平行裂缝(图 3f).
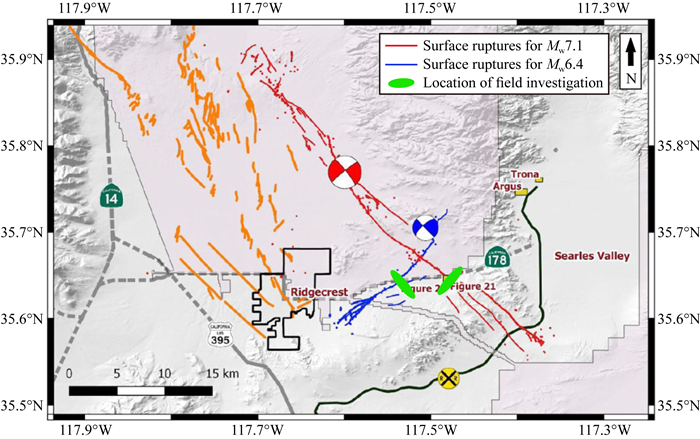
地表破裂调查的结果表明,NW方向的主断裂和NE方向的次级断裂均为走滑断层,这与区域构造活动背景具有一致性.图 4是GEER(Geotechnical Extreme Event Reconnaissance) 团队利用地表调查结合卫星图像,无人机等技术绘制的震后地表破裂分布图,地表破裂累积长度超过60 km(Brandenberg et al., 2019).
|
图 4 基于地表调查,卫星图像,无人机等技术绘制震后地表破裂分布图(修改自Brandenberg et al., 2019) Fig. 4 Distribution map of surface ruptures after earthquake based on surface survey, satellite image and unmanned aerial vehicle (UAV) aerial photograph (modified from Brandenberg et al., 2019) |
Ridgecrest地震序列的MW6.4地震先于MW7.1地震发生,一前一后仅相差34小时.为了探究这两次地震的关系,我们对USGS公开的该地区>2.5级的地震数据进行了统计分析.主要包括对地震序列震源位置,每日地震次数的统计,每日最大震级的统计和震源深度的统计.统计边界北至北纬36.465°,南至北纬34.488°,东至西经116.344°,西至西经118.663°,统计时间自2019年7月1日至8月19日,共计50天.根据对每日地震次数的统计发现,7月6日的单日地震次数远远高于其他日期,达到了781次(图 5a),是地震活动最剧烈的一天,MW7.1地震也是发生在7月6日.7月6日前两天的单日地震次数超过了一百次,7月6日后的两天单日地震次数也超过了一百次,这五日是地震最为集中的时间.7月8日后发生的余震次数逐渐减少.每日最大震级曲线和每日地震次数的对数曲线具有类似的变化关系(图 5b).通过对震源深度的统计发现,绝大多数余震发生在10 km以浅的位置(图 5c).
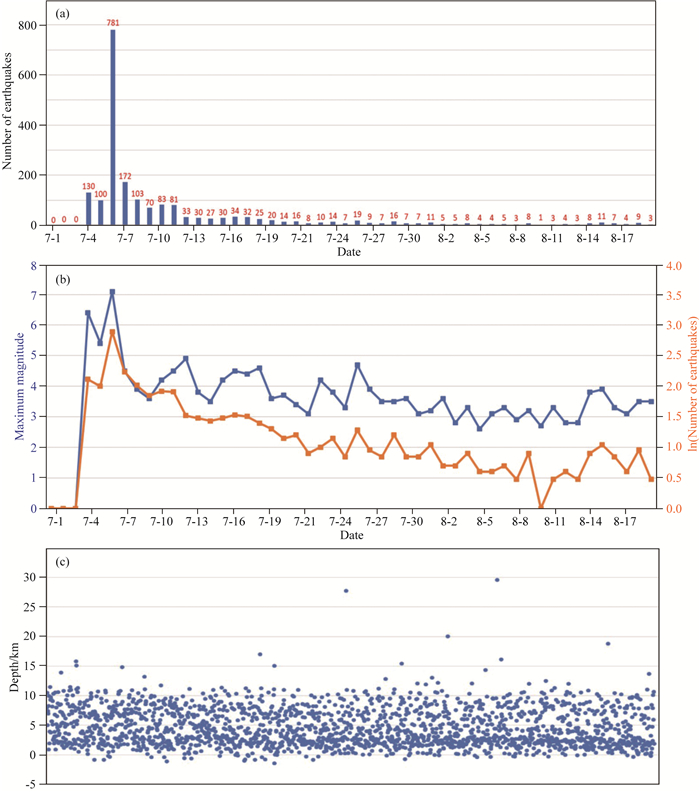
|
图 5 Ridgecrest地震序列7月1日至8月19日50天数据统计图 (a) 每日地震发生次数柱状图;(b) 每日最大震级曲线(蓝色)和每日地震次数对数曲线(橘色);(c) 震源深度分布散点图. Fig. 5 Ridgecrest earthquake sequence 50 days of data from July 1 to August 19 (a) Histogram of daily earthquake occurrences; (b) Daily maximum magnitude curve (blue) and logarithm of number of daily earthquakes curve (orange); (c) Scatter plot of source depth distribution. |
为了进一步研究应力释放过程,我们统计了Ridgecrest地震序列在7月3日至7月8日每天大于MW2.5地震的震源位置分布(图 6).根据统计的震源分布图,7月3日这一区域内没有发生地震(图 6a);7月4日发生了MW6.4地震,余震比较集中,整体分布在近NE方向上(图 6b);7月5日要比7月4日平静一些,无论是地震的数量还是震级都低于7月4日,分析其整体活动在减弱,MW6.4地震发生之后,除了在NE方向上产生了一系列地震,也在NW方向上产生了一些地震,两个方向近垂直分布,呈“L”型分布(图 6c),据此推测MW6.4地震发生后可能对NW方向断裂的稳定性产生了影响;7月6日的地震活动变强,发生了MW7.1的大震,且产生的地震次数远远多于7月4日和7月5日,震源位置具有非常明显的NW方向的线性分布特征,少数沿NE方向分布,整体分布呈“T”形(图 5d);7月7日(图 5e)和7月8日(图 5f)具有和7月6日相同的NW方向的震源分布,但地震次数有明显减少的趋势.通过上述发震时序关系和连续几日的震源位置分布,推测MW6.4地震发生后造成的动态应力变化加速了MW7.1的破坏过程.震后形成了两条接近正交分布的共轭破裂,NW方向的地震数量和密度具有明显的分布优势,说明本次地震序列的主要应力集中在NW方向.

|
图 6 Ridgecrest地震序列在7月3日至7月8日每日震源位置分布图 Fig. 6 Distribution of daily source locations of the Ridgecrest earthquake sequence from July 3 to July 8 |
这样的地震分布也与区域构造背景相吻合,与板块边界方向接近的NW方向右旋走滑断裂会更快地累积剪切应力,更容易失稳发生破裂,而NE方向左旋走滑断裂可能与Garlock断层的缓慢蠕变有关.
从破裂过程上看,我国2014年8月3日发生的鲁甸地震的活动性也有类似的小震活动和破裂特征.鲁甸地震发生时先在NE方向上破裂,而后在NW方向上破裂,与本次地震的差异是鲁甸地震之前没有记录到比较大的地震,但破裂过程分析指出了类似的破裂特征,余震序列主要呈“L”型优势分布(王未来等,2014;张勇等,2014;Cai et al., 2017).张勇等(2015)通过近震和远震数据的联合反演,得到了鲁甸地震的破裂过程,认为鲁甸地震是NW主压应力与NE主张应力的同一应力场下发生的两条共轭断层先后破裂的一次复杂地震事件.Ridgecrest地震和鲁甸地震都发生在断裂交汇地带,均属于走滑型地震,同时受两个断裂走向的控制,余震序列都呈现出接近垂直的两个不同优势方向分布.在断层交汇区域,一个断层的破裂会影响其他断层上的应力,也意味着无论哪一个断层先破裂,都可能控制整个地震事件或序列.
从地震序列上来看,Ridgecrest地震在主震发生约两天之前有一次强烈前震,这与2010年发生在我国青海玉树的地震又有相似之处.玉树地震也属于走滑型地震,在MW7.1主震发生前约两个小时也发生了一次MW4.7的强烈前震(倪四道等,2010;马寅生等,2010;石学录等,2017).玉树地震在震后主要形成了两条接近平行的地表破裂带——玉树地表破裂带和隆宝滩地表破裂带,均呈NW向延伸,二者之间相距22 km.余震偏离玉树—甘孜断裂分布,在SW向也有分布,推测可能与南西向次级断裂有关(王长在等,2013).这种走滑型地震的强烈前震现象是否能够成为大地震预报前兆值得进一步研究.
4 结论RidgecrestMW6.4-MW7.1地震震后在地表形成了MW7.1地震产生的NW走向破裂带,长度约50 km和MW6.4地震产生的NE走向破裂带,长度约10 km,两条破裂带近正交分布.根据现场调查,NW方向破裂带具有右旋走滑特征,NE方向破裂带具有左旋走滑特征,构成了一组共轭破裂.通过统计分析地震序列震源分布,每日地震次数,每日最大震级数据,推断MW6.4地震为一次强烈前震,诱发了更强的MW7.1主震.本次地震序列的震源深度集中分布在10 km以浅.
Ridgecrest地震NW走向破裂主要受到加利福尼亚东部剪切带的影响,NE方向主要受到Garlock断裂的影响,在二者的共同作用下产生了本次共轭地震序列.Ridgecrest地震与2014年鲁甸地震在破裂过程上具有相似之处,都属于走滑型地震,二者也同处于构造交汇地区,都在震后形成了近正交分布的破裂带.Ridgecrest地震与2010年玉树地震在主震发生之前均有一次较强的前震,强烈前震现象是否能够成为大地震预报前兆值得进一步研究.
致谢 感谢美国地质调查局地震科学中心Rufus Catchings博士领导的团队提供的野外调查机会和对本文研究写作的支持.感谢中国地震台网中心张莹莹、安艳茹和防灾科技学院耿更共同参与地质调查工作.感谢审稿专家提出的宝贵修改意见.
Bielak J, Graves R W, Olsen K B, et al. 2010. The ShakeOut earthquake scenario: Verification of three simulation sets. Geophysical Journal International, 180(1): 375-404. DOI:10.1111/j.1365-246X.2009.04417.x |
Brandenberg S J, Wang P F, Nweke C C, et al. 2019. Preliminary report on engineering and geological effects of the July 2019 Ridgecrest earthquake sequence. Geotechnical Extreme Event Reconnaissance Association. DOI:10.18118/G6H66K |
Cai J T, Chen X B, Xu X W, et al. 2017. Rupture mechanism and seismotectonics of the MS6.5 Ludian earthquake inferred from three-dimensional magnetotelluric imagin. Geophysical Research Letters, 44(3): 1275-1285. DOI:10.1002/2016GL071855 |
Davis G A, Burchfiel B C. 1973. Garlock Fault: An intracontinental transform structure, Southern California. Geological Society of America Bulletin, 84(4): 1407-1422. DOI:10.1130/0016-7606(1973)84<1407:GFAITS>2.0.CO;2 |
Dixon T H, Xie S R. 2018. A kinematic model for the evolution of the Eastern California Shear Zone and Garlock Fault, Mojave Desert, California. Earth and Planetary Science Letters, 494: 60-68. DOI:10.1016/j.epsl.2018.04.050 |
Felzer K R, Becker T W, Abercrombie R E, et al. 2002. Triggering of the 1999 MW7.1 Hector Mine earthquake by aftershocks of the 1992 MW7.3 Landers earthquake. Journal of Geophysical Research: Solid Earth, 107(B9): ESE 6-1-ESE 6-13. DOI:10.1029/2001JB000911 |
Haddon E K, Amos C B, Zielke O, et al. 2016. Surface slip during large Owens valley earthquakes. Geochemistry, Geophysics, Geosystems, 17(6): 2239-2269. DOI:10.1002/2015GC006033 |
Hauksson E, Jones L M, Hutton K. 2002. The 1999 MW7.1 Hector Mine, California, earthquake sequence: complex conjugate strike-slip faulting. Bulletin of the Seismological Society of America, 92(4): 1154-1170. DOI:10.1785/0120000920 |
Hough S E, Hutton K. 2008. Revisiting the 1872 Owens Valley, California, earthquake. Bulletin of the Seismological Society of America, 98(2): 931-949. DOI:10.1785/0120070186 |
Jónsson S, Zebker H A, Segall P, et al. 2002. Fault slip distribution of the 1999 MW7.1 Hector mine, California, earthquake, estimated from satellite radar and GPS measurements. Bulletin of the Seismological Society of America, 92(4): 1377-1389. DOI:10.1785/0120000922 |
Ma Y S, Zhang Y S, Hu D G, et al. 2010. The surface ruptures and the macroscopical epicenter of Yushu MS7.1 earthquake. Journal of Geomechanics (in Chinese), 16(2): 115-128. |
Ni S D, Wang W T, Li L. 2010. The April 14th, 2010 Yushu earthquake, a devastating earthquake with foreshocks. Science China Earth Sciences, 53(6): 791-793. DOI:10.1007/s11430-010-0083-2 |
Olsen K B, Archuleta R J, Matarese J R. 1995. Three-dimensional simulation of a magnitude 7.75 earthquake on the San Andreas fault. Science, 270(5242): 1628-1632. DOI:10.1126/science.270.5242.1628 |
Olsen K B, Madariaga R, Archuleta R J. 1997. Three-dimensional dynamic simulation of the 1992 Landers earthquake. Science, 278(5339): 834-838. DOI:10.1126/science.278.5339.834 |
Savage J C, Gan W J, Svarc J L. 2001. Strain accumulation and rotation in the Eastern California Shear Zone. Journal of Geophysical Research: Solid Earth, 106(B10): 21995-22007. DOI:10.1029/2000JB000127 |
Shi X L, Yao J J, Zhang B. 2017. Focal mechanism solution analysis of ML ≥ 4.0 earthquakes in the 2010 Yushu earthquake sequence. China Earthquake Engineering Journal (in Chinese), 39(1): 112-118. DOI:10.3969/j.issn.1000-0844.2017.01.0112 |
Stein R S, King G C P, Lin J. 1992. Change in failure stress on the southern San Andreas Fault system caused by the 1992 magnitude=7.4 landers earthquake. Science, 258(5086): 1328-1332. DOI:10.1126/science.258.5086.1328 |
Thatcher W, Savage J C, Simpson R W. 2016. The eastern California shear zone as the northward extension of the southern San Andreas fault. Journal of Geophysical Research: Solid Earth, 121(4): 2904-2914. DOI:10.1002/2015JB012678 |
Wald D J, Heaton T H. 1994. Spatial and temporal distribution of slip for the 1992 Landers, California, earthquake. Bulletin of the Seismological Society of America, 84(3): 668-691. |
Wang C Z, Wu J P, Fang L H, et al. 2013. The relationship between wave velocity structure around Yushu earthquake source region andthe distribution of aftershocks. Chinese Journal of Geophysics (in Chinese), 56(12): 4072-4083. DOI:10.6038/cjg20131212 |
Wang W L, Wu J P, Fang L H, et al. 2014. Double difference location of the Ludian MS6.5 earthquake sequences in Yunnan province in 2014. Chinese Journal of Geophysics (in Chinese), 57(9): 3042-3051. DOI:10.6038/cjg20140929 |
Zhang Y, Xu L S, Chen Y T, et al. 2014. Rupture process of the 3 August 2014 Ludian, Yunnan, MW6.1 (MS6.5) earthquake. Chinese Journal of Geophysics (in Chinese), 57(9): 3052-3059. DOI:10.6038/cjg20140930 |
Zhang Y, Chen Y T, Xu L S, et al. 2015. The 2014 MW6.1 Ludian, Yunnan, earthquake: A complex conjugated ruptured earthquake. Chinese Journal of Geophysics (in Chinese), 58(1): 153-162. DOI:10.6038/cjg20150113 |
马寅生, 张永双, 胡道功, 等. 2010. 玉树地震地表破裂与宏观震中. 地质力学学报, 16(2): 115-128. DOI:10.3969/j.issn.1006-6616.2010.02.002 |
倪四道, 王伟涛, 李丽. 2010. 2010年4月14日玉树地震: 一个有前震的破坏性地震. 中国科学: 地球科学, 40(5): 535-537. |
石学录, 姚家骏, 张博. 2017. 2010年玉树地震序列ML ≥ 4.0事件震源机制解特征分析. 地震工程学报, 39(1): 112-118. DOI:10.3969/j.issn.1000-0844.2017.01.0112 |
王长在, 吴建平, 房立华, 等. 2013. 玉树地震震源区速度结构与余震分布的关系. 地球物理学报, 56(12): 4072-4083. DOI:10.6038/cjg20131212 |
王未来, 吴建平, 房立华, 等. 2014. 2014年云南鲁甸MS6.5地震序列的双差定位. 地球物理学报, 57(9): 3042-3051. DOI:10.6038/cjg20140929 |
张勇, 许力生, 陈运泰, 等. 2014. 2014年8月3日云南鲁甸MW6.1(MS6.5)地震破裂过程. 地球物理学报, 57(9): 3052-305. DOI:10.6038/cjg20140930 |
张勇, 陈运泰, 许力生, 等. 2015. 2014年云南鲁甸MW6.1地震: 一次共轭破裂地震. 地球物理学报, 58(1): 153-162. DOI:10.6038/cjg20150113 |
 2021, Vol. 64


