 2021, Vol. 64


2. 中国科学院大学, 北京 100049;
3. 漠河地球物理国家野外科学观测研究站, 北京 100029;
4. 美国地质调查局, CA 94025
2. University of Chinese Academy of Sciences, Beijing 100049, China;
3. Mohe National Observatory of Geophysics, Institute of Geology and Geophysics, Chinese Academy of Sciences, Beijing 100029, China;
4. United States Geological Survey, CA 94025, USA
地震各向异性提供了有关地幔形变方向和强度的基本信息(如,Silver and Chan, 1991; Savage, 1999).各向异性介质中地震波的传播速度取决于其传播方向和极化方向.通常认为上地幔中各向异性矿物的晶格优势取向(Lattice Preferred Orientation,LPO)是地震各向异性的成因机制(如,McKenzie, 1979; Montagner and Tanimoto, 1990; Zhang and Karato, 1995; Karato et al., 2008).由于应变与地震各向异性的密切关系,各向异性可以揭示地幔的形变特征,并有助于区分历史构造运动引起的各向异性与现今地幔流动造成的各向异性(Silver and Chan, 1991).在俯冲地区,前人进行了大量各向异性研究,在弧前和俯冲板片下方区域均观测到了与俯冲方向平行或垂直的各向异性快波方向(如,Long and Silver, 2008; Lynner and Long, 2014, 2015).各向异性快波方向与不同地幔条件下(包括应力状态、温压条件和含水量等)橄榄石矿物的不同形变模式相关(如,Jung and Karato, 2001; Jung et al., 2009).同时,地幔楔中的绕流和俯冲板片边缘的3D回流等均能够造成各向异性快波方向的差异(Long and Silver, 2008).
在中国东北地区,俯冲的西北太平洋板片停滞在地幔过渡带上形成了“大地幔楔”构造(Maruyama et al., 2009; Zhao et al., 2009).为揭示具有特殊大地幔楔结构的地幔流动特征,在我国东北区域开展了大量基于固定和流动台站数据的各向异性研究,提出了不同的各向异性模式特征(如,郑斯华和高原, 1994; Sandvol and Ni, 1997; Iidaka and Niu, 2001; 罗艳等, 2004; Liu et al., 2008; Li and Niu, 2010; 强正阳和吴庆举, 2015; Chen et al., 2017; Li et al., 2017).尤其是针对有大量高质量观测数据的MDJ台站,研究结果颇多,但结果的差异性也较大.Huang等(2011)观测得到大量的NULL值结果,认为MDJ台站下方存在很弱的各向异性;但同时得到的非NULL结果中却也存在最大慢波延迟时间1.3 s的结果.利用XKS(SKKS、SKS)震相和单层各向异性假设得到的MDJ台站下方介质的快波方向可以在64°~160°之间变化,慢波延迟时间则在0.5~2 s之间变化.使得我们无法较为准确地认识地幔流动、俯冲板片的俯冲行为和复杂俯冲系统内的地幔形变等相关问题.
MDJ台站(44.617°N,129.591°E)位于日本俯冲带海沟以西约1300 km处,是全球地震台网(Global Seismic Network,GSN)布设在东北地区运行时间较长的台站,且数据全球共享.MDJ台站地理位置特殊,位于郯庐断裂带的两支——依兰—伊通断裂和敦化—密山断裂之间;且在西北太平洋板片在地幔过渡带中停滞形成“大地幔楔”的折曲位置略西处.MDJ台站近旁有板片俯冲作用产生的深源地震事件,为采用多种震相联合研究台站下方各向异性结构提供了数据支持.前人的研究表明,高质量长期运行的地震台站数据可以更加有效、详细地确定台站下方的地震各向异性,特别是其在深度上的分布特征,在复杂的俯冲系统中尤为有效(Fouch and Fischer, 1998; Marson-Pidgeon and Savage, 1997, 2004; Eakin and Long, 2013).本研究中,我们针对MDJ台站这一具有长期观测数据的台站开展了详细的剪切波分裂各向异性研究,试图探究各向异性结果存在较大离散性的原因及其背后的地球动力学成因和机制.
1 数据和方法我们从IRIS DMC(Incorporated Research Institutions for Seismology Data Management Center)收集并处理了MDJ台站1996—2019年的远震SKS和区域/近场深源地震的直达S震相(简称S震相)波形,采用SplitLab(Version 1.0.4, Wüstefeld et al., 2008)进行各向异性剪切波分裂研究.
1.1 数据和剪切波分裂分析对于SKS数据,我们选取了震中距85°~150°,震级MW大于5.5级的远震事件,滤波范围0.05~ 0.5 Hz;对于区域深源地震事件,震中距选取为0°~10°,震级大于4.5级,震源深度大于300 km.由于S震相射线路径较短,高频成分丰富,滤波频段选取为0.05~1 Hz(图 1).首先根据拟研究震相的信噪比(SNR>3)对数据自动筛选,然后手动挑选出高质量的波形数据.对S震相的筛选同时要求射线出射角度小于35°,S和sPn波的到时差大于10 s,以排除其他震相的干扰(Liu et al., 2008).

|
图 1 地震事件分布以及MDJ台站下方的SKS和直达S震相射线 (a)图给出了SKS事件和区域深源地震事件的位置分布,不同颜色表示不同的深度.红色五角星代表之后用到的SIMW方法对应的事件位置; (b) MDJ台站位置及台站下方的SKS和区域深源事件直达S波的射线路径,图中还在地表投影给出了俯冲板片等深线、郯庐断裂带和两种震相在410界面的穿透点位置.俯冲板片等深线135°E以东数据来自Slab 1.0(Hayes et al., 2012),135°E以西来自GAP_P4模型(取δVp>4%)(Fukao and Obayashi, 2013).图(b)中的插图给出了MDJ台站周围的断层结构,以及SKS和直达S射线的410穿透点位置,该地区分布有北东向的依兰—伊通断裂和敦化—密山断裂,西南方有镜泊湖火山、龙岗火山和长白山火山.其中带有蓝色五角星的红色短棒表示Lynner和Long(2015)通过事件2003-08-31得到的震源下方的各向异性结果φ=-70.9°,δt=0.7 s. APM表示西北太平洋俯冲板片的俯冲方向NW65°(-65°). Fig. 1 Event locations, SKS and local S seismic rays beneath station MDJ (a) The distribution map of epicenters of SKS and local S events, different colors indicate different focal depths. SIMW events in wide frequency case (0.05~0.5 Hz) are shown as red pentagrams. (b) The location of the MDJ station, SKS wave ray path and direct S wave ray path of regional deep source events below the station. Piercing points on the 410-km discontinuity are plotted as inset. The outline of the slab to the east of 135°E is from Slab 1.0 (Hayes et al., 2012), while data to the west of 135°E is from GAP_P4 model with δVp > 4% (Fukao and Obayashi, 2013). The small figure insert in (b) shows fault structures and piercing points at depth of 410 km around the station, with NE-striking Yilan-Yitong and Dunhua-Mishan faults, Jingpohu volcano, Longgang volcano and Changbaishan volcano in the southwest of MDJ station. The red line with a blue pentagram in the middle indicates the result of the anisotropy of φ=-70.9°, δt=0.7 s below the source (event 2003-08-31) given by Lynner and Long (2015). APM indicates the subduction direction of the western Pacific plate with value of NW65°(-65°). |
我们利用SplitLab软件分析剪切波分裂各向异性参数(Wüstefeld et al., 2008).SplitLab采用网格搜索的方式,通过三种方法来全局搜索各向异性参数(快波极化方向φ和慢波延迟时间δt):旋转互相关方法(rotation-correlation method,RC);最小能量法(minimum energy method,SC)和特征值方法(eigenvalue method,EV).对于XKS各向异性分析,SC方法具有较好的稳定性和准确性(Wüstefeld and Bokelmann, 2007),因此最终采用SC方法的结果(图 2a),并结合RC和EV方法的分析对结果质量进行判断.但对S震相,由于其未经过液态外核,射线自震源出发时,在切向上便具有一定的能量.因此,采用RC方法给出的结果作为最终结果,同时结合EV方法对结果质量给出判断.

|
图 2 单事件剪切波分裂结果和SIMW方法结果对比 (a)汤加地区单事件2016-02-01(Evla = 37.5°S, Evlo=179.95°W, Evdp=391 km, MW=6.3)剪切波分裂SC方法结果,对应的后方位角为138.47°、震中距为88.26°; (b) 18个地震事件SKS震相在2°后方位角范围内(137°<Baz<139°)的串联波形,包含(a)中事件波形在内; (c)串联波形SC方法结果. Fig. 2 Shear wave splitting (SWS) results of a single event and a concatenated waveform in SC (minimum energy) method (a) SWS result of the event 2016-02-01 (Evla=37.5°S, Evlo=179.95°W, Evdp=391 km, MW=6.3) in Tonga, with back-azimuth of 138.47° and epicentral distance of 88.26°; (b) The concatenated waveform with 18 different earthquakes within a 2-degree Baz range (137° < Baz < 139°), including the event shown in (a); (c) The SIMW result of the concatenated waveform. |
我们设定了如下标准判定“有效”的剪切波分裂结果(non-Null):(1)对于SKS震相,SC给出的结果与RC或EV方法的结果在误差范围内相近;对于S震相,RC和EV方法结果相近.(2)校正之前质点表现出明显的椭圆运动轨迹,校正之后表现出较好的线性.(3)校正之后旋转至快慢波方向并且归一化之后的快慢波具有较高的互相关系数(CorrSC),本研究中取阈值为0.85.(4)SKS震相校正后的信噪比较高,这里设定为大于4 (Restivo and Helffrich, 1999).(5)对于SKS震相,采用SC方法校正之后T分量能量明显减弱.(6) φ值误差范围小于25°,δt的误差范围小于1 s.
对NULL值结果的判断标准为:(1)对于SKS震相,若T分量各向异性校正之前能量便非常弱,质点运动表现为较好的线性;对于S震相,射线自震源出发时T分量便具有一定的能量,因此仅通过质点运动判断.(2)对于SKS震相,RC方法和SC方法得到的慢波延迟时间δt相差较大,并且Δφ=φSC-φRC≈n*45°,n为整数.
此外,我们将各向异性快波极化方向φ和后方位角方向近似平行或垂直(相差小于15°)的结果定义为“Node”(Li and Niu, 2010;Li et al., 2011),其对应的慢波延迟时间不够准确,在分析时不予考虑.
1.2 宽频带结果我们首先在前人研究常用的宽频带(SKS:0.05~0.5 Hz,S:0.05~1 Hz)范围下进行剪切波分裂分析,去掉无法得到较好有效剪切波分裂结果(non-NULL)或NULL值结果的数据,初步获得139个SKS震相、11个S震相结果.
对于SKS震相,初始极化方向与后方位角方向一致或相近,其差值均小于5°;对于S震相,其初始极化方向与事件的震源机制有关.我们根据Eakin和Long(2013)方法计算了理论S震相的初始极化方向,并与实际数据的初始极化方向进行比较,去除差值大于25°的结果.在得到的11个S震相结果中,仅有1个事件的实际初始极化方向和理论值相差约40°,其余均小于10°,另外存在2个事件的各向异性结果RC方法校正之后的快慢波的互相关系数较低(小于0.85),去除这3个事件对应的结果,在宽频段下共保留了8个S震相结果.
最终得到了53个有效SKS剪切波分裂结果,23个NULL和12个Nodal结果,以及8个质量较好的S波分裂结果,如图 3所示(详细结果见电子附件).将极化方向180°~360°范围内的数据结果转换到0°~180°范围内,从图 3所示宽频带结果可见,事件主要来自后方位角130°~170°之间,多对应汤加地区的地震事件.从参数结果分布图可见,各向异性参数具有明显的离散性,即来自相近后方位角的数据结果表现出明显差异;同时也存在随后方位角变化的特征.

|
图 3 宽频带各向异性结果随极化方向变化图 其中黑色小圆圈表示单事件的SKS震相结果;黑色菱形表示采用SIMW方法后得到的SKS剪切波分裂结果;五角星表示深源地震直达S波的各向异性结果;这些计算结果包含了53个单事件SKS震相的剪切波分裂结果、8个区域S波结果和25个通过SIMW方法得到的结果.虚线表示采用SIMW数据拟合得到的最佳单层各向异性模型(φ=-82°(或98°), δt=1.0 s);黑色线表示选取的拟合最佳的双层各向异性模型理论曲线,其各向异性参数为:主周期为8 s,下层φ=-68°, δt=2.2 s,上层φ=32°, δt=1.0 s;灰色线和浅灰色线分别表示进行误差分析时采样的31个第一类和第二类模型的理论曲线. Fig. 3 Shear wave splitting results for wide frequency analysis vary with polarization The small black circle represents the SKS phase result of a single event. The black diamond represents the SKS shear wave splitting result obtained after using the SIMW method. The pentagram represents the anisotropy result of direct S waves from deep earthquakes. These calculations include 53 single event SKS SWS results, 8 local S results and 25 SIMW results. Our preferred models are obtained from the results of SIMW. The dashed line shows the best one-layer model with the parameters: φ=-82° (or 98°), δt=1.0 s. The black line shows the best matching model with dominant period T=8 s, φ=-68°, δt=2.2 s in the lower layer, and φ=32°, δt=1.0 s in the upper layer. The gray (first class) and light gray (second class) lines show the ensemble of 31 acceptable models. |
为减弱数据离散性,得到更加准确、稳定的各向异性结果,我们采用了多波形同时反演的方法(Simultaneous Inversion of Multiple Waveforms,SIMW)(Roy et al., 2017).SIMW方法将一定后方位角范围内得到有效剪切波分裂结果对应的SKS震相波形进行串联拼接,组成新的波形,对新波形进行剪切波分裂计算,如图 2所示.这样能够在不减少数据后方位角覆盖范围的基础上,得到较精确稳定的各向异性结果,即一定后方位角范围内仅对应一个结果,既减少了结果的数量,又削弱了离散性,从而可以突显各向异性参数随后方位角的变化趋势.
2 各向异性结果分析 2.1 宽频带单事件结果及SIMW分析结果图 2给出了后方位角138°附近的SIMW分析结果,对宽频带结果进行窗口滑动,可以得到所有后方位角范围内的SIMW结果.部分后方位角范围内仅有一个结果,则将该值直接作为SIMW方法分析后的结果.得到的宽频带SIMW结果如图 3所示.
图 3给出了按初始极化方向排列的53个宽频带有效剪切波分裂结果、对应的25个SIMW方法分析结果和8个S震相结果.在初始极化方向135°~160°范围内,可明显观测到各向异性参数(φ、δt)随初始极化方向增加而增大.S震相结果对SKS震相后方位角覆盖较差的50°~80°起到了很好的补充作用.这种随初始极化方向变化的各向异性观测表明,台站下方具有较复杂的各向异性结构特征,通常的单层模型已不能解释记录时间较长、后方位角较为完备的各向异性观测.
2.2 剪切波分裂结果的频率依赖性在剪切波分析过程中,我们发现滤波频段对各向异性结果存在较明显的影响.结合前人开展的各向异性频率依赖性研究,选取了以下3个频段开展频率相关性研究:低频段(0.01~0.1 Hz)、中频段(0.1~0.2 Hz)和高频段(0.2~1 Hz)(Eakin and Long, 2013).
图 4展示了事件2014-02-02在四个不同频段下SC方法分析得到的各向异性结果.事件位于汤加地区(纬度-32.91°、经度-177.88°、震源深度44.3 km),对应的后方位角为138.2°,震中距为91.0°.波形在不同频段下均具有较高的信噪比;各向异性校正之后T分量能量均明显减弱.结合RC和EV方法判断低频段下的结果为NULL(图 4b).尽管宽、高、中三个频段均有高质量的有效剪切波分裂结果,但得到的结果在考虑不确定性后仍存在较明显的差异,表明各向异性结果具有一定的频率依赖性.

|
图 4 剪切波分裂结果的频率依赖性分析 相同事件(2014-02-02)数据在不同滤波频段下的各向异性SC方法结果.(a)、(b)、(c)、(d)分别对应宽频带(滤波频段0.05~0.5 Hz)、低频段(滤波频段0.01~0.1 Hz)、中频段(滤波频段0.1~0.2 Hz)和高频段(滤波频段0.2~1.0 Hz)结果. Fig. 4 Frequency dependence of shear wave splitting results The shear wave splitting result of the same event (2014-02-02), but in different frequency bands. Here we only show the results obtained by SC (minimum energy) method. (a) is the result in wide frequency band (0.05~0.5 Hz). (b) is the result in low frequency band (0.01~0.1 Hz). (c) is the result in medium frequency band (0.1~0.2 Hz). (d) is the result in high frequency band (0.2~1.0 Hz). |
对初步保留的139个宽频带SKS震相和11个S震相波形数据在三个分频段内均进行了剪切波分裂分析.在高频段得到了47个有效的剪切波分裂结果,中频段64个(图 5).低频段震相波形各向异性校正之前便具有较好的线性,得到的结果多为NULL.测量统计得到的低频段波形的主周期约为16.7 s,远大于2倍的各向异性慢波延迟时间,分裂到T分量的能量原本就弱(Gao and Liu, 2009),图 5中未做展示.中频段和高频段单事件的各向异性结果(图 5a、c)同样存在离散性,因此也进行了SIMW方法分析,得到了较精确的各向异性结果,如图 5b、d所示.图 6展示了不同频段下所有结果的分布情况(详细结果见电子附件),再次可以看出SIMW方法较好的减弱了结果的离散性,且不同频段结果存在明显的差异.

|
图 5 中频段和高频段深源地震直达S波震相和SKS单事件及SIMW各向异性结果 (a)、(c)分别对应单事件的快波极化方向和慢波延迟时间结果;(b)、(d)分别对应SIMW方法得到的快波极化方向和慢波延迟时间结果.黑色圆圈、菱形和五角星分别表示在高频段下单事件、SIMW方法和深源地震直达S波震相的各向异性结果.灰色表示中频段结果.黑色和灰色表示高频(取主周期4 s)和中频段(取主周期6.67 s)的双层各向异性理论曲线,下层各向异性参数φ=-68°, δt=2.2 s;上层各向异性参数φ=32°, δt=1.0 s. Fig. 5 Direct S-wave of deep-source event, SKS wave of single event andSIMW method anisotropy results in the middle and high frequency bands (a) and (c) show the fast direction and delay time of single SKS and local S events individually; (b) and (d) show the fast direction and delay time of SIMW SKS and local S events individually. Black circles, diamonds, and pentagrams represent the anisotropy results of single events, SIMW methods, and direct S-wave phases of deep earthquakes in high frequency band. Gray indicates mid-range results. The black and gray lines are the theoretical curves predicted from the two-layer model with dominant period 4 s and 6.67 s, with φ= -68°, δt=2.2 s in the lower layer, and φ=32°, δt=1.0 s in the upper layer, respectively. |

|
图 6 各向异性结果的位置分布 (a)、(b)、(c)、(d)分别对应宽频段、高频段、中频段和低频段SKS震相单事件结果及SIMW方法结果.实心圆表示得到有效剪切波分裂结果的事件位置.十字表示得到的结果为NULL值的事件位置.图中蓝色线条表示单事件结果,红色线条表示SIMW方法结果,线条方向表示快波极化方向,线段的长度表示慢波延迟时间的大小;中心处红色三角表示MDJ台站位置,黑线表示快波方向90°、慢波延迟时间1 s的结果,作为其他结果的参照. Fig. 6 Distribution of shear wave splitting results (a), (b), (c) and (d) show the results of SKS phase of single event and SIMW method for the wide-band, high-band, middle-band and low-band, respectively. The filled circle indicates the location of the event where the effective shear wave splitting result is obtained. The cross indicates the location of the event that results in a NULL value. The blue lines in the figure represent the results of a single event, and the red lines represent the results of the SIMW method. The line direction indicates the polarization direction of the fast wave, and the length indicates the value of the slow wave delay time. The red triangle at the center of each graph indicates the position of the MDJ station, and the black line indicates the shear wave splitting result of φ=90° and δt=1 s as a reference. |
在结果较多的后方位角130°~170°范围内,存在明显的各向异性参数随极化方向增大而增大的趋势,并且显示出一定的频率依赖性,具体表现为:高频段的快波极化方向相对于中频段发生了顺时针旋转;中频段的慢波延迟时间大于高频段.这进一步说明台站下方存在复杂的各向异性结构.
2.3 双层各向异性模型拟合单事件和SIMW方法得到的各向异性参数均具有随后方位角变化的特征,并表现出明显的频率依赖性.由于双层各向异性模型的各向异性参数具有随后方位角变化的特征和频率依赖性,考虑到研究区域的俯冲构造背景,研究中采用双层各向异性假设,对多个频段的剪切波分裂参数进行了模拟.
我们采用Rümpker和Silver(1998)方法计算双层各向异性模型的理论各向异性参数曲线.由于其与各层各向异性参数和信号的主频率有关,因此,对实际数据波形的主频进行了分析.测量并统计了不同频段下信号的波峰/波谷时间差作为信号的半周期,进而得到主周期和主频.宽频带SKS震相的主频约为0.125 Hz(8 s),低频段约为0.06 Hz(16.7 s),中频段约为0.15 Hz(6.67 s),高频段约为0.25 Hz(4 s).低频段得到的结果多为NULL值,因此我们仅对宽频带、中频段和高频段进行了双层各向异性拟合,信号的主频率分别对应为8 s、6.67 s和4 s.
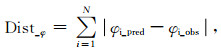
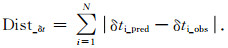
首先通过网格搜索的方式对宽频带数据进行双层各向异性模型拟合,用以约束不同深度各向异性模型参数的范围.我们从以下两个方面评估双层各向异性模型的理论预测与观测结果之间的拟合度:(1)理论模型拟合上的实测数据点数.考虑到实测结果包含误差上下限,如果理论曲线位于误差上下限范围内,则认为理论模型拟合上了该点(Eakin and Long, 2013),用FitNum_φ和FitNum_δt分别表示拟合上的快波偏振方向点数和慢波延迟时间点数.(2)理论预测的分裂结果与实测结果之间的差异.由于SIMW分析方法减少了各向异性参数个数,使得在一定后方位角范围内仅有一个各向异性结果,提高了结果的稳定性.因此,在进行双层各向异性模型拟合时,仅采用SIMW方法的分析结果.研究中采用一阶范数来计算SIMW方法结果和理论结果之间的差异.公式如下:
|
(1) |
|
(2) |
公式(1)、(2)分别给出了各向异性参数快波方向φ、慢波延迟时间δt的理论参数和实测参数差异的计算方式.“N”表示观测结果的个数;φi_pred、φi_obs分别表示快波极化方向的理论值和SIMW方法实测值;δti_pred、δti_obs为慢波延迟时间的理论值和SIMW方法的实测值.
综合考虑以上两个判断条件,FitNum_φ和FitNum_δt值越大以及Dist_φ和Dist_δt值越小,则落在观测范围内的点越多,与观测值的差异越小.对两类各向异性参数(φ、δt)采用相同的权重,并定义最终的判定标准为:

|
(3) |
搜索时我们采用了先粗网格再细网格的两步搜索方法.首先对宽频带的SIMW方法各向异性结果在-90°~90°,0~4 s的范围内进行较粗略的网格搜索,以确定最佳各向异性参数的大致范围,搜索步长分别取为10°和0.5 s.对每个搜索的双层各向异性模型计算拟合标准“C”,由此得到的最佳模型参数为:上层各向异性参数φ=30°,δt=1.0 s;下层φ=-70°,δt=2.0 s.之后在该参数附近,即上层0°~60°,0~3.0 s;下层-90°~-30°,1.0~4.0 s范围内进行以2°和0.2 s为步长的精细网格搜索.
共测试了246016个双层各向异性模型参数组合,并根据模型拟合标准“C”对模型进行排序.在最小“C”值15%范围内浮动的模型共有31个(如,Bodin et al., 2012),我们注意到这些拟合结果较好的“可接受”模型可以分为两类:第一类,模型的上层各向异性参数在φ~32°,δt~1.0 s附近, 下层各向异性参数在φ~-68°,δt~2.2 s附近;第二类模型的上层各向异性参数在φ~50°,δt~1.4 s附近,下层参数在φ~-52°,δt~2.8 s附近.两类模型均可拟合50个(25对)各向异性参数观测点中的33~34个点,拟合点数超过2/3,且两类模型的拟合标准值“C”值相近.其中第一类模型26个,第二类模型5个,图 3中分别用灰色和浅灰色曲线表示(详细结果见电子附件).两类模型在后方位角130°~170°范围内均能够较好的拟合实际数据随后方位角增大而增大的趋势.由于第一类模型在该标准下占比较高(26/31),且对快波极化方向的拟合优于第二类模型,我们最终选取这一类模型的参数代表拟合观测最佳的模型群组,并通过它们的分布获得最佳的各向异性参数离散度估计.最终得到的上层各向异性参数为φ=35°±12°,δt=1.3±0.7 s;下层各向异性参数为φ=-68°±4°,δt=2.4±0.7 s.
为进一步探索模型参数变化对实际结果拟合情况的影响,选取了“C”最小值Cmin的2倍范围内的2456个模型,这些模型至少能够拟合一半的数据点数.将这些模型的各向异性参数投影到不同的二维平面中(图 7),可以看出虽然快波偏振方向和慢波延迟时间有所不同,但具有相似的特征:下层快波偏振方向大致为WNW,而上层为NE;下层的慢波延迟时间较大.图 7展示了对观测数据拟合较好的双层各向异性模型参数的分布情况,并对前文提到的31个双层各向异性模型参数进行了突显.

|
图 7 按照拟合标准排序后,前2456个双层各向异性模型的参数分布情况 (a)、(b)、(c)、(d)分别展示了具有不同参数组合的模型投影到不同2D平面上的模型个数分布情况;右侧的灰度标度表示不同的模型数量,灰色越深表示具有这对参数的模型个数越多;红点表示我们选取的26个一类模型的参数投影;蓝点表示我们选取的5个二类模型的参数投影;黑色五角星表示采用26个一类模型得到的平均各向异性参数位置. Fig. 7 Characteristics of the top 2456 (2456 out of 246016) two-layer models in terms of data fit (a), (b), (c) and (d) show the distribution of the number of models when the models with different parameters are projected onto different 2D planes. The scale bar to the right of each plot indicates the number of models for each shade of gray, with darker colors indicating more models with those properties. The red dots represent the 26 first-class models that we selected. The blue dots represent the other 5 second-class models. And the black pentagram represents the average anisotropy parameter value obtained by using 26 first-class models. |
在拟合过程中,也获得了对SIMW分析结果拟合最好的单层各向异性模型.该模型可视为双层各向异性模型的特例,即上层各向异性参数中的慢波延迟时间δt=0 s,对应的最佳单层各向异性模型为φ=-82°,δt=1.0 s,如图 3虚线所示.尽管可以拟合30个数据点,但无法再现出各向异性参数随初始极化方向的变化趋势.该单层模型的拟合程度C值约为最小值的1.6倍,位列1000多位.对比可见,双层各向异性模型能够比单层模型更好地拟合实际观测结果.
2.4 中、高频段拟合及误差在宽频带分析的基础上,对中频段和高频段的SIMW分析结果进行了同样的双层各向异性模型拟合.基于宽频带的结果,选取较窄的各向异性参数范围:上层φ=10:2:60,δt=0.6:0.2:2.0;下层φ=-80:2:-50,δt=1.4:0.2:3.2,主周期分别为6.67 s和4 s.为得到统一的双层各向异性模型,将中频和高频段数据结合起来进行模型的判断.中频段的有效观测数据有28对,高频段有18对,根据公式(1)—(3)计算各不同频段的拟合判断值,并相加获得最终的判断标准“C”.
采用与宽频带计算模型误差同样的策略,考虑到数据点属于不同频段,略微放宽可接受模型的标准,即认为“C”最小值浮动20%范围内的模型符合观测.根据该范围内的25个模型,计算得到了双层各向异性模型的参数为:上层φ=32°±12°,δt=1.4±0.4 s;下层φ=-71°±6°,δt=2.4±0.4 s.该模型参数与宽频带各向异性参数相近,上层近NE-SW向,下层为WNW-ESE向,近似平行于板片俯冲方向,且下层慢波延迟时间远大于上层.由于同时考虑的中频段和高频段数据点数(92个)远大于宽频带SIMW分析方法得到的观测点数(50个),后文将主要以同时考虑高频段和中频段结果得到的各向异性参数作为最终的模型参数.
3 讨论 3.1 横向速度结构差异对各向异性的影响横向和垂向的非均匀各向异性结构均能够造成各向异性参数随初始极化方向的变化.宽频带地震数据的主周期为8 s,对应的菲涅耳带在200 km深度处约为120 km,在400 km深度处增加到160 km (Rümpker and Ryberg, 2000).该深度处的不均匀体若要产生各向异性的频率依赖性,其尺度要小于该深度处频率所对应的菲涅尔带半径.观测结果中,来自NE和SE方向的各向异性结果表现出不同的变化趋势.SE象限中,即后方位角135°附近观测结果表现为:高频段各向异性快波偏振方向相对于中频段发生了顺时针旋转,高频段慢波延迟时间略小;而NE象限内对应后方位角~50°的数据点,数据变化趋势相反.中频段来自NE向的各向异性快波偏振方向较来自SE向的出现顺时针10°~20°偏转(图 5).SKS震相射线虽然近垂直入射,但采样的地幔结构在深部仍存在明显差异.图 1b中插图给出了SKS震相和S震相在410 km间断面的穿透点位置,来自NE和SE的射线穿透点相距约1°(~120 km),考虑到400 km深度处的菲涅尔带半径约为160 km,因此这一系统性的差异应来自于400 km深度之下的速度结构差异.
图 8给出了后方位角48°和138°两条剖面的S波速度图像(Tao et al., 2018),并叠加了射线在660 km不连续面处的穿透点位置.来自于NE和SE方向的射线穿透点位置相距~250 km;地幔过渡带中的速度结构明显不同,两象限内的射线穿过了不同的速度异常结构.因此研究区域各向异性结构的横向变化,很可能是来自不同方位角的剪切波各向异性参数随初始极性以及频率相依性变化趋势不同的原因.

|
图 8 MDJ台站周围的S波速度结构及660 km深度处的穿透点位置 我们在两个数据集中的后方位角范围内截取了S波速度剖面.剖面A对应的后方位角为138°,B对应的为48°.层析成像数据来自FWEA18(Tao et al., 2018);红色倒三角表示MDJ台站位置;黑色圆点表示SKS射线在660 km处穿透点位置投影;小白点表示沿测线分布的地震事件;红色五角星表示我们用到的区域深源地震投影位置. (b)和(c)分别为A、B剖面的速度成像结果. Fig. 8 The velocity structure of S-wave tomography and the locations of piercing points at a depth of 660 km around MDJ station We took two profiles along two back-azimuths, where our results are mainly distributed. The back-azimuth of profile A is 138° and 48° for profile B. The tomography data is taken from FWEA18 (Tao et al., 2018). The red inverted triangle is the MDJ station. Black dots are the piercing points of SKS rays at the depth of 660 km. Small white dots are earthquake events located along profiles. The red pentagram represents the projection of the local S event we used. (b) and (c) show velocity structure along profiles A and B respectively. |
另外,倾斜莫霍面或斜向的侵入层以及俯冲板片等均能造成各向异性参数随后方位角的180°周期变化.但在实际观测中没有发现该一阶变化特征.双层各向异性模型较好拟合了观测结果的频率依赖性和大部分观测数据点随极化方向的变化趋势,特别是来自于东南方向地震波的观测结果.考虑到研究区域的俯冲背景,即处于由上层岩石圈、中间地幔部分以及下方停滞的俯冲板片构成的“大地幔楔”系统中,我们认为在东南方位角范围内各向异性参数表现出的频率依赖性、随后方位角的变化特征主要由各向异性结构的深度变化造成,即研究区域存在各向异性结构的垂向变化.
3.2 上层各向异性长周期面波各向异性研究表明(Montagner and Tanimoto, 1990; Nataf et al., 1984),在上地幔中存在方位各向异性和SH/SV极化各向异性,尤其是在上地幔顶部的200 km范围内.基于面波和体波的全球各向异性层析成像揭示出大陆下方的地幔中存在较强的各向异性,并且在全球的上地幔中均存在一定程度的各向异性,但在较深的区域各向异性明显减弱(Beghein et al., 2006; Panning and Romanowicz, 2006).区域地震P波和S波各向异性层析成像研究也都表明岩石圈中存在明显的各向异性结构(Wei et al., 2015, 2016; Zhao et al., 2016).因此上地幔岩石圈中的各向异性对研究给出的上层各向异性特征有重要影响.
通过对高频段和中频段数据的同时拟合,获得的上层各向异性参数为φ=32°±12°,δt=1.4±0.4 s,近NE-SW向的各向异性快轴方向与俯冲板块运动方向NW65°(-65°,295°)(Gripp and Gordon, 2002)相差较大,表明上层的各向异性并非板块运动引起的软流圈地幔流动所导致.该快轴方向与浅表最主要的地质构造——郯庐断裂带走向相一致.中国东北地区从中生代晚期开始就经历了多阶段的裂陷作用(Ren et al., 2002),引起了新生代板块内广泛的火山作用和变形.实验室研究和地质观测表明,在伸展或裂谷环境中,矿物的叶理面趋于水平,伸展线理方向多与伸展方向平行(如,Savage, 1999).我们得到的上层快波偏振方向与伸展方向并不一致.由于西北太平洋板片的俯冲以及印度洋板块和欧亚大陆板块的碰撞,郯庐断裂带在古近纪经过一系列复杂的演化过程发育为右旋走滑断裂(Lu et al., 1983; Xu et al., 1993).因此,我们认为与郯庐断裂带滑移相关的横向推覆形变对观测到的剪切波分裂产生了重要贡献.
假设MDJ台站下方岩石圈内的平均各向异性强度为4%,则1.4 s的慢波时间延迟对应~140 km厚的各向异性层,与该区域的岩石圈厚度(~120-160 km)相对应(An and Shi, 2006),也表明台站下方为正常岩石圈,未经历明显减薄(Zhu et al., 2012).我们也进而推断郯庐断裂带引起的形变贯穿整个岩石圈,与前人观测认为的郯庐断裂带是岩石圈尺度的构造变形带相一致(Lu et al., 1983; 卢造勋和夏怀宽, 1993; Xu et al., 1993).近期Pn波各向异性结果同样认为MDJ台站周围的快波极化方向为近NE向(Du and Lei, 2019; Lü et al., 2019),与我们的结果一致.因此,结果给出的上层各向异性体现了受郯庐断裂带影响的岩石圈中“固化”的各向异性.
3.3 下层各向异性双层各向异性模型中的下层各向异性参数为:φ=-71°±6°,δt=2.4±0.4 s.快波偏振方向与欧亚板块运动的绝对方向(NW65°,-65°)相近,指示了与岩石圈下方的软流圈流动相关的各向异性特征.区域各向异性层析成像结果显示,在约150~220 km深度处存在明显的地幔流动(Wei et al., 2015, 2016; Zhao et al., 2016).研究中拟合得到的较大的慢波延迟时间则意味着该各向异性不仅仅存在于软流圈顶部,在上地幔的深部同样存在.区域深源地震事件的直达s波(这里用s代替了S,强调是深源地震的上行波)各向异性结果给出了额外的证据.
我们在每个频段均得到了8个具有较好质量的近场/区域s波各向异性结果.与Liu等(2008)的研究对比可以发现:他们采用了2007年之前发生的5个震源深度大于450 km的数据.我们同样选取了Liu采用的地震事件,采用了不同的处理方法和质量控制条件,得到了几乎一致的各向异性结果,仅有一个事件的结果由于不满足本研究中苛刻的质量控制条件而被删除.更多的S波分裂结果没有表现出Liu等(2008)提到的慢波延迟时间与震源深度的线性关系.但各向异性参数却与初始极化方向之间存在一定的关联(图 3,5).这再次表明MDJ台站下方存在复杂的垂向各向异性结构.
在宽频段S震相的各向异性结果中,事件1999-04-08和2002-06-28发生在相同的区域,具有相近的震源深度(~566 km)和初始极化方向(72°),得到的各向异性参数几乎相同(φ=-89.7°,δt=1.2 s).在高频段S波分裂分析中用到了两个事件2000-02-13和2013-10-29,具有相近的初始极化方向和后方位角,但震源深度分别为513 km和554 km,所得到的各向异性慢波延迟时间分别为0.5 s和0.8 s.两事件震源深度不同,地震射线经过了不同的各向异性结构,造成了慢波延迟时间的差异.射线在浅部经过的结构相近,因此可以断定在513 km深度之下必定存在各向异性,即地幔过渡带中存在各向异性.若慢波延迟时间的差异只由两事件震源深度之间的介质造成,则可以估算出500 km以深的地幔过渡带内的平均各向异性强度约为3.7%.
俯冲的西北太平洋板片及其相关的地幔流动能够造成地幔楔中橄榄石晶格的定向排列.我们给出的S波分裂结果则表明各向异性的深度至少达到了地幔过渡带.地球动力学模拟表明与俯冲板片相关的地幔楔中主要为与海沟垂直或与板片俯冲方向平行的各向异性(Faccenda and Capitanio, 2012).矿物物理实验表明瓦兹利石晶体具有16.5%的各向异性强度(Zha et al., 1997; Mao et al., 2008),在地幔流动的作用下能够发生晶格优势排列,从而产生各向异性(Kawazoe et al., 2013).相比之下,林伍德石晶体的各向异性强度在3%~8%之间(Mainprice et al., 2007),其矿物集合体的各向异性强度则小于1% (Wenk et al., 2005).考虑到多种矿物晶体不同程度的定向排列及组分的复杂性,假定由地幔矿物共同作用产生的地幔具有平均约2%~3%的各向异性强度,则对应的各向异性层的厚度为360~540 km,表明各向异性层的深度可能延伸到下地幔顶部.

|
图 9 西北太平洋俯冲带和各向异性成因的三维卡通图 显示了西北太平洋俯冲区域大陆岩石圈、大地幔楔、地幔过渡带等主要构造特征.其中的APM方向为NW65°(-65°,295°).上部的灰色区域表示大陆岩石圈,并将海岸线投影其上.黑色三角形表示MDJ台站位置.标记为YL-YT(依兰—伊通)断层和DH-MS(敦化—密山)断层的红色线条表示分叉的郯庐断裂.“MDJ”下方的黄色箭头表示大陆岩石圈中的各向异性方向(~NE35°或者35°).停滞俯冲板片之上的上地幔中,大的黄色箭头指示了可能的地幔流动形式,形成了下层中的快波方向(~NW68°、-68°或292°).地幔过渡带中的绿色断线指示了地幔水平流动引起的瓦兹利石(部分可能为林伍德石)晶格优势取向排列模式.浅层地幔中的软流圈流和与板片俯冲及停滞有关的地幔流对观测到的地震各向异性均有贡献. Fig. 9 3D cartoon map of the Northwest Pacific subduction zone and the cause of anisotropy 3D cartoon showing main features of the anisotropic structures in the continental lithosphere, Big Mantle Wedge and mantle transition zone of the Northwest Pacific subduction zone. The APM direction is NW65°(-65° or 295°). The upper gray layer indicates the continental lithosphere with the coastlines projected. The black triangle indicates the location of the station MDJ. The red lines labeled YL-YT and DH-MS indicate the bifurcated Tan-Lu fault. The yellow arrow below the "MDJ" indicates the anisotropy direction in the continental lithosphere (~NE35° or 35°). The large yellow arrow in the upper mantle above the stagnant slab indicates a pattern of mantle flow, which results in the fast axis of direction in the lower layer (~NW68°, -68° or 292°). The short green bars in the MTZ indicate the LPO of wadsleyite (and maybe partly ringwoodite) caused by the lateral mantle flow. Both the asthenosphere flow in the shallow mantle and the lateral mantle flow associated with the stagnation of the slab contribute to the observed seismic anisotropy. |
Lynner采用了距离MDJ台站~250 km的事件2003-08-31(132.37°E,43.37°N,深度481 km)得到震源下方的各向异性参数为φ=-71°(109°),δt=0.7 s,并且认为造成各向异性的原因与布里奇曼石矿物各向异性有关.该方向与我们得到的接收台站下方SKS结果以及区域S波分裂结果给出的下层快波方向一致.但由于采样取自不同的深部空间范围,时间延迟不同.这正体现了研究区域下方从软流圈顶部到地幔过渡带,甚至直抵下地幔顶部的各向异性的分布特征.受俯冲板片影响,MDJ台下方有复杂的上地幔结构,呈现双660-km结构(Niu and Kawakatsu, 1996; Gao et al., 2010).其中,上界面“660-km”深度约664 km,下界面“720-km”深度约700 km,影响范围达到了下地幔顶部.动力学模拟表明(Faccenda,2014)俯冲板片的高差应力能够使俯冲板片周围下地幔顶部地幔结构产生位错蠕变,进而产生各向异性.第一性原理计算也表明布里奇曼石能够产生晶格各向异性(Mainprice et al., 2008),并且各向异性的快波偏振方向与剪切位移方向平行.
结合上述结果,我们认为观测到的下层各向异性主要受西北太平洋俯冲的影响,板块的俯冲特别是在660-km间断面上的停滞产生了和俯冲方向近乎平行的地幔流动,与上地幔浅部软流圈范围内的各向异性叠加,造成了较大的慢波时间延迟,该各向异性不仅存在于软流圈中,同时存在于地幔过渡带内,并很有可能抵达下地幔顶部~800 km的深度,这和大尺度地震层析成像给出的观测一致(Wei et al., 2015, 2016; Zhao et al., 2016).
4 结论以拥有长时间稳定记录的MDJ台站为例,探究了该台站下方的各向异性特征,发现SKS和S波各向异性结果表现出随极化方向变化的特性和频率依赖性.采用SIMW方法得到了更加精确、稳定的各向异性结果,并对该结果进行了双层各向异性模型拟合,得到双层各向异性模型参数为:上层φ=32°±12°,δt=1.4±0.4 s;下层φ=-71°±6°,δt=2.4±0.4 s.上层表现为受郯庐断裂带影响的岩石圈尺度的“固化”各向异性;下层受俯冲板片及其引起的地幔流动的影响,地幔主要矿物出现晶格优势排列,从而产生下层观测到的各向异性.这种各向异性存在于大地幔楔和地幔过渡带内,西北太平洋板片的俯冲以及在地幔过渡带中的停滞是产生这种垂向各向异性一阶特征的主要原因.
致谢 感谢IRIS DMC提供的数据支持;Sac2000和GMT软件在数据处理和绘图中起到了重要作用.
An M J, Shi Y L. 2006. Lithospheric thickness of the Chinese continent. Physics of the Earth and Planetary Interiors, 159(3-4): 257-266. DOI:10.1016/j.pepi.2006.08.002 |
Beghein C, Trampert J, Van Heijst H J. 2006. Radial anisotropy in seismic reference models of the mantle. Journal of Geophysical Research: Solid Earth, 111(B2): B02303. DOI:10.1029/2005jb003728 |
Bodin T, Sambridge M, Tkalčić H, et al. 2012. Transdimensional inversion of receiver functions and surface wave dispersion. Journal of Geophysical Research: Solid Earth, 117(B2): B02301. DOI:10.1029/2011jb008560 |
Chen H C, Niu F L, Obayashi M, et al. 2017. Mantle seismic anisotropy beneath NE China and implications for the lithospheric delamination hypothesis beneath the southern Great Xing'an range. Earth And Planetary Science Letters, 471: 32-41. DOI:10.1016/j.epsl.2017.04.030 |
Du M F, Lei J S. 2019. Pn anisotropic tomography of Northeast China and its implications to mantle dynamics. Journal of Asian Earth Sciences, 171: 334-347. DOI:10.1016/j.jseaes.2018.08.033 |
Eakin C M, Long M D. 2013. Complex anisotropy beneath the Peruvian flat slab from frequency-dependent, multiple-phase shear wave splitting analysis. Journal of Geophysical Research: Solid Earth, 118(9): 4794-4813. DOI:10.1002/jgrb.50349 |
Faccenda M, Capitanio F A. 2012. Development of mantle seismic anisotropy during subduction-induced 3-D flow. Geophysical Research Letters, 39(11): L11305. DOI:10.1029/2012gl051988 |
Faccenda M. 2014. Mid mantle seismic anisotropy around subduction zones. Physics of the Earth and Planetary Interiors, 227: 1-19. DOI:10.1016/j.pepi.2013.11.015 |
Fouch M J, Fischer K M. 1998. Shear wave anisotropy in the Mariana subduction zone. Geophysical Research Letters, 25(8): 1221-1224. DOI:10.1029/98gl00650 |
Fukao Y, Obayashi M. 2013. Subducted slabs stagnant above, penetrating through, and trapped below the 660 km discontinuity. Journal of Geophysical Research: Solid Earth, 118(11): 5920-5938. DOI:10.1002/2013jb010466 |
Gao S S, Liu K H. 2009. Significant seismic anisotropy beneath the southern Lhasa Terrane, Tibetan Plateau. Geochemistry, Geophysics, Geosystems, 10(2): Q02008. DOI:10.1029/2008gc002227 |
Gao Y A, Suetsugu D, Fukao Y, et al. 2010. Seismic discontinuities in the mantle transition zone and at the top of the lower mantle beneath eastern China and Korea: Influence of the stagnant Pacific slab. Physics of the Earth and Planetary Interiors, 183(1-2): 288-295. DOI:10.1016/j.pepi.2010.03.009 |
Gripp A E, Gordon R G. 2002. Young tracks of hotspots and current plate velocities. Geophysical Journal International, 150(2): 321-361. DOI:10.1046/j.1365-246X.2002.01627.x |
Hayes G P, Wald D J, Johnson R L. 2012. Slab1.0: A three- dimensional model of global subduction zone geometries. Journal of Geophysical Research: Solid Earth, 117(B1): B01302. DOI:10.1029/2011jb008524 |
Huang Z C, Wang L S, Zhao D P, et al. 2011. Seismic anisotropy and mantle dynamics beneath China. Earth and Planetary Science Letters, 306(1-2): 105-117. DOI:10.1016/j.epsl.2011.03.038 |
Iidaka T, Niu F L. 2001. Mantle and crust anisotropy in the eastern China region inferred from waveform splitting of SKS and PpSms. Earth, Planets and Space, 53(3): 159-168. DOI:10.1186/Bf03352373 |
Jung H, Karato S. 2001. Water-induced fabric transitions in olivine. Science, 293(5534): 1460-1463. DOI:10.1126/science.1062235 |
Jung H, Mo W, Green H W. 2009. Upper mantle seismic anisotropy resulting from pressure-induced slip transition in olivine. Nature Geoscience, 2(1): 73-77. DOI:10.1038/Ngeo389 |
Karato S, Jung H, Katayama I, et al. 2008. Geodynamic significance of seismic anisotropy of the upper mantle: New insights from laboratory studies. Annual Review of Earth and Planetary Sciences, 36: 59-95. DOI:10.1146/annurev.earth.36.031207.124120 |
Kawazoe T, Ohuchi T, Nishihara Y, et al. 2013. Seismic anisotropy in the mantle transition zone induced by shear deformation of wadsleyite. Physics of the Earth and Planetary Interiors, 216: 91-98. DOI:10.1016/j.pepi.2012.12.005 |
Lü Y, Li J, Liu L J, et al. 2019. Complex uppermost mantle structure and deformation beneath the Northwest Pacific region. Journal of Geophysical Research: Solid Earth, 124(7): 6866-6879. DOI:10.1029/2019jb017356 |
Li J, Niu F L. 2010. Seismic anisotropy and mantle flow beneath northeast China inferred from regional seismic networks. Journal of Geophysical Research: Solid Earth, 115(B12): B12327. DOI:10.1029/2010jb007470 |
Li J, Wang X J, Niu F L. 2011. Seismic anisotropy and implications for mantle deformation beneath the NE margin of the Tibet plateau and Ordos plateau. Physics of the Earth and Planetary Interiors, 189(3-4): 157-170. DOI:10.1016/j.pepi.2011.08.009 |
Li S L, Guo Z, Chen Y J. 2017. Complicated 3D mantle flow beneath Northeast China from shear wave splitting and its implication for the Cenozoic intraplate volcanism. Tectonophysics, 709: 1-8. DOI:10.1016/j.tecto.2017.04.015 |
Liu K H, Gao S S, Gao Y, et al. 2008. Shear wave splitting and mantle flow associated with the deflected Pacific slab beneath northeast Asia. Journal of Geophysical Research: Solid Earth, 113(B1): B01305. DOI:10.1029/2007jb005178 |
Long M D, Silver P G. 2008. The subduction zone flow field from seismic anisotropy: A global view. Science, 319(5861): 315-318. DOI:10.1126/science.1150809 |
Lu H F, Yu H N, Ding Y W, et al. 1983. Changing stress field in the middle segment of the Tan-Lu fault zone, eastern China. Tectonophysics, 98(3-4): 253-270. DOI:10.1016/0040-1951(83)90297-4 |
Lu Z X, Xia H K. 1993. Geoscience transect from Dong Ujimqinqi, Nei Mongol, to Donggou, Liaoning, China. Chinese Journal of Geophysics (Acta Geophysica Sinica) (in Chinese), 36(6): 765-772. |
Luo Y, Huang Z X, Peng Y J, et al. 2004. A study on SKS wave splitting beneath the China mainland and adjacent regions. Chinese Journal of Geophysics (in Chinese), 47(5): 812-821. |
Lynner C, Long M D. 2014. Sub-slab anisotropy beneath the Sumatra and circum-Pacific subduction zones from source-side shear wave splitting observations. Geochemistry, Geophysics, Geosystems, 15(6): 2262-2281. DOI:10.1002/2014gc005239 |
Lynner C, Long M D. 2015. Heterogeneous seismic anisotropy in the transition zone and uppermost lower mantle: evidence from South America, Izu-Bonin and Japan. Geophysical Journal International, 201(3): 1545-1552. DOI:10.1093/gji/ggv099 |
Mainprice D, Le Page Y, Rodgers J, et al. 2007. Predicted elastic properties of the hydrous D phase at mantle pressures: Implications for the anisotropy of subducted slabs near 670-km discontinuity and in the lower mantle. Earth and Planetary Science Letters, 259(3-4): 283-296. DOI:10.1016/j.epsl.2007.04.053 |
Mainprice D, Tommasi A, Ferré D, et al. 2008. Predicted glide systems and crystal preferred orientations of polycrystalline silicate Mg-Perovskite at high pressure: Implications for the seismic anisotropy in the lower mantle. Earth and Planetary Science Letters, 271(1-4): 135-144. DOI:10.1016/j.epsl.2008.03.058 |
Mao W L, Struzhkin V V, Baron A Q R, et al. 2008. Experimental determination of the elasticity of iron at high pressure. Journal of Geophysical Research: Solid Earth, 113(B9): B09213. DOI:10.1029/2007jb005229 |
Marson-Pidgeon K, Savage M K. 1997. Frequency-dependent anisotropy in Wellington, New Zealand. Geophysical Research Letters, 24(24): 3297-3300. DOI:10.1029/97gl03274 |
Marson-Pidgeon K, Savage M K. 2004. Modelling shear wave splitting observations from Wellington, New Zealand. Geophysical Journal International, 157(2): 853-864. DOI:10.1111/j.1365-246X.2004.02274.x |
Maruyama S, Hasegawa A, Santosh M, et al. 2009. The dynamics of big mantle wedge, magma factory, and metamorphic-metasomatic factory in subduction zones. Gondwana Research, 16(3-4): 414-430. DOI:10.1016/j.gr.2009.07.002 |
McKenzie D. 1979. Finite deformation during fluid flow. Geophysical Journal of the Royal Astronomical Society, 58(3): 689-715. DOI:10.1111/j.1365-246X.1979.tb04803.x |
Montagner J P, Tanimoto T. 1990. Global anisotropy in the upper mantle inferred from the regionalization of phase velocities. Journal of Geophysical Research: Solid Earth, 95(B4): 4797-4819. DOI:10.1029/JB095iB04p04797 |
Nataf H C, Nakanishi I, Anderson D L. 1984. Anisotropy and shear-velocity heterogeneities in the upper mantle. Geophysical Research Letters, 11(2): 109-112. DOI:10.1029/GL011i002p00109 |
Niu F L, Kawakatsu H. 1996. Complex structure of mantle discontinuities at the tip of the subducting slab beneath Northeast China—A preliminary investigation of broadband receiver functions. Journal of Physics of the Earth, 44(6): 701-711. DOI:10.4294/jpe1952.44.701 |
Panning M, Romanowicz B. 2006. A three-dimensional radially anisotropic model of shear velocity in the whole mantle. Geophysical Journal International, 167(1): 361-379. DOI:10.1111/j.1365-246X.2006.03100.x |
Qiang Z Y, Wu Q J. 2015. Upper mantle anisotropy beneath the north of northeast China and its dynamic significance. Chinese Journal of Geophysics (in Chinese), 58(10): 3540-3552. DOI:10.6038/cjg20151010 |
Rümpker G, Silver P G. 1998. Apparent shear-wave splitting parameters in the presence of vertically varying anisotropy. Geophysical Journal International, 135(3): 790-800. DOI:10.1046/j.1365-246X.1998.00660.x |
Rümpker G, Ryberg T. 2000. New "Fresnel-zone" estimates for shear-wave splitting observations from finite-difference modeling. Geophysical Research Letters, 27(13): 2005-2008. DOI:10.1029/2000gl011423 |
Ren J Y, Tamaki K, Li S T, et al. 2002. Late mesozoic and cenozoic rifting and its dynamic setting in Eastern China and adjacent areas. Tectonophysics, 344(3-4): 175-205. DOI:10.1016/S0040-1951(01)00271-2 |
Restivo A, Helffrich G. 1999. Teleseismic shear wave splitting measurements in noisy environments. Geophysical Journal International, 137(3): 821-830. DOI:10.1046/j.1365-246x.1999.00845.x |
Roy C, Winter A, Ritter J R R, et al. 2017. On the improvement of SKS splitting measurements by the Simultaneous Inversion of Multiple Waveforms (SIMW). Geophysical Journal International, 208(3): 1508-1523. DOI:10.1093/gji/ggw470 |
Sandvol E, Ni J. 1997. Deep azimuthal seismic anisotropy in the southern Kurile and Japan subduction zones. Journal of Geophysical Research: Solid Earth, 102(B5): 9911-9922. DOI:10.1029/96jb03489 |
Savage M K. 1999. Seismic anisotropy and mantle deformation: What have we learned from shear wave splitting?. Reviews of Geophysics, 37(1): 65-106. DOI:10.1029/98rg02075 |
Silver P G, Chan W W. 1991. Shear-wave splitting and subcontinental mantle deformation. Journal of Geophysical Research: Solid Earth, 96(B10): 16429-16454. DOI:10.1029/91jb00899 |
Tao K, Grand S P, Niu F L. 2018. Seismic structure of the upper mantle beneath Eastern Asia from full waveform seismic tomography. Geochemistry, Geophysics, Geosystems, 19(8): 2732-2763. DOI:10.1029/2018gc007460 |
Wei W, Zhao D P, Xu J D, et al. 2015. P and S wave tomography and anisotropy in Northwest Pacific and East Asia: Constraints on stagnant slab and intraplate volcanism. Journal of Geophysical Research: Solid Earth, 120(3): 1642-1666. DOI:10.1002/2014jb011254 |
Wei W, Zhao D P, Xu J D, et al. 2016. Depth variations of P-wave azimuthal anisotropy beneath Mainland China. Scientific Reports, 6: 29614. DOI:10.1038/srep29614 |
Wenk H R, Ischia G, Nishiyama N, et al. 2005. Texture development and deformation mechanisms in ringwoodite. Physics of the Earth and Planetary Interiors, 152(3): 191-199. DOI:10.1016/j.pepi.2005.06.008 |
Wustefeld A, Bokelmann G, Zaroli C, et al. 2008. SplitLab: A shear-wave splitting environment in Matlab. Computers & Geosciences, 34(5): 515-528. DOI:10.1016/j.cageo.2007.08.002 |
Xu X W, Ma X Y, Deng Q D. 1993. Neotectonic activity along the shanxi rift system, China. Tectonophysics, 219(4): 305-325. DOI:10.1016/0040-1951(93)90180-R |
Zha C S, Duffy T S, Mao H K, et al. 1997. Single-crystal elasticity of β-Mg2SiO4 to the pressure of the 410 km seismic discontinuity in the Earth's mantle. Earth and Planetary Science Letters, 147(1-4): E9-E15. DOI:10.1016/S0012-821X(97)00010-1 |
Zhang S Q, Karato S I. 1995. Lattice preferred orientation of olivine aggregates deformed in simple shear. Nature, 375(6534): 774-777. DOI:10.1038/375774a0 |
Zhao D P, Tian Y, Lei J S, et al. 2009. Seismic image and origin of the Changbai intraplate volcano in East Asia: Role of big mantle wedge above the stagnant Pacific slab. Physics of the Earth and Planetary Interiors, 173(3-4): 197-206. DOI:10.1016/j.pepi.2008.11.009 |
Zhao D P, Yu S, Liu X. 2016. Seismic anisotropy tomography: New insight into subduction dynamics. Gondwana Research, 33: 24-43. DOI:10.1016/j.gr.2015.05.008 |
Zheng S H, Gao Y. 1994. Azimuthal anisotropy in lithosphere on the Chinese mainland from observations of SKS at CDSN. Acta Seismologica Sinica (in Chinese), 16(2): 131-140. |
Zhu R X, Yang J H, Wu F Y. 2012. Timing of destruction of the North China Craton. Lithos, 149: 51-60. DOI:10.1016/j.lithos.2012.05.013 |
卢造勋, 夏怀宽. 1993. 内蒙古东乌珠穆沁旗—辽宁东沟地学断面. 地球物理学报, 36(6): 765-772. DOI:10.3321/j.issn:0001-5733.1993.06.008 |
罗艳, 黄忠贤, 彭艳菊, 等. 2004. 中国大陆及邻区SKS波分裂研究. 地球物理学报, 47(5): 812-821. DOI:10.3321/j.issn:0001-5733.2004.05.012 |
强正阳, 吴庆举. 2015. 中国东北地区北部上地幔各向异性及其动力学意义. 地球物理学报, 58(10): 3540-3552. DOI:10.6038/cjg20151010 |
郑斯华, 高原. 1994. 中国大陆岩石层的方位各向异性. 地震学报, 16(2): 131-140. |