 2021, Vol. 64

2. 新疆维吾尔自治区地震局, 乌鲁木齐 830011;
3. 桂林理工大学, 桂林 541006
 , CHEN ShunYun1, LIU QiongYing1
 , YAN Wei2, LIU PeiXun1, SONG ChunYan2, FENG JiaHui1, CHEN LiChun3,1
2. Earthquake Administration of Xinjiang Uygur Autonomous Region, Urumqi 830011, China;
3. Guilin University of Technology, Guilin 541006, China
近年的研究证实基岩温度中包含有地壳应力动态变化的信息,据此,基岩温度正在发展为一个新的地球物理观测量(陈顺云等,2020).最近的研究还显示:基岩温度中不仅含有应力变化信息,还蕴含浅层地壳流体运移信息(Liu et al., 2019, 2020).事实上,流体运移造成的温度变化比应力变化直接引起的温度响应量级大,更易识别(陈顺云等,2020).
地下流体运移时必然携带热量,从而产生温度变化.反之,温度可用来对地下流体进行示踪(Anderson, 2005;Goto et al., 2005;Constantz, 2008;Rau et al., 2010;Saar, 2011;Kurylyk and Irvine, 2019). 一般地,近地表测温数据具有周期性(日、年)波动特征,其波动幅度随深度的增加呈现指数型衰减,相位随深度的增加具有线性延迟(吴志伟和宋汉周,2013;Irvine et al., 2015;Jimsheladze et al., 2019).这种温度振幅衰减、相位延迟特性与地下流体活动密切相关(吴志伟和宋汉周,2010;马瑞等,2013;Irvine et al., 2017;Kuryly and Irvine, 2019;Liu et al., 2019). 据此,利用温度在地质体中的传递规律,能有效确定地下流体运移信息.
早在20世纪60年代,Stallman(1965)提出垂向流体作用下热传递方程的封闭解,利用温度周期性波动特征建立地下水流速的解析模型,在此解析模型中,热扩散系数是计算地下水流速的重要输入参数.此后,研究者提出了许多分析技术对Stallman(1965)解析模型进行应用探索,比如从记录在浅层河床中的多深度日周期温度信号推断垂直地下水通量(Hatch et al., 2006;Gordon et al., 2012;葛孟琰等,2018),但这些分析方法通常需要事先确定热扩散系数(McCallum et al., 2012;Gordon et al., 2012).
实际上,基于浅层地壳不同深度的温度振幅、相位可分别获得热扩散系数(Horton et al., 1983;van Manen and Wallin, 2012).为与真实的热扩散系数区分,将这种由振幅、相位得到的热扩散系数称为视热扩散系数.流体运移对振幅和相位的影响存在明显差异,导致由振幅和相位变化获得的两个视热扩散系数存在差异,反之,利用这种差异可以获得地下流体运移速度和流向等信息.Liu等(2019, 2020)基于青藏高原东南缘的基岩温度数据,尝试将这一方法用于获取区域视热扩散系数以及地下流体运移信息,为基岩温度这一新的地球物理观测量提供了一个新的应用方向.但仍有两方面问题需要继续深入:(1)视热扩散系数的差异源于流体的影响,也就意味着有流体存在时,视热扩散系数与真实热扩散系数并不相等.视热扩散系数与真实热扩散系数之间的关系有必要深入探讨;(2)作为一个新的方法,例子较少,还需新数据进一步完善,尤其是该项研究是以年周期温度信号为基础,意味着需要较长时间的野外观测数据积累.
作者所在研究组于2016年在新疆喀什地区组建了包含5个测点的基岩温度观测台网,目前已有约4年的数据积累,为深入研究流体运移信息提供了一个新的机会.在Liu等(2019)思路基础上,本文进一步探讨和完善了视热扩散系数与真实热扩散系数的关系,并基于喀什地区积累的多年地温连续观测数据,获得了测点浅层真实热扩散系数及地下流体流速和流向信息.
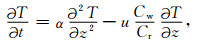
1 基本理论在一维均匀介质条件下,热传导和热对流耦合的平衡方程为(Suzuki, 1960)
|
(1) |
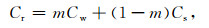
其中T为温度,t为时间,α为热扩散系数,z为距离地表的深度,u为地下流体的流速(u>0时,流向向下),Cw为水的容积热容,是水的密度与水的热容的乘积,因基岩温度的观测深度仅几十米,未考虑温度变化引起的水的容积热容变化,Cr为固体介质-流体系统的容积热容,可以定义为(Rau et al., 2014)
|
(2) |
其中m为固体介质的有效孔隙度,Cs为固体骨架的容积热容.
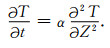
在不考虑流体效应时,则(1)式退化为热传导方程
|
(3) |
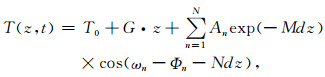
一般情况下,地表温度波可表示为(Liu et al., 2017)

|
(4) |
式中T0为地表平均温度,ωn=2π/Tn,为n阶变化的角频率,Tn为n阶变化的周期.An,Φn分别为n阶变化的振幅和相位.
对于半无限空间,求解(1)、(4)式,可得一维均匀介质条件下不同深度上温度变化解(Gao et al., 2003, 2008):
|
(5) |
其中,G为稳定状态下的地温梯度,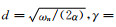
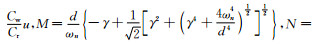
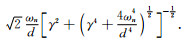
(5) 式中,exp(Mdz)代表不同深度温度波的振幅衰减情况,Ndz代表相位变化情况.M和N中只有热扩散系数α和流体流速u两个变量.也就是说,给定某一个频率的温度波,如年周期温度波,根据两个不同深度温度波的振幅、相位变化信息,可以获得两个深度层之间地层的热扩散系数α和流体流速u (Gao et al., 2003, 2008):
|
(6) |
|
(7) |
其中,Φ1和Φ2分别为z1和z2深度的相位,A1和A2和分别为z1和z2深度的振幅.
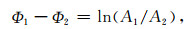
① 当不考虑流体效应(u=0),即热量传输过程中只存在热传导过程时,根据(7)式,有
|
(8) |
上式给出了仅存在热传导时,两个不同深度温度相位与振幅之间的关系.此时,利用温度波的振幅或相位均能获得热扩散系数:

|
(9) |
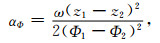
② 当存在流体带来的热对流效应(u≠0)时,热扩散系数由式(9)给出.但地下流体对温度波振幅和相位的影响存在差异:向下的流体流动(u>0),减缓振幅衰减速率;向上的流体流动(u<0),加快振幅的衰减速率;相位通常受到地下流体影响而减小,与流向关系不大(Liu et al., 2020).此时,仅单独通过温度波的振幅或相位变化获得的热扩散系数并不相等.为了方便,定义:

|
(10) |
|
(11) |
其中,αA和αΦ分别代表通过温度波的振幅和相位变化获得的热扩散系数,可称为视热扩散系数(Horton et al., 1983;van Manen and Wallin, 2012).
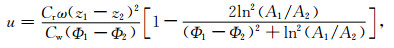
进一步,根据(6)、(10)、(11)三式,可推导出由αA和αΦ计算真实热扩散系数的公式:

|
(12) |
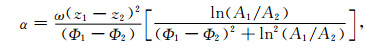
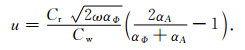
根据(7)、(10)、(11)三式,可获得地下流体流速(Liu et al., 2019):
|
(13) |
归纳起来,有
(1) u=0时,即仅存在热传导,ln(A1/A2)=Φ1-Φ2,α=αA=αΦ;
(2) u<0时,流体向上运移,ln(A1/A2)>Φ1-Φ2,αA<αΦ;
(3) u>0时,流体向下运移,ln(A1/A2)<Φ1-Φ2,αA>αΦ.
总之,通过对比分别由不同深度温度波的振幅、相位计算的视热扩散系数之间的差异,可以获得流体流动速度和方向.这意味着,通过多深度长期地温观测,能够有效确定地下流体运移信息.
2 数据及计算结果 2.1 测点情况2016年,作者所在研究组在喀什及周边地区组建了包含有5个钻孔的基岩温度观测台网(图 1),测点主要位于喜马拉雅西构造结与西南天山逆冲推覆构造系交汇部位,测点具体信息见表 1.

|
图 1 基岩温度测点分布 Fig. 1 Distribution of the bedrock temperature measurement stations |
|
|
表 1 基岩温度测点信息 Table 1 Information about the bedrock temperature measurement stations |
每个基岩温度观测点的钻孔直径为89 cm,安装温度传感器之后用水泥浆灌注封井,使温度传感器与基岩耦合为一体.温度传感器采样周期设为5 min,测量精度可达到0.2 mK(张智河等,2018),每个钻孔中,安装2~3组温度采集器,每组包含4个温度传感器,温度传感器最大观测深度为32 m,在钻孔中开展多深度温度观测.
2.2 原始数据与预处理喀什地区基岩地温自2016年3月开始连续观测,迄今为止,已有约4年的数据积累.考虑到水泥凝固散热的影响,本文选取观测开始2~3个月之后的数据进行分析.图 2给出了5个基岩地温点不同深度温度随时间变化过程,从图中可以看出,温度波随深度增加具有振幅衰减、相位延迟的特征,与理论预期一致.其中,年周期温度变化最为显著,适合开展流体运移分析.

|
图 2 测点原始温度变化 Fig. 2 The variations of the recorded temperatures at each measurement station |
同时,观测数据存在如下问题:(1)部分测点存在数据缺失,主要为上阿图什乡测点(SA);(2)马场测点(MC)部分深度温度出现明显不规则波动,年周期成分不显著,不能获取年周期温度信息.采用温度观测数据提取流体运移信息之前,需要对数据进行预处理.
关于温度资料的预处理,主要包括以下三个部分:
(1) 筛选数据,选取年周期温度信号较为明显的整年数据段;
(2) 剔除数据异常点,并用线性插值法进行补充;
(3) 拟合,数据量缺失较大时,采用傅里叶级数拟合以合理表示温度趋势性变化.
2.3 数据处理步骤测点原始温度进行预处理后随时间的变化情况如图 3所示.从图中可以看出,年周期特征明显,振幅和相位随深度的变化也比较清楚.基于预处理后的基岩温度数据,利用不同深度的年周期温度波振幅和相位,可进一步获取流体运移信息.具体处理过程包括:

|
图 3 预处理后温度变化 Fig. 3 The variations of the temperatures after processing |
(1) 将各测点各深度的温度数据,进行傅里叶变换,获取年周期温度波振幅(以下简称年振幅)和相位(以下简称年相位);
(2) 将年振幅、年相位分别代入(10)式、(11)式,计算出两个(视)热扩散系数αA和αΦ,然后将αA和αΦ代入(12)式计算热扩散系数α;
(3) 根据αA和αΦ,由(13)式获取地下流体流速、流向信息,式中固体骨架的容积热容Cs、孔隙度m通过实测测点处钻孔岩芯样品获得,取值分别为2.078×10⁶J·(m3·K)-1、1.1%.
2.4 结果分析由傅里叶变换得到各测点各深度年振幅和年相位如图 4所示.从图 4中可以看出,年振幅随深度的增加呈现指数型衰减,年相位随深度的增加具有线性延迟.其中,乌帕尔乡测点(WP)年相位与深度关系表现异常,可能因为测点周围区域介质、裂缝的不均匀性或存在横向地下流体,有待进一步分析.

|
图 4 年振幅和年相位随深度的变化 Fig. 4 The variations of amplitude and phase of annual periodic temperature wave with depth |
此时,通过对比测点不同深度年振幅比的对数与年相位差值大小,可以对测点区域热量传输方式以及流体运移信息进行粗略推断.图 5给出了测点各深度对年振幅比的对数和年相位差数值大小,直线代表(8)式的理论关系,即热传导理论模型.从图中可以看出,膘尔依阔托乡测点(PX)和康苏镇测点(KS)年振幅比的对数和年相位差大致相等,代表测点区域热量传输方式主要为热传导机制;上阿图什乡测点(SA)、乌帕尔乡测点(WP)、马场测点(MC)年振幅比的对数明显大于年相位差,说明测点区域存在向上运动的流体,流体流速较大.

|
图 5 不同深度年振幅比的对数和相位差比较 Fig. 5 Comparisons of amplitude ratio and phase shift of annual periodic segment of temperatures for various depth pairs |
在获得测点不同深度的年振幅和年相位后,可进一步获得三方面的结果:热扩散系数,地下流体流速和流向.表 2给出了各测点由年振幅及年相位确定的热扩散系数和地下流体流速、流向信息.
|
|
表 2 测点热扩散系数和流体流速、流向 Table 2 The thermal diffusivity and fluid velocity and flow direction of each temperature measurement station |
由振幅计算得到的(视)热扩散系数αA为(0.79~1.71) ×10-6m2·s-1,平均值为1.37×10⁻⁶m2·s-1;由相位计算得到的(视)热扩散系数αΦ为(1.53~ 33.1)×10-6m2·s-1,平均值为12.0×10⁻⁶m2·s-1;真实热扩散系数α为(1.52~8.91)×10-6m2·s-1,平均值为4.10×10⁻⁶m2·s-1.在数值上,αA整体小于αΦ,说明测点区域的热量传输过程中存在流体运移产生的热效应.
由各测点(视)热扩散系数αA和αΦ计算的区域多年平均地下流体流速为(0.10~9.71)×10-7m·s-1,流体流向均向上.其中,膘尔依阔托乡测点(PX)、康苏镇测点(KS)处流体流速较小,乌帕尔乡测点(WP)、马场测点(MC)处流体流速较大,上阿图什乡测点(SA)处流体流速位于两者之间.不同测点流体流速存在差异,预示着该区域地下流体活动具有区域性.
3 讨论 3.1 热扩散系数分析流体的存在导致由振幅计算获得的(视)热扩散系数αA和由相位计算获得的(视)热扩散系数αΦ之间有所差异, 其理论模型见图 6.从图 6可以看出,当流体存在时,(视)热扩散系数αA、αΦ与真实热扩散系数α之间并不相等,相对而言,αΦ更接近真实热扩散系数α.

|
图 6 热扩散系数随流体流速变化(改于Liu等(2019)) αA表示由振幅计算获得的(视)热扩散系数,αΦ表示由相位计算获得的(视)热扩散系数,α为真实的热扩散系数. Fig. 6 The variations of thermal diffusivity with fluid velocity (modified from Liu et al(2019)). The αA represents the apparent thermal diffusivity calculated by the amplitude, the αΦ represents the apparent thermal diffusivity calculated by the phase, and the α is the real thermal diffusivity. |
为了深入探讨(视)热扩散系数αA、αΦ与真实热扩散系数α之间的关系,表 3给出了测点区域热扩散系数的对比.其中,乌帕尔乡(WP)、马场(MC)测点由温度数据计算获得的真实热扩散系数(6.24、8.91×10⁶ m2·s-1)与实测饱水状态下钻孔岩芯样品获得的热扩散系数均值(2.12×10⁶ m2·s-1)相差较大,可能说明乌帕尔乡测点(WP)、马场测点(MC)区域除了垂向流外,还存在横向流.考虑到喀什地区地温测点数量较少,现将Liu等(2019)在青藏高原东南缘测点区域获得的(视)热扩散系数αA和αΦ代入(12)式,计算真实热扩散系数α,结果见表 3.
|
|
表 3 热扩散系数对比 Table 3 Comparisons of thermal diffusivity |
从表 3可以看出,除了乌帕尔乡测点(WP)和马场测点(MC)外,其余测点区域的(视)热扩散系数αΦ在数值上更加接近真实热扩散系数α.这也就意味着,在计算热扩散系数时,采用相位差计算得到的(视)热扩散系数,更加接近真实的热扩散系数.
3.2 流速误差分析地下流体流速与固体介质-流体流系的容积热容表现出正向线性关系, 孔隙度和固体骨架容积热容是控制固体介质-流体流系容积热容的主要参数(Rau et al., 2010).喀什地区5个测点中有3个测点,膘尔依阔托乡(PX)、康苏镇(KS)、马场(MC)测点岩芯样品保持较好.实测饱水状态下岩芯样品获得的孔隙度分别为1.46%、0.4%、1.56%,平均值为1.1%,实测干燥状态下岩芯样品获得的固体骨架容积热容分别为2.097、1.883、2.254×10⁶J·(m3·K)-1,平均值为2.078×10⁶J·(m3·K)-1.样品数量有限,可能造成孔隙度、固体骨架容积热容的取值存在不确定性,导致流体流速的计算结果存在误差.古生代沉积岩的孔隙度一般不超过10%.据分析,当孔隙度取1.1~10%时,引起的固体介质-流体流系的容积热容变化仅为5%.当岩石固体骨架容积热容的不确定性取10%,孔隙度由1.1%增至10%时,各测点的流体流速误差分别为±2.85×10⁻⁹m·s-1、±1.90×10⁻⁹m·s-1、±4.46×10⁻⁸m·s-1、±2.23× 10⁻⁷m·s-1、±1.97×10⁻⁷m·s-1,如图 7所示.

|
图 7 流速误差分布 Fig. 7 Distribution of flow velocity errors |
各测点地下流体流速随深度的变化见图 8.从图中可以看出,膘尔依阔托乡测点(PX)、康苏镇测点(KS)流体流速在最后一个深度层中发生了变化,在数值上从负值变成正值,意味着地下流体流向发生转变.流向发生转变,可能代表这两个测点在此层中出现局部流速变化,且流体在此层上下的流向并不相同,但因缺少后续深度温度数据,不能确定具体原因;上阿图什乡测点(SA)和乌帕尔乡测点(WP)流体流向均未发生转变;马场测点(MC)流体流速变化存在极大值点,可能因为在此深度层中存在裂隙,使流体流速突然增加,具体分析有待进一步研究.

|
图 8 流速随深度变化 Fig. 8 The variations of flow velocity with depth |
从流速结果上看,不同测点流体流速差异较大.靠近天山地区的测点膘尔依阔托乡(PX)、康苏镇(KS)和上阿图什乡(SA)地下流体流速均小于5×10⁻⁷m·s-1;靠近昆仑山地区的测点乌帕尔乡(WP)、马场(MC)地下流体流速均大于5×10⁻⁷m·s-1.
上述不同地区测点流体流速差异,可能与当地的水文地质环境有关.新疆乌恰-喀什地区位于帕米尔弧北段,处于南天山地震带、西昆仑山带和塔里木地台的喀什新生代拗陷代衔接地带(尚新璐等,2004;王琼等,2007;高国英等,2009).北部西南天山区域属于克孜勒河地下水流动亚系统,南部昆仑山山脉属于盖孜河地下水流动亚系统,南部水系比北部水系更为发育,补给量也更为丰富(王艺星和乃尉华,2018).根据曲鹏飞(2015)统计结果得知,克孜勒河-恰克马河地质单元在地下水渗透量和排泄量的结果上均小于盖孜河-库山河地质单元.除此之外,新疆乌恰-喀什地区的温泉水温在分布上也具有明显的地区规律,昆仑山地区温泉水温温度普遍较高,天山地区温泉水温略微低一些(王道等,1999).
总之,昆仑山地区和天山地区,在水文地质条件和温泉分布上存在明显的差异,这与本文计算获得的地下流体流速存在类似的特征保持一致.
3.5 存在的问题(1) 本文研究表明,通过多深度的连续基岩温度观测,能够获得浅层地壳的热扩散系数与流体运移信息.然而,在方法上,仅考虑了垂向流,当存在明显的横向流时,本文方法可能不再适用.另外,在计算过程中,仅将地下介质假定为均匀介质,客观上,野外地质环境存在非均匀性.也就是说,更深入的工作可能需要考虑流体的横向流以及介质的非均匀性问题.
(2) 基于基岩温度观测的年周期信息获取浅层地壳流体的运移信息,属于一种新方法,其结果理应与区域水文地质资料等其他观测手段进行对比验证.鉴于基岩温度观测最初设计是为了观测地壳应力状态的变化情况,水文地质方面的工作考虑较少,测点附近高精度的水文地质资料的获取比较困难.然而,考虑到本文的研究方法具有相对独立性,获得的流体信息并不依赖于其他手段,属于一项相对完整的研究工作.因此,与水文资料的对比分析工作,可在将来独立补充.
(3) 本文是基于年周期信息获得的流体流速,相当于多年的平均流体流速,代表多年稳定变化,并不能真实地反映短期的流体变化.流体随时间的变化,对于地震前兆探索更有实际意义.实际上,依照固定区间平滑算法,可以得到流体流速随时间的动态变化过程(Liu et al., 2020).鉴于新疆喀什地区属于地震多发区,深入研究下去,有可能为地震分析提供一个潜在的地震前兆手段.
4 结论本文基于新疆喀什地区5个测点约4年的基岩温度数据,开展温度-时间序列分析,利用温度振幅、相位估算了不同测点的热扩散系数,并进一步获得了该区域浅层热量传输方式以及垂向地下流体流速等方面的结果.主要结论如下:
(1) 5个测点由振幅计算得到的(视)热扩散系数αA为(0.79~1.71)×10-6 m2·s-1,由相位计算得到的(视)热扩散系数αΦ为(1.53~33.1)×10-6m2·s-1,真实热扩散系数α为(1.52~8.91)×10-6m2·s-1.流体的存在导致振幅、相位获得的(视)热扩散系数之间存在差异,与真实热扩散系数不相等.测点区域获得的(视)热扩散系数αA和αΦ在数值上存在明显差异,说明测点区域的热量传输过程中存在流体运移产生的热效应.另外发现,当流体热效应不明显时,通过相位获得的(视)热扩散系数更加接近真实热扩散系数.
(2) 膘尔依阔托乡(PX)、康苏镇(KS)、上阿图什乡(SA)、乌帕尔乡(WP)和马场(MC)测点处的地下流体流速分别为1.1×10⁻⁸、1.0×10⁻⁸、1.94×10⁻⁷、9.71×10⁻⁷、8.56×10⁻⁷ m·s-1,流体流向均向上.不同测点流体流速存在明显的差异.靠近天山地区的测点膘尔依阔托乡(PX)、康苏镇(KS)和阿图什乡(SA)流体流速较小,靠近昆仑山地区的测点乌帕尔乡(WP)、马场(MC)流体流速比较大.这意味着昆仑山地区和天山地区水热活动的水文地质条件可能不同,更深入情况有待进一步研究.
致谢 王海涛研究员对基岩温度台站建设提供了全面的工作支持, 张文来、吴传勇、黄瑜、桂荣、余新和木拉提江等参加了踏勘与建设及维护野外工作, 陈杰研究员为野外测点布设提供了建议,刘力强研究员提供了技术支持.孔隙度、热扩散系数、容积热容分别在中国地震局地质研究所高温高压岩石物理实验室和油气资源与探测国家重点实验室测得,朱传庆副教授和段庆宝副研究员对实验测试提供了帮助.三位审稿人提供了具有建设性的意见.一并致谢.
Anderson M P. 2005. Heat as a ground water tracer. Groundwater, 43(6): 951-968. DOI:10.1111/j.1745-6584.2005.00052.x |
Chen S Y, Liu P X, Chen L C, et al. 2020. Evidence from seismological observation for detecting dynamic change in crustal stress by bedrock temperature. Chinese Science Bulletin (in Chinese), 65(22): 2395-2405. DOI:10.1360/TB-2020-0089 |
Constantz J. 2008. Heat as a tracer to determine streambed water exchanges. Water Resources Research, 44(4): W00D10. DOI:10.1029/2008WR006996 |
Gao G Y, Guo W Y, Long H Y. 2009. Research and ponderation over the efficiency of annual seismic prediction for Wuqia-Kashi region in Xinjiang. Northwestern Seismological Journal (in Chinese), 31(4): 397-402. DOI:10.3969/j.issn.1000-0844.2009.04.016 |
Gao Z Q, Fan X G, Bian L. 2003. An analytical solution to one-dimensional thermal conduction-convection in soil. Soil Science, 168(2): 99-107. DOI:10.1097/00010694-200302000-00004 |
Gao Z Q, Lenschow D H, Horton R, et al. 2008. Comparison of two soil temperature algorithms for a bare ground site on the Loess Plateau in China. Journal of Geophysical Research: Atmospheres, 113(D18): D18105. DOI:10.1029/2008JD010285 |
Ge M Y, Ma R, Sun Z Y, et al. 2018. Using heat tracer to estimate river water and groundwater interactions in Alpine and cold regions: A case study of Hulugou watershed in upper reach of Heihe River. Earth Science (in Chinese), 43(11): 4246-4255. |
Gordon R P, Lautz L K, Briggs M A, et al. 2012. Automated calculation of vertical pore-water flux from field temperature time series using the VFLUX method and computer program. Journal of Hydrology, 420-421: 142-158. DOI:10.1016/j.jhydrol.2011.11.053 |
Goto S, Yamano M, Kinoshita M. 2005. Thermal response of sediment with vertical fluid flow to periodic temperature variation at the surface. Journal of Geophysical Research: Solid Earth, 110: B01106. DOI:10.1029/2004JB003419 |
Hatch C E, Fisher A T, Revenaugh J S, et al. 2006. Quantifying surface water-groundwater interactions using time series analysis of streambed thermal records: Method development. Water Resources Research, 42: W10410. DOI:10.1029/2005WR004787 |
Horton R, Wierenga P J, Nielsen D R. 1983. Evaluation of methods for determining the apparent thermal diffusivity of soil near the surface. Soil Science Society of America Journal, 47(1): 25-32. DOI:10.2136/sssaj1983.03615995004700010005x |
Irvine D J, Lautz L K, Briggs M A, et al. 2015. Experimental evaluation of the applicability of phase, amplitude, and combined methods to determine water flux and thermal diffusivity from temperature time series using VFLUX 2. Journal of Hydrology, 531: 728-737. DOI:10.1016/j.jhydrol.2015.10.054 |
Irvine D J, Briggs M A, Lautz L K, et al. 2017. Using diurnal temperature signals to infer vertical groundwater-surface water exchange. Groundwater, 55(1): 10-26. DOI:10.1111/gwat.12459 |
Jimsheladze T, Buntebarth G, Melikadze G. 2019. The history of the surface temperature at Ajameti/Georgia as extracted from long-term temperature records in the subsurface. International Journal of Terrestrial Heat Flow and Applied Geothermics, 2(1): 6-10. DOI:10.31214/ijthfa.v2i1.31 |
Kurylyk B L, Irvine D J. 2019. Heat: an overlooked tool in the practicing hydrogeologist's toolbox. Groundwater, 57(4): 517-524. DOI:10.1111/gwat.12910 |
Liu Q Q, Shi Y N, Wei D P, et al. 2017. Near-surface geothermal gradient observation and geothermal analyses in the Xianshuihe fault zone, eastern Tibetan Plateau. Acta Geologica Sinica-English Edition, 91(2): 414-428. DOI:10.1111/1755-6724.13108 |
Liu Q Y, Chen S Y, Jiang L W, et al. 2019. Determining thermal diffusivity using near-surface periodic temperature variations and its implications for tracing groundwater movement at the eastern margin of the Tibetan Plateau. Hydrological Processes, 33(8): 1276-1286. DOI:10.1002/hyp.13399 |
Liu Q Y, Chen S Y, Chen L C, et al. 2020. Detection of groundwater flux changes in response to two large earthquakes using long-term bedrock temperature time series. Journal of Hydrology, 590: 125245. DOI:10.1016/j.jhdrol.2020.125245 |
Ma R, Dong Q M, Sun Z Y, et al. 2013. Using heat to trace and model the surface water-groundwater interactions: A review. Geological Science and Technology Information (in Chinese), 32(2): 131-137. |
McCallum A M, Andersen M S, Rau G C, et al. 2012. A 1-D analytical method for estimating surface water-groundwater interactions and effective thermal diffusivity using temperature time series. Water Resources Research, 48(11): W11532. DOI:10.1029/2012WR012007 |
Qu P F. 2015. Evaluation and sustainable utilization of groundwater resources in Kashi economic development region[Master's thesis] (in Chinese). Xi'an: Chang'an University, 29-49.
|
Rau G C, Andersen M S, McCallum A M, et al. 2010. Analytical methods that use natural heat as a tracer to quantify surface water-groundwater exchange, evaluated using field temperature records. Hydrogeology Journal, 18(5): 1093-1110. DOI:10.1007/s10040-010-0586-0 |
Rau G C, Andersen M S, McCallum A M, et al. 2014. Heat as a tracer to quantify water flow in near-surface sediments. Earth-Science Reviews, 129: 40-58. DOI:10.1016/j.earscirev.2013.10.015 |
Saar M O. 2011. Review: Geothermal heat as a tracer of large-scale groundwater flow and as a means to determine permeability fields. Hydrogeology Journal, 19(1): 31-52. DOI:10.1007/s10040-010-0657-2 |
Shang X L, Chen X W, Wu C, et al. 2004. Cenozoic thrust structures in the Kashi area, western Tarim basin. Chinese Journal of Geology (in Chinese), 39(4): 543-550, 603. |
Stallman R W. 1965. Steady one-dimensional fluid flow in a semi-infinite porous medium with sinusoidal surface temperature. Journal of Geophysical Research, 70(12): 2821-2827. DOI:10.1029/JZ070i012p02821 |
Suzuki S. 1960. Percolation measurements based on heat flow through soil with special reference to paddy fields. Journal of Geophysical Research, 65(9): 2883-2885. DOI:10.1029/jZ070i012002821 |
van Manen S M, Wallin E. 2012. Ground temperature profiles and thermal rock properties at Wairakei, New Zealand. Renewable Energy, 43: 313-321. DOI:10.1016/j.renene.2011.11.032 |
Wang D, Xu Q L, Chen L, et al. 1999. A study of underground hot water of Xinjiang in relation to earthquakes. Seismology and Geology (in Chinese), 21(1): 58-62. |
Wang Q, Wang H T, Zhao W M, et al. 2007. Possible reason of quiescence of strong earthquake in Kashi-Wuqia region in recent years. Earthquake (in Chinese), 27(2): 99-111. |
Wang Y X, Nai W H. 2018. The study on the characteristics ofgroundwater flow system in Kashi economic development zone. Ground Water (in Chinese), 40(1): 10-11, 42. |
Wu Z W, Song H Z. 2010. Numerical simulation of thermal convection in shallow ground temperature field. Rock and Soil Mechanics (in Chinese), 31(4): 1303-1308. |
Wu Z W, Song H Z. 2013. Sensitivity analysis of determining seepage velocity using temperature records. Advances in Water Science (in Chinese), 24(6): 877-882. |
Zhang Z H, Chen S Y, Liu P X. 2018. A key technology for monitoring stress by temperature: Multichannel temperature measurement system with high precision and low power consumption. Seismology and Geology (in Chinese), 40(2): 499-510. |
陈顺云, 刘培洵, 陈立春, 等. 2020. 热测应力: 测震学证据. 科学通报, 65(22): 2395-2405. DOI:10.1360/TB-2020-0089 |
高国英, 郭卫英, 龙海英. 2009. 对新疆乌恰——喀什地区年度地震预测的总结与思考. 西北地震学报, 31(4): 397-402. DOI:10.3969/j.issn.1000-0844.2009.04.016 |
葛孟琰, 马瑞, 孙自永, 等. 2018. 高寒山区河水与地下水相互作用的温度示踪: 以黑河上游葫芦沟流域为例. 地球科学, 43(11): 4246-4255. |
马瑞, 董启明, 孙自永, 等. 2013. 地表水与地下水相互作用的温度示踪与模拟研究进展. 地质科技情报, 32(2): 131-137. |
曲鹏飞. 2015. 喀什经济开发区地下水资源评价和可持续利用[硕士论文]. 西安: 长安大学, 29-49.
|
尚新璐, 陈新卫, 吴超, 等. 2004. 塔里木盆地西部喀什地区的新生代冲断构造. 地质科学, 39(4): 543-550, 603. DOI:10.3321/j.issn:0563-5020.2004.04.010 |
王道, 许秋龙, 陈玲, 等. 1999. 新疆地下热水特征及其与地震活动的关系. 地震地质, 21(1): 58-62. |
王琼, 王海涛, 赵卫明, 等. 2007. 喀什-乌恰地区近年来强震活动平静的可能成因. 地震, 27(2): 99-111. |
王艺星, 乃尉华. 2018. 新疆喀什经济开发区地下水流动系统特征研究. 地下水, 40(1): 10-11, 42. |
吴志伟, 宋汉周. 2010. 浅层地温场中热对流数值模拟. 岩土力学, 31(4): 1303-1308. DOI:10.3969/j.issn.1000-7598.2010.04.051 |
吴志伟, 宋汉周. 2013. 温度时序资料确定地下水流速解析模型灵敏度分析. 水科学进展, 24(6): 877-882. |
张智河, 陈顺云, 刘培洵. 2018. 热测应力的技术基础: 高精度多通道低功耗温度测量系统. 地震地质, 40(2): 499-510. |