地球辐射带中充满被地球磁场捕获的高能粒子,通常分为内带、外带以及二者之间的槽区.外辐射带(L=3~7)受太阳活动和地磁活动影响会出现高度动态变化(Xiang et al., 2017, 2018; Ma et al., 2020),而内辐射带(L<2)相对稳定.
在地磁活动剧烈的时候,槽区和内辐射带会被注入高能粒子(Baker et al., 2007),而地磁活动恢复平静时,槽区和内辐射带电子通量会缓慢衰减.多种空间波动被认为可以导致内辐射带和槽区高能电子损失,包括等离子体层嘶声、磁声波、闪电激发的哨声波和地面人工甚低频(VLF, Very Low Frequency)台站发射的信号(Imhof et al., 1983; Abel and Thorne, 1998; Clilverd et al., 2004; Sauvaud et al., 2008; Graf et al., 2009; Agapitov et al., 2014; Li et al., 2015; Ma et al., 2016, 2017; Ni et al., 2017, 2019; Gu et al., 2020; Green et al., 2020; Claudepierre et al., 2020; Xiang et al., 2020a, b; Albert et al., 2020; Hua et al., 2020, 2021).人工台站甚低频(VLF)信号频率范围大多在18~27 kHz,主要用于潜艇通信,台站站点通常覆盖很大的区域面积,具有平方公里的量级.对地面接收设备接收到的人工台站VLF信号进行分析,可研究太阳活动对电离层的扰动(Chen et al., 2016, 2017; 易娟等, 2019; Yi et al., 2020; Zhou et al., 2020).人工台站信号在沿着地球-低电离层波导传播的过程中,部分电磁波能量可以穿越电离层并泄露进入内磁层,在磁层中传播并与电子发生回旋共振,引起高能电子沉降,是导致辐射带高能电子缓慢损失的机制之一(Vampola and Kuck, 1978; Koons et al., 1981; Kulkarni et al., 2008; Ni et al., 2013, 2014; Ma et al., 2017; Meredith et al., 2019; Rose et al., 2019; Claudepierre et al., 2020; Albert et al., 2020; Fu et al., 2020; Cao et al., 2020).其中,位于澳大利亚的NWC台站(19.8 kHz)和位于北美的NAA台站(24 kHz)发射的信号,分别对内辐射带几百keV电子和几十keV的电子的沉降有明显影响(Inan et al., 1985; Clilverd and Horne, 1996; Gamble et al., 2008; Selesnick et al., 2013; Cunningham et al., 2020).集中分析这两个台站信号的空间分布,对于进一步分析人工VLF信号对辐射带电子的散射作用有重要意义.
Ma等(2017)使用范阿伦A星的数据统计了10~60 kHz的VLF信号在L=1~3的分布模型,发现VLF信号主要集中在10~30 kHz,在低L-shell(L<1.7),信号电场功率谱密度的峰值在19.8 kHz,而在高L-shell(1.7<L<3.0),信号电场功率谱密度的峰值在24 kHz.Meredith等(2019)使用范阿伦A星的数据分别统计了20多个人工VLF台站发射的信号在内磁层中随L*的分布模型,其中NWC,NAA和DHO38这三个台站的信号强度之和占总值的50%.可以看出NWC和NAA台站发射的信号在内磁层中相对较强,对高能电子的动态变化影响较大.
之前的研究并没有具体分析NWC和NAA这两个重要台站发射的信号在内磁层中的全球分布的具体特征及其对季节的依赖性,因此本文选择使用了范阿伦A、B双星的数据,利用卫星上EMFISIS(Electric and Magnetic Field Instrument Suite and Integrated Science)单元提供的高精度波动数据开展NWC和NAA台站发射的VLF信号在空间中分布的研究,细致分析了这两个台站的信号在内磁层中的空间分布、与季节和地磁活动等的依赖关系及其统计幅值的大小.
1 数据来源与处理2012年发射的专门探测地球辐射带的范阿伦双星,由A星和B星组成,两颗卫星有近似的运行轨道和相同的探测仪器.其运行轨道的倾角约为10°,近地点约为1.1RE,远地点约为5.8RE,轨道周期约为9 h,为统计研究人工VLF台站信号在磁层空间的分布提供了高质量观测数据.本文的工作使用了EMFISIS单元中的高频接收机(HFR, High Frequency Receiver)测量的高精度(burst mode)的空间电场数据.HFR能够提供10~487 kHz的电场观测结果,分为82个频率段.本文采用了如下的统计方法:将地理经度-180°~180°以1°为间隔均匀划分,负值代表西经,正值代表东经;将地理纬度-90°~90°以1°为间隔均匀划分,这样就形成了1°×1°的二维的经纬度网格.将台站频率对应频段的电场功率谱密度按采样时刻的经纬度划分到对应的网格中,在网格内统计数据点的个数并对电场功率谱密度做平均,分别作为该网格的采样点数和平均电场功率谱密度.MLT分辨率为1 h,L-shell分辨率为0.1.文中用到的L-shell是在IGRF+OP77Q模型下计算的,地磁指数来源于OMNIWeb数据中心(https://omniweb.gsfc.nasa.gov/form/dx1.html).
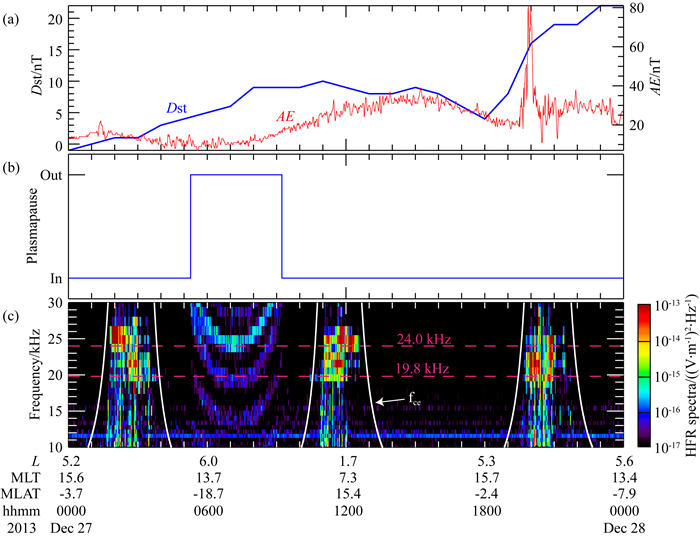
图 1给出了2013年12月27日范阿伦A星观测到的人工VLF台站信号示例图.图中从上到下分别是:Dst指数和AE指数、卫星位置在等离子体层顶内外的判断结果、HFR测量的电场功率谱密度.世界时、磁壳值(L-shell,磁力线在磁赤道处到地心的距离与地球半径的比值)、磁地方时(MLT)及磁纬度(MLAT)也被标注在图的下方.图 1a中蓝色曲线表示的是Dst指数,该段时间的Dst指数范围在0~20 nT,红色曲线表示的是AE指数,AE指数一直在100 nT以下,可见该段时间的地磁活动比较平静.在等离子体层顶以外,存在合声波的干扰(顾旭东等, 2017a, b; Meredith et al., 2019),因此,本文仅提取在等离子体层顶以内的人工台站VLF信号.图 1b展示的是判断卫星在等离子体层顶内外侧的结果,通过是否存在电子静电回旋波(ECH Wave, Electron Cyclotron Harmonic Wave)判定(项正等, 2017). 图 1c中,在世界时5时至9时HFR观测到了较弱的ECH波动,因此判断此时卫星位于等离子体层顶以外,该天其他时间位于等离子体层顶以内.图 1c展示的是该天HFR测量的10~30 kHz的电场功率谱密度,颜色表示电场功率谱密度的大小,单位是(V·m-1)2·Hz-1.图中白线标注出了电子回旋频率,红色虚线从上至下分别标注了NAA和NWC台站的发射频率,这两个台站及在这两个频率段中的其他台站的相关信息如表 1所示.本文将等离子体层顶以内NWC台站和NAA台站对应频率段的电场数据提取出来进行两个台站信号强度的统计分析.
|
图 1 2013年12月27日范阿伦A星观测到的NAA和NWC台站VLF信号示例图 Fig. 1 The example of NAA and NWC transmitter VLF signals measured by Van Allen Probe A on December 27, 2013 |
|
|
表 1 本文相关的台站信息表 Table 1 The information of the selected VLF transmitters |
使用第1节所介绍的方法,得到人工VLF台站信号2013-2018年的卫星观测数据库.本节主要统计分析NWC和NAA台站信号的全球分布规律,及其随昼夜、季节和地磁活动的变化.
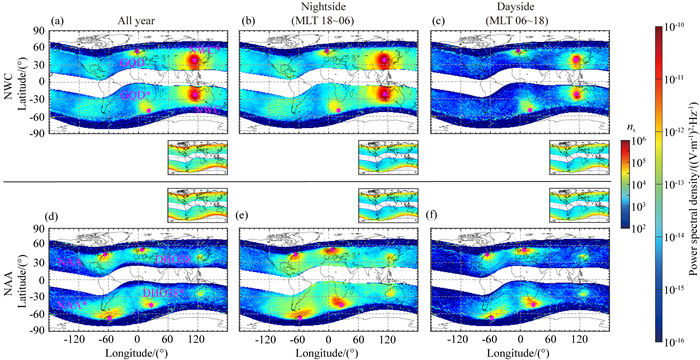
2.1 VLF信号随昼夜的分布规律图 2是2013年至2018年期间,卫星在不同的MLT区间观测到的NWC和NAA台站频率所在频率段的平均电场功率谱密度和采样点数随地理经纬度变化的统计结果,我们将赤道处的观测数据沿卫星所在的磁力线分别投影到南北半球的地面高度.较大的子图中颜色代表平均电场功率谱密度值的大小,对应长的颜色条;较小的子图中颜色代表较大子图中相应位置采样点数的多少,对应短的颜色条.从左至右分别为卫星全天、在夜侧时(18 ∶ 00~06 ∶ 00 MLT)和在日侧时(06 ∶ 00~18 ∶ 00 MLT)测量值的统计结果.从上至下分别是卫星观测到NWC和NAA等台站VLF信号的统计结果.为了避免采样点过少导致的结果异常,我们剔除了采样点数小于100的结果.
|
图 2 不同MLT区间内NWC(第一行)、NAA(第二行)台站信号的平均电场功率谱密度(大图)和采样点数(小图) 随地理经纬度变化的统计图,从左至右分别为全天、卫星在夜侧和卫星在日侧,其中数据沿卫星所在的磁力线分别投影到南北半球的地面高度处 Fig. 2 Statistical distribution of the average signal electric field power spectral densities (larger panels) and sample numbers (smaller panels) of NWC (top row) and NAA (bottom row) transmitter signals as a function of geographic latitudes and longitudes on different MLT sectors (from left to right: all MLT, on the nightside and on the dayside). Note that the wave power is mapped to the magnetic foot point of the satellite alone the field line |
在图 2a中,可以看到NWC台站位置和地磁共轭点的地方有两个明显电场功率谱密度峰值,分布在南北半球.这里的地磁共轭点是经过NWC台站位置的磁力线和北半球地表的交点.在两个明显峰值的左边还有一对较小强度的对称分布在南北半球峰值点,这是GQD台站的信号.NWC台站和GQD台站的位置及它们的共轭点都在图中做了标注.从图 2a可以看出,卫星观测到的VLF信号平均电场功率谱密度的形状为以NWC台站位置为中心的圆,峰值位于台站处,随着离台站的距离的增加而减弱,影响范围非常大.同时在GQD台站及其共轭点也能观测到较强的信号,但是相比于NWC台站的信号较弱,影响范围也较小.对比图 2b和c可以看出,夜侧的电场功率谱密度明显比日侧强,夜侧的强度约为日侧的6倍.这是由于日侧的太阳辐射较强,大气电离程度较高,电离层的电子密度较大,电磁波不容易逸出,故卫星观测到的信号强度小;而在夜侧则相反,日照弱,电离层电子密度低,VLF信号更容易穿透电离层进入磁层,因此卫星观测到的信号强度大.图 2d的特征与图 2a相同,也能看到两个明显的台站信号,从左至右分别为NAA台站和DHO38台站.DHO38台站的信号强度与NAA台站接近,覆盖的地理范围也接近.在图 2e和f中,平均电场功率谱密度的特征与NWC台站的相同,夜侧的电场功率谱密度明显强于日侧,峰值处夜侧约为日侧的3倍.图 2说明了不同台站VLF信号的强度和影响范围差异很大,NWC台站信号强度较大,主要集中在低纬度区域,NAA台站的信号在高纬度的强度较大,同时在日夜侧信号的分布强度也有显著区别.在图 2e和f中,能看到NAA和DHO38台站之外的另一对较小的峰值,其位置十分接近NWC台站,这是因为在一定条件下,NWC台站的信号会引起频谱的拓展,因此在高频段也能观测到(Xia et al., 2020).
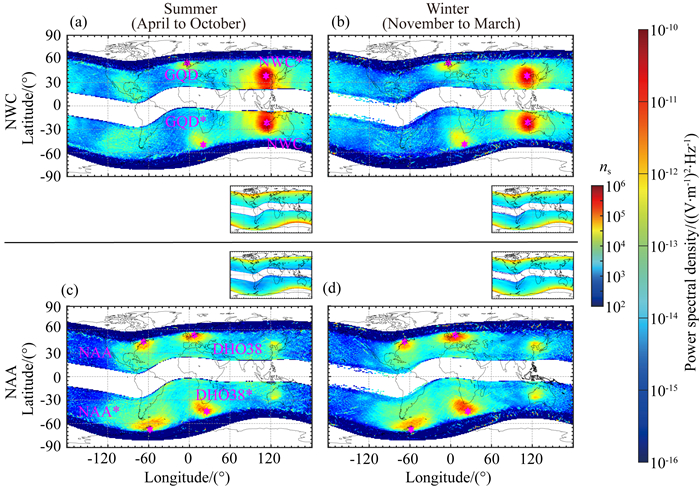
2.2 VLF信号随季节的分布规律图 3是不同季节的人工VLF台站信号电场功率谱密度和采样点数随地理经纬度变化的统计结果,格式与图 2相同.将每年4月到10月划分为北半球的夏季,11月到次年3月划分成北半球冬季(Ma et al., 2017).从左至右分别是夏季和冬季时卫星观测的VLF信号电场功率谱密度的统计结果.对比图 3a和b可以看出,NWC台站VLF信号夏季比冬季稍强,而GQD台站信号冬季比夏季稍强.这种现象的原因是:夏季时太阳辐射较强,大气电离程度较高,电子密度大,电磁信号逸出较少;冬季时太阳辐射较弱,大气电离程度较低,电子密度较小,电磁信号更容易逸出,卫星观测到的信号强度大.NWC台站在南半球,对应的冬季是北半球的夏季,因此夏季时观测到信号比冬季强.对比图 3c和d,因NAA台站和DHO38台站均在北半球,卫星在冬季时观测到的这两个台站的信号均略强于夏季.
|
图 3 不同季节的NWC、NAA台站信号平均电场功率谱密度和采样点数随地理经纬度变化的统计图 Fig. 3 Statistical distribution of the average signal electric field power spectral densities and sample numbers as a function of geographic latitude and longitudes in different seasons |
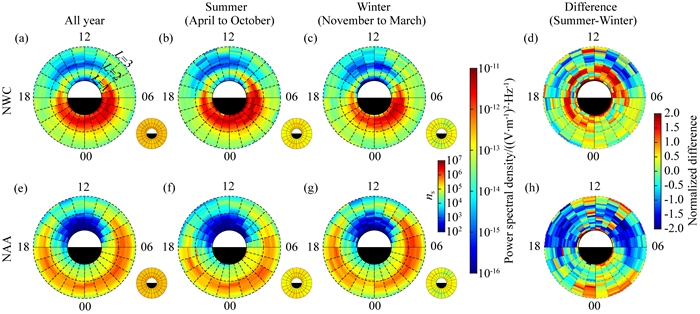
图 4是不同季节的NWC和NAA等台站信号平均电场功率谱密度和采样点数随MLT(00 ∶ 00~24 ∶ 00)、L-shell(1<L<3)变化的全球分布.从左至右分别是全年、夏季、冬季卫星观测的台站信号平均电场功率谱密度的统计结果,及夏季与冬季分布的归一化差分值;第一行是NWC等台站信号的统计结果,第二行是NAA等台站信号的统计结果.由图 3可以看出GQD台站在内磁层中的信号强度远小于NWC台站,对电子的通量影响作用很小;DHO38台站的发射频率与NAA台站的相近且地理位置也相近,可以将这两个台站发射的信号一起处理后进行后续的计算,所以统计结果中没有将GDQ和DHO38台站的信号剔除掉.图 4a-c和e-g中大圆的颜色表示电场功率谱密度的大小,对应于长的颜色条;小圆的颜色表示大圆中对应位置的取样点个数的多少,对应于短的颜色条.图 4d和h中子图的颜色表示夏季和冬季平均电场功率谱密度差值与平均值的比值,体现了夏季和冬季时平均电场功率谱密度的差异,公式如式(1)所示:

|
(1) |
|
图 4 不同季节的NWC(第一行)、NAA(第二行)台站信号平均电场功率谱密度(大图)和采样点数(小图) 随MLT和L-shell变化的统计图,从左至右分别是全年、夏季、冬季和夏季与冬季分布归一化差分 Fig. 4 Statistical distribution of the average signal electric field power spectral densities (larger panels) and sample numbers (smaller panels) of NWC (top row) and NAA (bottom row) transmitter signals as a function of MLT and L- shell in different seasons (from left to right: all year, summer, winter, and the normalized differences between the distributions in summer and winter) |
其中,PSDsummer表示夏季平均电场功率谱密度,PSDwinter表示冬季平均电场功率谱密度,通过值的大小可以看出夏季与冬季电场功率谱密度大小的差异.
在图 4a中,VLF信号主要集中在L<2的17 ∶ 00~09 ∶ 00 MLT区域,峰值出现在L=~1.4的22 ∶ 00~06 ∶ 00 MLT区域.在L>2,信号强度随着L-shell的增加而减弱.日侧的信号明显比夜侧弱,在11 ∶ 00~14 ∶ 00 MLT的信号最弱.对比图 4b和c可以看出,L<2的夏季的信号比冬季强,L>2无显著差别. 图 4d也展示了台站信号在L<2处季节差异更明显,夏季时台站信号强度相对于冬季更大. 由图 4e可以看到VLF信号主要集中在L=2~3的16 ∶ 00~09 ∶ 00 MLT区域,与图 4a相比,NAA等台站信号强度较弱,分布范围较大.对比图 4f和g可知,夏季时台站信号在23 ∶ 00~04 ∶ 00 MLT时较强,而冬季时信号峰值在03 ∶ 00~08 ∶ 00 MLT,且冬季的峰值强度较夏季时更大.
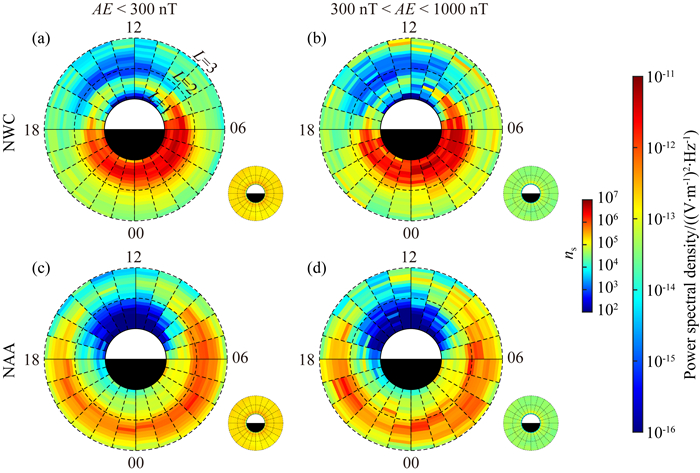
2.3 VLF信号随地磁活动的分布规律图 5是不同地磁活动条件下,卫星观测到的NWC、NAA等台站信号的平均电场功率谱密度和采样点数随MLT和L-shell变化的统计结果,格式与图 4相同.以AE指数表征不同的地磁活动条件,AE<300 nT、300 nT<AE<1000 nT和AE>1000 nT分别表征地磁活动平静、中等和活跃水平.从左至右分别是台站信号在不同地磁活动条件下的全球分布结果.图 5a和b中信号统计分布情况差异不明显,且与图 4a的结果相似;图 5d和e与图 4e的结果相似.当AE>1000 nT时采样点数较少,不满足统计条件,故不在图中展示.结果表明,台站信号的强度和分布与地磁活动相关性较弱.这是由于电离层电子密度对VLF人工台站信号影响较强,而在磁暴期间,电离层电子密度变化不明显,所以地磁活动对VLF人工台站信号影响较弱.
|
图 5 不同地磁活动条件下NWC、NAA台站信号平均电场功率谱密度随MLT和L变化的统计图,从左至右分别为:平静(AE<300 nT),中等(100 nT<AE<1000 nT) Fig. 5 Statistical distribution of the average signal electric field power spectral densities (larger panels) and sample numbers (smaller panels) of NWC (top row) and NAA (bottom row) transmitter signals as a function of MLT and L-shell for different levels of geomagnetic activity (from left to right: weak, AE < 300 nT; moderate, 100 nT < AE < 1000 nT) |
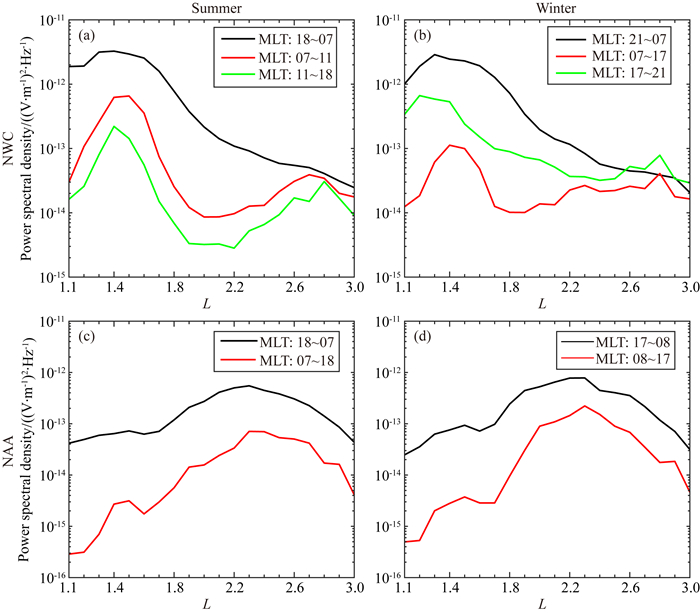
图 6展示了在不同的季节、不同的MLT范围内,台站信号平均电场功率谱密度随L变化的情况.从左至右分别对应的是夏季和冬季,第一行是NWC等台站信号的统计结果,第二行是NAA等台站信号的统计结果.横轴表示L-shell,范围为1.1~ 3.0,纵轴表示平均电场功率谱密度,不同颜色的曲线表示在不同MLT范围里平均电场功率谱密度随L-shell的变化情况,MLT是根据图 4中信号的强弱分布来划分的.图 6中可以看出,夜侧(18 ∶ 00~07 ∶ 00 MLT)的平均电场功率谱密度明显比日侧(07 ∶ 00~18 ∶ 00 MLT)强.图 6a和b中可以看出,不同的MLT,NWC台站信号的平均电场功率谱密度均在L=~1.4达到峰值;在L>1.4,平均电场功率谱密度随着L-shell的增加而减小.图 6c和d中可以看出,NAA台站的平均电场功率谱密度峰值在L=~2.3.从图 6可得,人工台站VLF信号在不同的MLT和L-shell范围处,平均电场功率谱密度差别较大,该统计模型可以提供在不同的MLT和L-shell处人工台站VLF信号强度信息.
|
图 6 不同季节和MLT区间内的NWC(第一行)、NAA(第二行)台站信号的平均电场功率谱密度随L-shell变化的曲线图,从左至右分别为夏季和冬季 Fig. 6 Average signal electric field power spectral densities as a function of L-shell for NWC (top row) and NAA (bottom row) VLF transmitter signals in summer (left panels) and winter (right panels) for the different MLT ranges |
本文利用从2013年1月至2018年12月范阿伦A、B双星的EMFISIS波动仪器高精度观测数据,对NWC和NAA两个重要人工台站发射的VLF信号平均电场功率谱密度在内磁层的时空分布特性进行了详细的统计分析,得到的主要结论如下:
(1) 人工台站VLF信号主要沿磁力线在地球内磁层传播,其平均电场功率谱密度与地理经纬度具有很强的相关性.在NWC、NAA、GQD、DHO38人工台站及其共轭点附近都可以观察到较强的VLF信号,并都具有一定的影响范围.其中,范阿伦探测卫星观测到的空间NWC台站信号电场功率谱密度最大,影响的地理范围最广.
(2) 不同人工台站VLF信号在内磁层中的L-shell和MLT分布不同,夜侧的电场强度明显强于日侧.NWC台站信号(19.8 kHz)集中分布在L<2.0、17 ∶ 00~08 ∶ 00 MLT的范围内,信号在北半球夏季比冬季有更强的幅值和更广的分布范围.NAA台站信号(24.0 kHz)主要分布在L=2~3、16 ∶ 00~09 ∶ 00 MLT的范围内,与NWC信号相比,该信号强度偏弱,但MLT分布范围更广.
(3) NWC和NAA人工台站VLF信号在不同的地磁活动条件下的时空分布的差异不明显,说明这两个人工台站信号在内磁层的分布变化受到地磁活动的影响较弱.
致谢 感谢范艾伦卫星团队提供的空间波动数据.
Abel B, Thorne R M. 1998. Electron scattering loss in Earth's inner magnetosphere: 2. Sensitivity to model parameters. Journal of Geophysical Research: Space Physics, 103(A2): 2397-2407. DOI:10.1029/97JA02920 |
Agapitov O V, Artemyev A V, Mourenas D, et al. 2014. Inner belt and slot region electron lifetimes and energization rates based on AKEBONO statistics of whistler waves. Journal of Geophysical Research: Space Physics, 119(4): 2876-2893. DOI:10.1002/2014JA019886 |
Albert J M, Starks M J, Selesnick R S, et al. 2020. VLF transmitters and lightning-generated whistlers: 2. Diffusion of radiation belt electrons. Journal of Geophysical Research: Space Physics, 125(3): e2019JA027030. DOI:10.1029/2019JA027030 |
Baker D N, Kanekal S G, Horne R B, et al. 2007. Low-altitude measurements of 2-6 MeV electron trapping lifetimes at 1.5 ≤ L ≤ 2.5. Geophysical Research Letters, 34(20): L20110. DOI:10.1029/2007GL031007 |
Cao X, Ni B B, Summers D, et al. 2020. Hot plasma effects on the pitch-angle scattering rates of radiation belt electrons due to plasmaspheric hiss. The Astrophysical Journal, 896(2): 118. DOI:10.3847/1538-4357/ab9107 |
Chen Y P, Yang G B, Ni B B, et al. 2016. Development of ground-based ELF/VLF receiver system in Wuhan and its first results. Advances in Space Research, 57(9): 1871-1880. DOI:10.1016/j.asr.2016.01.023 |
Chen Y P, Ni B B, Gu X D, et al. 2017. First observations of low latitude whistlers using WHU ELF/VLF receiver system. Science China-Technological Sciences, 60(1): 166-174. DOI:10.1007/s11431-016-6103-5 |
Claudepierre S G, Ma Q, Bortnik J, et al. 2020. Empirically estimated electron lifetimes in the Earth's radiation belts: Comparison with theory. Geophysical Research Letters, 47(3): e2019GL086056. DOI:10.1029/2019GL086056 |
Clilverd M A, Horne R B. 1996. Ground-based evidence of latitude-dependent cyclotron absorption of whistler mode signals originating from VLF transmitters. Journal of Geophysical Research: Space Physics, 101(A2): 2355-2367. DOI:10.1029/95JA03153 |
Clilverd M A, Rodger C J, Nunn D. 2004. Radiation belt electron precipitation fluxes associated with lightning. Journal of Geophysical Research: Space Physics, 109(A12): A12208. DOI:10.1029/2004JA010644 |
Cunningham G S, Botek E, Pierrard V, et al. 2020. Observation of high-energy electrons precipitated by NWC transmitter from PROBA-V low-Earth orbit satellite. Geophysical Research Letters, 47(16): e2020GL089077. DOI:10.1029/2020GL089077 |
Fu S, Yi J, Ni B B, et al. 2020. Combined scattering of radiation belt electrons by low-frequency hiss: Cyclotron, Landau, and bounce resonances. Geophysical Research Letters, 47(5): e2020GL086963. DOI:10.1029/2020GL086963 |
Gamble R J, Rodger C J, Clilverd M A, et al. 2008. Radiation belt electron precipitation by man-made VLF transmissions. Journal of Geophysical Research: Space Physics, 113(A10): A10211. DOI:10.1029/2008JA013369 |
Graf K L, Inan U S, Piddyachiy D, et al. 2009. DEMETER observations of transmitter-induced precipitation of inner radiation belt electrons. Journal of Geophysical Research: Space Physics, 114(A7): A07205. DOI:10.1029/2008JA013949 |
Green A, Li W, Ma Q, et al. 2020. Properties of lightning generated whistlers based on Van Allen Probes observations and their global effects on radiation belt electron loss. Geophysical Research Letters, 47(17): e2020GL089584. DOI:10.1029/2020GL089584 |
Gu X D, Yin Q, Ni B B, et al. 2017a. A statistical analysis of the global distribution of inner magnetospheric lower-band chorus waves based on Van Allen Probes EMFISIS observations. Chinese Journal of Geophysics (in Chinese), 60(4): 1249-1258. DOI:10.6038/cjg20170401 |
Gu X D, Yin Q, Zhou R X, et al. 2017b. A statistical analysis of the global distribution of inner magnetospheric upper-band chorus waves based on Van Allen Probes EMFISIS observations. Chinese Journal of Geophysics (in Chinese), 60(4): 1259-1267. DOI:10.6038/cjg20170402 |
Gu X D, Xia S J, Fu S, et al. 2020. Dynamic responses of radiation belt electron fluxes to magnetic storms and their correlations with magnetospheric plasma wave activities. The Astrophysical Journal, 891(2): 127. DOI:10.3847/1538-4357/ab71fc |
Hua M, Li W, Ni B B, et al. 2020. Very-Low-Frequency transmitters bifurcate energetic electron belt in near-earth space. Nature Communications, 11: 4847. DOI:10.1038/s41467-020-18545-y |
Hua M, Ni B B, Li W, et al. 2021. Statistical distribution of bifurcation of Earth's inner energetic electron belt at tens of keV. Geophysical Research Letters, 48(3): e2020GL091242. DOI:10.1029/2020GL091242 |
Imhof W L, Reagan J B, Voss H D, et al. 1983. Direct observation of radiation belt electrons precipitated by the controlled injection of VLF signals from a ground-based transmitter. Geophysical Research Letters, 10(4): 361-364. DOI:10.1029/GL010i004p00361 |
Inan U S, Chang H C, Helliwell R A, et al. 1985. Precipitation of radiation belt electrons by man-made waves: A comparison between theory and measurement. Journal of Geophysical Research: Space Physics, 90(A1): 359-369. DOI:10.1029/JA090iA01p00359 |
Koons H C, Edgar B C, Vampola A L. 1981. Precipitation of inner zone electrons by whistler mode waves from the VLF transmitters UMS and NWC. Journal of Geophysical Research: Space Physics, 86(A2): 640-648. DOI:10.1029/JA086iA02p00640 |
Kulkarni P, Inan U S, Bell T F, et al. 2008. Precipitation signatures of ground-based VLF transmitters. Journal of Geophysical Research: Space Physics, 113(A7): A07214. DOI:10.1029/2007JA012569 |
Li W, Ma Q, Thorne R M, et al. 2015. Statistical properties of plasmaspheric hiss derived from Van Allen Probes data and their effects on radiation belt electron dynamics. Journal of Geophysical Research: Space Physics, 120(5): 3393-3405. DOI:10.1002/2015JA021048 |
Ma Q, Mourenas D, Li W, et al. 2017. VLF waves from ground-based transmitters observed by the Van Allen Probes: Statistical model and effects on plasmaspheric electrons. Geophysical Research Letters, 44(13): 6483-6491. DOI:10.1002/2017GL073885 |
Ma Q L, Li W, Thorne R M, et al. 2016. Electron scattering by magnetosonic waves in the inner magnetosphere. Journal of Geophysical Research: Space Physics, 121(1): 274-285. DOI:10.1002/2015JA021992 |
Ma X, Xiang Z, Ni B B, et al. 2020. On the loss mechanisms of radiation belt electron dropouts during the 12 September 2014 geomagnetic storm. Earth and Planetary Physics, 4(6): 598-610. DOI:10.26464/epp2020060 |
Meredith N P, Horne R B, Clilverd M A, et al. 2019. An investigation of VLF transmitter wave power in the inner radiation belt and slot region. Journal of Geophysical Research: Space Physics, 124(7): 5246-5259. DOI:10.1029/2019JA026715 |
Ni B B, Bortnik J, Thorne R M, et al. 2013. Resonant scattering and resultant pitch angle evolution of relativistic electrons by plasmaspheric hiss. Journal of Geophysical Research: Space Physics, 118(12): 7740-7751. DOI:10.1002/2013JA019260 |
Ni B B, Li W, Thorne R M, et al. 2014. Resonant scattering of energetic electrons by unusual low-frequency hiss. Geophysical Research Letters, 41(6): 1854-1861. DOI:10.1002/2014GL059389 |
Ni B B, Hua M, Zhou R X, et al. 2017. Competition between outer zone electron scattering by plasmaspheric hiss and magnetosonic waves. Geophysical Research Letters, 44(8): 3465-3474. DOI:10.1002/2017GL072989 |
Ni B B, Huang H, Zhang W X, et al. 2019. Parametric sensitivity of the formation of reversed electron energy spectrum caused by plasmaspheric hiss. Geophysical Research Letters, 46(8): 4134-4143. DOI:10.1029/2019GL082032 |
Ross J P J, Meredith N P, Glauert S A, et al. 2019. Effects of VLF transmitter waves on the inner belt and slot region. Journal of Geophysical Research: Space Physics, 124(7): 5260-5277. DOI:10.1029/2019JA026716 |
Sauvaud J A, Maggiolo R, Jacquey C, et al. 2008. Radiation belt electron precipitation due to VLF transmitters: Satellite observations. Geophysical Research Letters, 35(9): L09101. DOI:10.1029/2008GL033194 |
Selesnick R S, Albert J M, Starks M J. 2013. Influence of a ground-based VLF radio transmitter on the inner electron radiation belt. Journal of Geophysical Research: Space Physics, 118(2): 628-635. DOI:10.1002/jgra.50095 |
Vampola A L, Kuck G A. 1978. Induced precipitation of inner zone electrons, 1. Observations. Journal of Geophysical Research: Space Physics, 83(A6): 2543-2551. DOI:10.1029/JA083iA06p02543 |
Xia Z Y, Chen L J, Zhima Z, et al. 2020. Spectral broadening of NWC transmitter signals in the ionosphere. Geophysical Research Letters, 47(13): e2020GL088103. DOI:10.1029/2020GL088103 |
Xiang Z, Tu W C, Li X L, et al. 2017. Understanding the mechanisms of radiation belt dropouts observed by Van Allen Probes. Journal of Geophysical Research: Space Physics, 122(10): 9858-9879. DOI:10.1002/2017JA024487 |
Xiang Z, Tan J Q, Ni B B, et al. 2017. A statistical analysis of the global distribution of plasmaspheric hiss based on Van Allen Probes wave observations. Acta Physica Sinica (in Chinese), 66(3): 039401. DOI:10.7498/aps.66.039401 |
Xiang Z, Tu W C, Ni B B, et al. 2018. A statistical survey of radiation belt dropouts observed by Van Allen Probes. Geophysical Research Letters, 45(16): 8035-8043. DOI:10.1029/2018GL078907 |
Xiang Z, Li X L, Temerin M A, et al. 2020a. On energetic electron dynamics during geomagnetic quiet times in Earth's inner radiation belt due to atmospheric collisional loss and CRAND as a source. Journal of Geophysical Research: Space Physics, 125(2): e2019JA027678. DOI:10.1029/2019JA027678 |
Xiang Z, Li X L, Ni B B, et al. 2020b. Dynamics of energetic electrons in the slot region during geomagnetically quiet times: Losses due to wave-particle interactions versus a source from cosmic ray albedo neutron decay (CRAND). Journal of Geophysical Research: Space Physics, 125(9): e2020JA028042. DOI:10.1029/2020JA028042 |
Yi J, Gu X D, Li Z P, et al. 2019. Modeling and analysis of NWC signal propagation amplitude based on LWPC and IRI models. Chinese Journal of Geophysics (in Chinese), 62(9): 3223-3234. DOI:10.6038/cjg2019N0190 |
Yi J, Gu X D, Cheng W, et al. 2020. A detailed investigation of low latitude tweek atmospherics observed by the WHU ELF/VLF receiver: 2. Occurrence features and associated ionospheric parameters. Earth and Planetary Physics, 4(3): 238-245. DOI:10.26464/epp2020023 |
Zhou R X, Gu X D, Yang K X, et al. 2020. A detailed investigation of low latitude tweek atmospherics observed by the WHU ELF/VLF receiver: 1. Automatic detection and analysis method. Earth and Planetary Physics, 4(2): 120-130. DOI:10.26464/epp2020018 |
顾旭东, 殷倩, 倪彬彬, 等. 2017a. 基于Van Allen Probes EMFISIS波动仪器观测的内磁层下频带哨声合声波全球分布的统计分析. 地球物理学报, 60(4): 1249-1258. DOI:10.6038/cjg20170401 |
顾旭东, 殷倩, 周若贤, 等. 2017b. 基于Van Allen Probes EMFISIS波动仪器观测的内磁层上频带哨声合声波全球分布的统计分析. 地球物理学报, 60(4): 1259-1267. DOI:10.6038/cjg20170402 |
项正, 谈家强, 倪彬彬, 等. 2017. 基于范阿伦卫星观测数据的等离子体层嘶声全球分布的统计分析. 物理学报, 66(3): 039401. DOI:10.7498/aps.66.039401 |
易娟, 顾旭东, 李志鹏, 等. 2019. 基于LWPC和IRI模型的NWC台站信号传播幅度建模分析. 地球物理学报, 62(9): 3223-3234. DOI:10.6038/cjg2019N0190 |
 2021, Vol. 64

