2. 重庆市地震局, 重庆 401147
2. Chongqing Earthquake Adminitration, Chongqing 401147, China
1976年7月28日在河北唐山发生的MS7.8巨大地震给国家和人民造成了巨大灾难.地震预报,特别是短临地震预报,可以显著减轻地震造成的人员伤亡和财产损失.但是,由于科技水平的局限性、对地震产生的成因以及震前观测到的一些异常现象的认识,还有待深入.至今,地震预报仍然难以实现.对已发生的强震进行解剖,深入研究强震发生前的异常现象,将有助于深化对地震孕育发生过程的认识,同时对推进地震预报深入研究也有裨益.唐山MS7.8地震发生之后,不少研究者对唐山地震前出现的地震学方面的异常进行了分析研究(朱传镇等, 1977, 1981;李全林等,1978;林怀存等,1987;钱兆霞,1988;薛艳和梅世蓉,1999;隗永刚等,2018;李赫等,2020),研究内容主要涉及区域地震活动图像、震群活动、b值、微震震源参数以及地震活动与地球自转的关系等.关于唐山地震前b值的研究,李全林等(1978)研究了唐山震区及其邻区b值随时间的变化,发现震前b值存在下降过程,同时还对京津唐渤张区域进行了b值空间扫描分析,发现低b值区由西向东迁移的过程.目前,在b值分析时,研究者们主要在两个方面开展工作:一个是特定时段的空间分布分析,另一个是选定空间范围内的时间变化分析.b值的空间分布可以反映各个地区b值的差异性,仅仅根据b值的空间分布难以辨别出某一地区b值随时间的变化情况.在b值的空间分布图上,常常出现b值高低区域交错分布,无规律可循,难以将其与地震孕育相联系.同样,在选定某空间范围进行b值随时间变化分析时,选取区域时没有合理的标准,具有任意性,难以保证所选取的区域完全包含了b值异常区,因而不能反映全部b值异常区的b值随时间的变化情况.假设地震发生前在震源附近的一个空间区域内存在b值异常变化,如果选取的空间范围位于这个空间区域以外,与地震孕育过程无关,这时,b值随时间的变化与地震的孕育之间难以建立有效的联系;如果选取的空间范围只是包含了这个空间区域的一部分,此时b值随时间的变化也不能全面反映地震的孕育过程.一些震例研究表明,地震发生前b值存在数月-数年的下降变化过程(Imoto, 1991; Jaumé et al., 1999; Enescu and Ito, 2001; Nuannin et al., 2005; Chan et al., 2012; Nanjo et al., 2012; 史海霞等, 2018).我们着眼于b值下降变化过程,通过格点搜索把b值下降变化的区域搜索出来,然后再分析这个区域内b值随时间的变化特征,就可以全面地揭示b值异常的空间分布和时间变化特征.本文将根据上述思路对唐山地震前的b值异常特征进行研究.
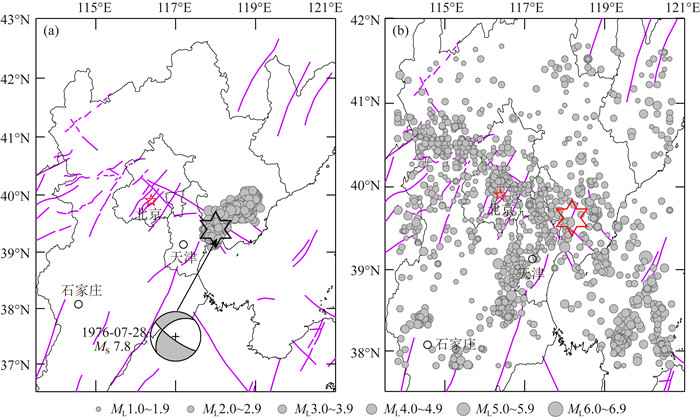
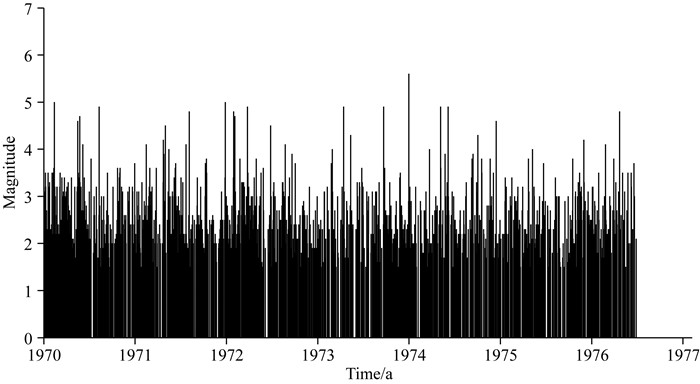
1 资料和研究区域图 1a给出了1976年唐山MS7.8地震及其余震的震中位置和研究区域,取图中所示的经纬度范围(37.5°N—42°N,113.5°E—121°E)为格点搜索范围,即研究区.这个区域显然远远大于唐山MS7.8地震余震分布区域.对研究区内于1970年1月—1976年6月期间发生的地震,根据G-R关系得到的地震目录完整性震级可达ML1.5. 因此,在本文分析中,选取研究区内1970年1月—1976年6月ML≥1.5的地震目录作为研究资料,共2214次地震.地震目录来自于中国台网中心汇编的全国小地震目录库.图 1b给出了这些地震的空间分布,其震级随时间的变化见图 2.
|
图 1 (a) 唐山MS7.8地震震中与余震分布, 灰色圆圈为余震分布;(b)选择的研究区域范围与1970年1月—1976年6月期间发生的地震(ML≥1.5)震中分布, 灰色圆圈为地震震中. 红色六角星为1976唐山MS7.8地震. 震源机制解来自于GCMT目录 Fig. 1 (a) Epicenters of the MS7.8 Tangshan mainshock and aftershocks. Grey circles are epicenters of aftershocks; (b) Study area and epicenters of earthquakes (ML≥1.5) that occurred from January 1970 to June 1976. Grey circles are epicenters. The red hexagram is the epicenter of the 1976 MS7.8 Tangshan mainshock. Focal mechanism solution is from the GCMT catalog |
|
图 2 ML≥1.5地震震级随时间变化 Fig. 2 Magnitude versus time for earthquakes (ML≥1.5) in study area |
采用极大似然法计算b值(Aki,1965):

|
(1) |
b值的95%置信度的标准差为

|
(2) |
其中,M和Mmin分别为给定地震事件样本的平均震级和最小震级,N为样本总数.
先将研究区域划分成0.1°×0.1°的格点,以每个格点为中心点,选取2°×2°的空间子区域,计算每个子区内地震的b值随时间的变化曲线.然后,挑选出震前b值呈明显下降变化形态的子区,并以该子区的中心点作为一个异常点,可以把多个异常点集中的区域看成是b值异常区.然后,选取这个异常区内的地震计算b值随时间的变化,这样就可以得到整个b值异常区的范围及其b值随时间变化的特征.
计算每个子区b值随时间的变化时,使用的是等事件数的样本窗口,将该窗口以相等事件数的增量进行滑动.因b值是一个统计量,一般会受样本量的影响,选取等事件数量的窗口,目的是为了确保分析结果不受样本大小差异的影响.
2.2 结果
对于每个子区,以100个地震计算b值,5个地震滑动,计算b值随时间的变化曲线.共计算了2392个子区的b值随时间的变化.有的子区b值个数较少,其时间变化曲线难以反映出可靠的b值变化信息.我们选取具有15个及以上b值数据的子区进行分析,共1747个子区.图 3a中给出了上述2392个计算了b值随时间变化的子区中心点位置,其中灰色圆点 


|
图 3
(a) b值时间变化的子区中心点位置分布. 灰色圆     |

|
图 4 随机选取的10个格点为中心点,2°×2°的空间子区域内地震的b值随时间的变化 图中竖直线“│”表示唐山MS7.8地震的发生时间.各子区域的中心点位置也在图中用经纬度标明.曲线末端的数字为区域的序号. Fig. 4 b values varying with time for 10 sub-regions of 2°×2° The vertical line"│" shows the original time of the Tangshan MS7.8 mainshock. The central location of each sub-region is indicated by latitude and longitude. Numbers at ends of curves are serial numbers of sub-regions. |
综上所述,唐山地震前在京—津—唐一带出现大面积b值下降异常,从1973年中到1974年10月,b值呈趋势下降变化形态.之后,直到临近地震发生时,b值稳定在低值,没有明显变化.在空间上异常面积较大,在时间上表现为先下降,然后维持在低值平稳变化,这就是唐山地震前b值的变化特征.
3 结论与讨论着眼于b值随时间变化过程中的下降变化形态,采用格点搜索法,将研究区域划分成0.1°×0.1°的格点,以每个格点为中心点,选取2°×2°的空间子区域,计算每个子区b值随时间的变化曲线.根据各子区b值随时间变化曲线,得到了唐山MS7.8地震前b值下降异常分布区域.b值下降异常集中分布在京—津—唐一带地区,位于(116°E—119°E,38.8°N—41°N)的经纬度范围内,所占面积大约为35000 km2.
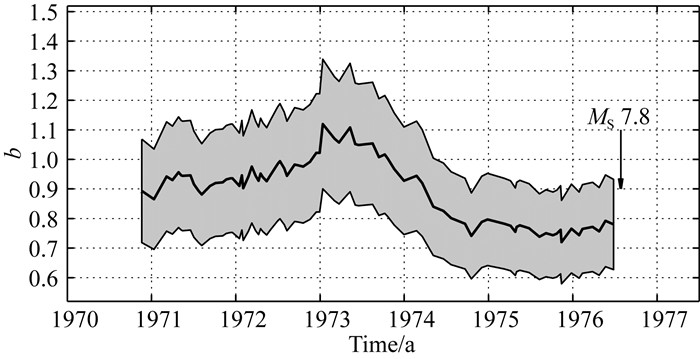
在b值下降异常区内,唐山MS7.8地震发生前b值大约从1973年6月到1974年10月经历了17个月的下降过程,从1.1降至0.72,相对下降幅度约为35%.从1974年11月—1976年6月的20个月中,b值一直维持在低值,没有明显变化.一般把余震分布区作为地震的破裂区,唐山地震的破裂区约占b值异常区内的26%.震前破裂区内发生的ML≥1.5总共111个,显然难以给出破裂区内可靠的b值随时间变化曲线来.
|
图 5 b值(黑色粗实线)随时间的变化 “↓”为唐山地震,灰色区域为95%置信度标准差范围. Fig. 5 b values (heavy black line) varying with time The downward arrow"↓" shows the original time of the Tangshan MS7.8 mainshock. The grey area indicates 95% confidence limit obtained from formula (2). |
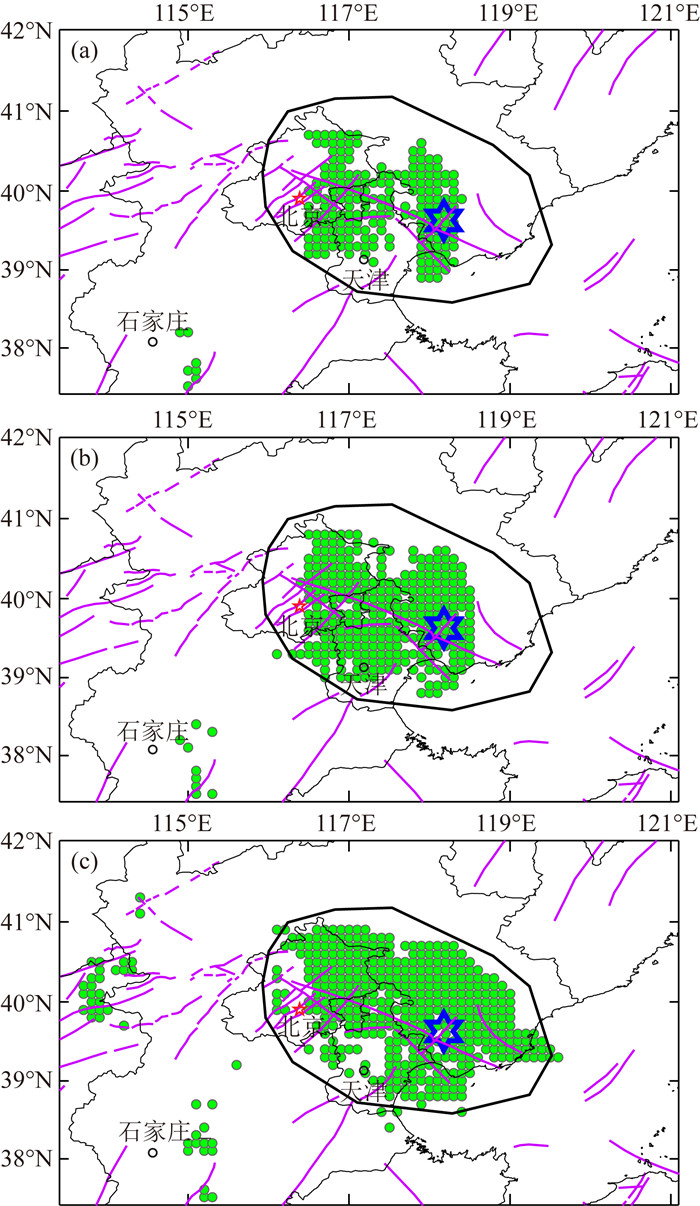
为了考察计算b值的地震个数的影响,分别以150、120和80个地震为一组计算b值,以5个地震滑动得到b值随时间的变化.以同样的挑选b值呈下降变化形态的子区的设定条件进行挑选,得到的b值呈下降变化形态的子区的中心点分布如图 6.当计算b值的地震个数增加时,满足挑选条件的子区数会减少,b值呈下降变化形态的子区的中心点也会有所减少;当计算b值的地震个数减少时,满足挑选条件的子区数会增多,b值呈下降变化形态的子区的中心点略有增加.总体上来讲,b值下降异常空间分布概貌没有本质的变化.
|
图 6 b值时间变化呈下降变化形态的子区中心点位置分布(绿色圆点) (a) 以150个地震为一组计算,以5个地震滑动;(b) 以120个地震为一组计算,以5个地震滑动;(c) 以80个地震为一组计算,以5个地震滑动.六角星为唐山地震震中. Fig. 6 Spatial distribution of centers (green circles) for the sub-regions with the decreae of b value (a) Sliding windows of 150 events shifted by 5 events once; (b) Sliding windows of 120 events shifted by 5 events once; (c) Sliding windows of 80 events shifted by 5 events once. The blue hexagram represents the epicenter of the Tangshan earthquake. |
b值变化除了与应力有关外,还与介质的均匀度和热梯度有关.应力增加,b值降低(Scholz,1968;Wyss,1973);介质越均匀,b值越低(Mogi, 1962);热梯度降低,b值也降低(Warren and Latham, 1970).一般认为强震发生前存在区域应力增强过程,所以认为震前几个月或几年的b值下降变化与应力有关,这更容易理解.2011年日本本州MW9.1地震前,震区b值自2005年起下降,一直持续至临近地震发生前(Nanjo et al., 2012).同期,视应力呈上升趋势变化(李艳娥和陈学忠,2011).即日本本州MW9.1地震前,视应力与b值呈反向变化,即负相关.视应力上升,同时b值下降.视应力与b值之间的负相关关系是构造应力增强的结果.因此,尽管缺乏唐山地震前视应力变化结果,但仍然可以把b值的下降过程理解为构造应力的增强.
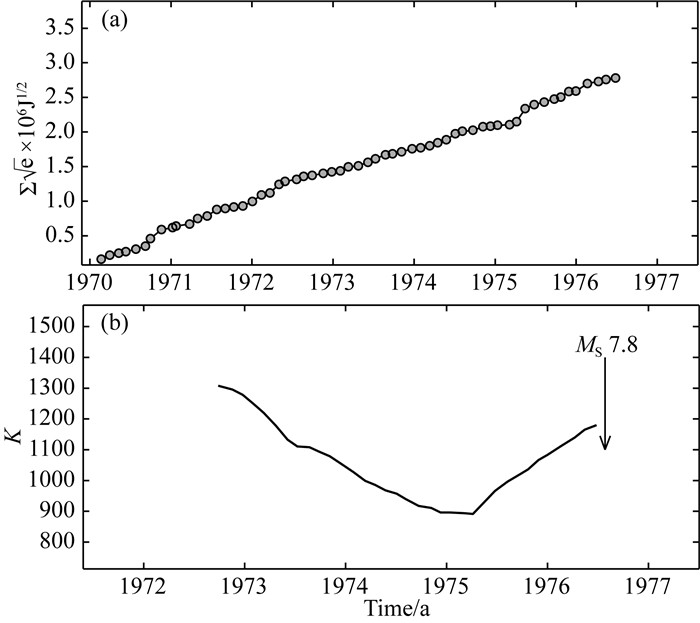
选取图 3b中黑色粗实线围成的区域内的地震,以40天为时间窗口统计地震的应变释放,然后将统计的应变释放进行累加,可以得到累积应变释放曲线,如图 7a.根据累积应变释放数据,以25个数据为窗口,1个数据滑动,通过直线拟合可以得到累积应变释放曲线的斜率K随时间的变化,如图 7b.对于应变减速释放,斜率K逐渐减小;对于应变加速释放,斜率K逐渐增大.图 7b中显示,1975年4月以前,K逐渐减小,应变释放是减速的;从1975年4月直到临近地震发生时,K逐渐增大,应变释放是加速的.当K逐渐增大时,b值维持在低值,没有明显变化. 因此,低b值条件下的应变释放加速可能更具有预测意义.
|
图 7 (a) 累积应变释放曲线;(b) 累积应变释放曲线斜率K随时间的变化.“↓”为唐山地震 Fig. 7 (a) Cumulative strain release curve; (b) The slope K of the cumulative strain release curve changing with time. The downward arrow "↓" shows the occurrence time of the Tangshan earthquake |
Aki K. 1965. Maximum likelihood estimate of b in the formula logN=a-bM and its confidence limits. Bulletin of Earthquake Research Institute of the University of Tokyo, 43: 237-239. |
Chan C H, Wu Y M, Tseng T L, et al. 2012. Spatial and temporal evolution of b-values before large earthquakes in Taiwan. Tectonophysics, 532-535: 215-222. DOI:10.1016/j.tecto.2012.02.004 |
Enescu B, Ito K. 2001. Some premonitory phenomena of the 1995 Hyogo-Ken Nanbu (Kobe) earthquake: seismicity, b-value and fractal dimension. Tectonophysics, 338(3-4): 297-314. DOI:10.1016/S0040-1951(01)00085-3 |
Imoto M. 1991. Changes in the magnitude-frequency b-value prior to large (M ≥ 6.0) earthquakes in Japan. Tectonophysics, 193(4): 311-325. DOI:10.1016/0040-1951(91)90340-X |
Jaumé S C, Sykes L R. 1999. Evolving towards a critical point: A review of accelerating seismic moment/energy release prior to large and great earthquakes. Pure and Applied Geophysics, 155(2): 279-305. |
Li H, Dong Y B, Wang Y X, et al. 2020. Discussion on the seismogenesis of Tangshan area: take the sequence of Fengnan M4.1 in 2010 and M4.5 in 2019 as an example. Progress in Geophysics (in Chinese), 35(4): 1276-1283. DOI:10.6038/pg2020EE0139 |
Li Q L, Chen J B, Yu L, et al. 1978. Time and space scanning of the b-value-a method for monitoring the development catastrophic earthquakes. Acta Geophysica Sinica (in Chinese), 21(2): 101-125. |
Li Y E, Chen X Z. 2017. Temporal and spatial variations of apparent stress in the rupture volume before and after the 2011 Tohoku, Japan, MW9.1 earthquake. Earthquake (in Chinese), 37(4): 10-21. |
Lin H C, Jiang H K. 1987. The characteristics of the change of theregional seismic migratory velocity before the MS7.8 Tangshan earthquake. Earthquake Research in China (in Chinese), 3(2): 78-82. |
Mogi K. 1962. Magnitude-frequency relation for elastic shocks accompanying fractures of various materials and some related problems in earthquakes. Bull. Earthquake Res. Inst. Univ. Tokyo, 40: 831-883. |
Nanjo K Z, Hirata N, Obara K, et al. 2012. Decade-scale decrease in b value prior to the M9-class 2011 Tohoku and 2004 Sumatra quakes. Geophysical Research Letters, 39(20): L20304. DOI:10.1029/2012GL052997 |
Nuannin P, Kulhanek O, Persson L. 2005. Spatial and temporal b value anomalies preceding the devastating off coast of NW Sumatra earthquake of December 26, 2004. Geophysical Research Letters, 32(11): L11307. DOI:10.1029/2005GL022679 |
Qian Z X. 1988. Variations of h-value and "earthquake situation window" before and after the strong earthquakes in the northern China area. Journal of Seismological Research (in Chinese), 11(3): 233-240. |
Scholz C H. 1968. Microfractures, aftershocks, and seismicity. Bulletin of the Seismological Society of America, 58(3): 1117-1130. |
Shi H X, Meng L Y, Zhang X M, et al. 2018. Decrease in b value prior to the Wenchuan earthquake (MS8.0). Chinese Journal of Geophysics (in Chinese), 61(5): 1874-1882. DOI:10.6038/cjg2018M0024 |
Warren N W, Latham G V. 1970. An experimental study of thermally induced microfracturing and its relation to volcanic seismicity. Journal of Geophysical Research, 75(23): 4455-4464. DOI:10.1029/JB075i023p04455 |
Wei Y G, Chen X Z, Li Y E. 2018. Relation between Earth's rotation and small earthquakes occurring before the MS7.8 Tangshan mainshock. Chinese Science Bulletin (in Chinese), 63(18): 1822-1828. DOI:10.1360/N972018-00140 |
Wyss M. 1973. Towards a physical understanding of the earthquake frequency distribution. Geophysical Journal International, 31(4): 341-359. DOI:10.1111/j.1365-246X.1973.tb06506.x |
Xue Y, Mei S Y. 1999. The spatio temporal evolution characteristics of general earthquake swarms and precursory swarms before and after the Tangshan earthquake. Earthquake (in Chinese), 19(2): 183-189. |
Zhu C Z, Fu C H, Luo S L. 1977. Source parameters for small earthquakes before and after the M=7.8 Tangshan earthquake. Acta Geophysica Sinica (in Chinese), 20(4): 264-269. |
Zhu C Z, Fu C H, Luo S L. 1981. Study of earthquake swarms in relation to large earthquakes (North China area). Acta Seismologica Sinica (in Chinese), 3(2): 105-117. |
李赫, 董一兵, 王熠熙, 等. 2020. 唐山地区地震成因初探-以丰南2010年M4.1和2019年M4.5地震序列为例. 地球物理学进展, 35(4): 1276-1283. DOI:10.6038/pg2020EE0139 |
李全林, 陈锦标, 于渌, 等. 1978. b值时空扫描-监视破坏性地震孕育过程的一种手段. 地球物理学报, 21(2): 101-125. |
李艳娥, 陈学忠. 2017. 2011年日本MW9.1地震前后破裂区内视应力时空变化. 地震, 37(4): 10-21. DOI:10.3969/j.issn.1000-3274.2017.04.002 |
林怀存, 蒋海昆. 1987. 唐山MS7.8地震前区域地震迁移"速率"变化特征. 中国地震, 3(2): 78-82. |
钱兆霞. 1988. 华北地区强震前后的h值及"震情窗口"变化. 地震研究, 11(3): 233-240. |
史海霞, 孟令媛, 张雪梅, 等. 2018. 汶川地震前的b值变化. 地球物理学报, 61(5): 1874-1882. DOI:10.6038/cjg2018M0024 |
隗永刚, 陈学忠, 李艳娥. 2018. 唐山MS7.8级地震前中小地震与地球自转的关系. 科学通报, 63(18): 1822-1828. DOI:10.1360/N972018-00140 |
薛艳, 梅世蓉. 1999. 唐山大震前后一般震群与前兆震群时空演化特征研究. 地震, 19(2): 183-189. |
朱传镇, 傅昌洪, 罗胜利. 1977. 唐山7.8级地震前后微震震源参数. 地球物理学报, 20(4): 264-269. |
朱传镇, 傅昌洪, 罗胜利. 1981. 震群与大地震关系的研究(华北地区). 地震学报, 3(2): 105-117. |
 2021, Vol. 64

