 2021, Vol. 64


地震发生过程中断层的破裂速度是控制地震波形态的重要因素,对于近场的强地面运动有显著的影响.随着观测记录的增多,在越来越多的地震中发现了超剪切传播的证据.已被发现出现超剪切破裂的地震包括1979年Imperial Valley地震(Archuleta, 1984),1999年Duzce地震(Bouchon et al., 2001),1999年Kocaeli地震(Bouchon et al., 2001),2001年昆仑山口西地震(Bouchon and Vallée, 2003),2002年Denali地震(Dunham and Archuleta, 2004),2010年玉树地震(Wang and Mori, 2012),以及2013年Craig地震(Yue et al., 2013)等.在超剪切破裂过程中,断层不同时刻辐射的剪切波互相干涉、叠加,形成马赫波,使得地震波振幅更大,辐射范围更广,往往造成更严重的地震灾害(Bernard and Baumont, 2005; Dunham and Archuleta, 2005; Dunham and Bhat, 2008).多数破坏性的地震往往都发生在几何形态复杂的断层系统上,由于断层空间延展尺度较大,断层的几何形状将会对破裂过程产生重要的影响(马瑾等,1996).研究复杂断层系统上的超剪切破裂转化的条件,对于震源过程的科学认识和防震减灾工作都具有重要的意义.
破裂传播速度是动态断裂力学关注的重要课题.早在实际实验室研究和野外观测研究开展之前,已经开展了很多理论和数值研究.Burridge(1973)首先从理论上分析了超剪切破裂传播的可能性,Andrews(1976)通过数值模拟证实了在满足滑动弱化摩擦准则(Ida, 1972; Palmer and Rice, 1973)的切平面问题中,当破裂尖端前的S波剪切应力所积累的能量克服摩擦阻力,能够在破裂尖端前产生子裂纹时,可以形成超剪切破裂,以
B-A机制是针对二维模型提出的,认为无量纲比值S临界值为1.77,只有满足一定的背景应力和摩擦条件时,才能够产生超剪切破裂(Andrews, 1985).针对三维均匀介质模型,Madariaga和Olsen(2000)提出了另一种无量纲化参数κ作为确定破裂速度的指标,定义为破裂应力释放能与断裂能之比,包含了更多破裂信息,适用于高应力场断层破裂情况;而S则需要小于更小的临界值1.19,才能触发超剪切破裂(Dunham, 2007).考虑包含地表的均匀半空间介质,S值大于1.19也产生超剪切破裂(Bizzarri, 2010; Bizzarri and Das, 2012; Zhang and Chen, 2006).Olsen等(1997)、Kaneko和Lapusta(2010)认为自由界面SV-P衍射波的相变转换所产生的附加应力场是超剪切破裂形成的主要原因,而走滑断层自由表面所诱发的超剪切破裂也可能会返回至次瑞利速度(Hu et al., 2019).即使不考虑自由界面的效应,三维全空间断层介质的非均匀性使得在不满足B-A机制所预测的背景应力水平下仍然有可能出现超剪切破裂(Passelègue et al., 2013),但也可能使得当背景预应力超过所预测的临界水平时仍然以亚瑞利波速稳定传播,无法出现超剪切破裂(Fukuyama and Madariaga, 2000).
影响超剪切破裂出现的复杂因素还包括,非成核区介质摩擦性质和背景预应力分布的不均匀性,以及断层几何形状的复杂性等.一般以包含障碍体(barrier)和凹凸体(asperity)的断层面的粗糙度和准静态裂缝表示非成核区介质摩擦性质和背景预应力的非均匀性.Fukuyama和Olesn(2002)研究了不同凹凸体宽度和不同背景预应力对超剪切破裂的影响,发现在一定条件下,含有凹凸体的非均匀介质相对于均匀介质,更容易激发超剪切破裂;对于宽度较小的凹凸体需要更高的背景预应力来触发超剪切破裂,当凹凸体宽度大于某一临界值后,所需要的背景预应力不再降低,保持稳定后仍然可以产生超剪切破裂.当非成核区存在准静态二次扩张裂缝时,根据B-A机制,二次裂缝将会受到主破裂前S波和P波应力场的影响开始破裂,当主破裂前锋与二次裂缝前端相遇时速度会突然超过剪切波速,转换成超剪切破裂(Liu and Lapusta, 2008).针对高剪切强度的障碍体,Dunham等(2003)提出在障碍体与成核区之间具有一定距离时,破裂前锋绕过障碍体,其产生的凹形聚焦效应能够使破裂传播速度迅速增加到超剪切状态.之后的研究发现障碍体诱导形成超剪切破裂需要满足一定的条件(Duan, 2012; Yang et al., 2012, 2013; Weng et al., 2015),障碍体埋深越浅、尺寸越大和强度越高, 越容易产生超剪切破裂,当障碍体位于自由界面,与成核区在自由界面上的距离大于一定长度时,能够扩大超剪切破裂的传播距离(Xu et al., 2016).当断层面本身大面积凹凸不平,粗糙度越大越容易产生局部超剪切破裂,但持续的超剪切往往出现在粗糙度相对中等的位置,过大的粗糙度会损耗能量,使超剪切破裂无法持续(Bruhat et al., 2016).
断层的几何形状是影响超剪切破裂产生的另一个重要因素.目前涉及到断层几何形状的研究主要集中于几种端元的复杂断层模型:阶跃断层、弯折断层和分叉断层.关于阶跃断层上超剪切破裂的影响因素研究较为完善,当满足一定范围内的断层间隔和足够长度的平行重叠距离后,阶跃位置的S值会发生变化降低到临界值之下,积蓄能量在次级断层上产生超剪切破裂(Kase and Kuge, 1998; Ryan and Oglesby, 2014; Hu et al., 2016; 袁杰和朱守彪,2017).因为弯折和分叉断层系统的复杂性,在数值模拟中相对较难实现,故而对其产生超剪切破裂的研究更加困难.Aochi等(2000a, b)基于边界积分方程法(BIEM)对简单弯折和分叉断层进行了数值模拟,发现当光滑弯曲断层面的最终角度为π/18时,破裂能够以超剪切速度传播,初始剪切应力和摩擦参数之间的关系对于简单分叉断层系统动态破裂传播的断层选择是最重要的,法向应力的变化通常较小.不同的弯折角度对破裂的传播和停止也有着重要影响(张丽芬等,2016).Kame等(2003)通过边界积分方法研究了二维分叉断层破裂速度影响条件,发现只有当分叉断层的S值从3突降到临界值以下的0.8时,才能在断层上产生超剪切破裂.因此对于弯折和分叉断层来说,B-A机制所提出的影响因素仍占据主导地位,针对不同形状的弯曲断层可能有着不同的临界状态.对于分叉断层系统,在一定条件下分叉间的相互作用也有可能使其中一支分叉断层产生超剪切破裂(Bhat et al., 2004).
目前有关复杂断层系统上的超剪切破裂的研究较少.本文将基于三维空间中非结构化的BIEM,针对不同弯折角度的弯折断层进行大量高效的数值模拟,在参数空间中通过破裂前锋传播图和破裂速度相图研究弯折断层的破裂速度变化,分析弯折断层的破裂行为和超剪切破裂的产生条件.
1 自发破裂模拟方法及破裂相图算法 1.1 边界积分方程方法(BIEM)本研究采用的自发破裂数值模拟方法为BIEM,它建立了断层应力与滑动速率的关系(Das and Aki, 1977; Aochi et al., 2000a, b):
|
(1) |
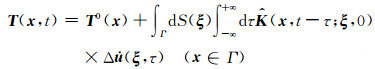
其中T(x, t)为接收点x在t时刻的应力,T0(x)为其初始应力,

|
(2) |
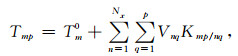
其中Nx为离散的断层单元总数,Tmp为第m个单元在p时刻的应力累积量,Vnq为第n个单元在q时刻的滑动速率,Kmp/nq为第n个单元在q时刻的滑动对第m个单元在p时刻的应力格林函数,称之为积分核,Tm0为第m个单元在一个时间步长内对自身的影响,即共位单元的影响.将时间离散化为间隔相等的时间序列,为了保证动力学破裂过程的稳定性,我们通过给定CFL值(Fukuyama and Madariaga, 1998)来决定时间步Δt的大小,CFL为介质纵波波速与时间步长和网格大小比值的乘积,是数值模拟中用于控制稳定性的参数,本文所有断层模型的数值模拟CFL均为0.98.
对于断层自发破裂过程而言,必须结合控制破裂行为的摩擦准则.常用的摩擦准则有滑动弱化摩擦准则(Ida, 1972)和速率-状态摩擦准则(Dieterich, 1979).对于同震破裂过程的模拟,通常采用滑动弱化摩擦准则:
|
(3) |
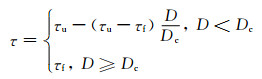
其中,τ是当前时刻单元的剪切应力值,τu和τf分别是破裂强度和残余应力,Dc为临界滑动弱化位移,D为当前时刻的单元累计滑动量.当断层单元上的剪切应力累积到了破裂强度时,单元开始破裂,其剪切应力随着滑动量线性减小,直至达到稳定滑动后保持不变的摩擦力.将BIEM和滑动弱化准则联立,给定初始应力后就可计算得到破裂过程.
1.2 破裂速度自动提取完整破裂相图的参数空间包含几千个破裂结果,需要逐个判断每个算例的破裂速度.为了提高效率,本文采用了适用于全空间均匀走滑断层模型的破裂速度自动提取方法,能够在破裂传播计算过程中得到算例的破裂速度,步骤如下:
(1) 图 1a中显示为绿色单元的成核区(初始破裂区域)近似为圆心坐标为(22.5, 7.5),半径为3 km的圆,根据成核区的位置,标记破裂前锋的中心点在断层上的传播路径中黄线所示,对路径上单元按照x方向坐标从小到大排列;

|
图 1 破裂速度拾取示意图 (a)平面断层模型,黄色高亮单元为破裂前锋中心点传播路径的网格单元, 绿色单元为成核区单元. (b)平面断层滑动速率时空分布,图中VP和VS两条白线分别代表P波和S波的传播速度,红圈为破裂前锋随时间变化的x方向位置,绿线为红圈的拟合线条,其斜率近似反映破裂的传播速度. Fig. 1 Illustration of the rupture speed picking (a) The planar fault model. The highlighted yellow elements are the grids on the propagation path of the midpoint of the rupture front, the green element is a grid inside the nucleation zone. (b) The spatiotemporal evolution of the slip velocity of the planar fault model. The white lines denote the reference P and S wave velocity respectively. The red circles are the locations of rupture fronts along the fault varying with time, whereas the slope of the fitted connecting green line approximates the rupture propagation speed. |
(2) 在算例计算过程的每个时间步循环内,对步骤1中已排序的传播路径单元的滑动速率值进行自动筛选,找到成核区沿传播方向上滑动速率降为0的最小x坐标单元,即破裂前锋对应单元,并记录时间及该单元x方向坐标,用图 1b中的红圈标记;
(3) 每隔一定时间间隔对步骤2中记录单元的坐标和时间进行x-t线性拟合,拟合结果可示意为图 1b中红圈拟合的绿线,计算拟合线的斜率得到破裂传播速度,当破裂的时间循环计算结束时就可自动得到一系列实时变化的破裂速度.
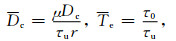
1.3 平面断层的相图对比为了检验破裂速度自动拾取方案的正确性,我们使用与Xu等(2015)近似相同的参数(表 1)和相同的无量纲化公式(4)计算得到平面断层破裂相图:
|
(4) |
|
|
表 1 平面断层模型参数 Table 1 Parameters of the planar fault models |
其中:剪切模量μ=ρVS2,其余参数如表 1所示.0~0.2区间内Dc过小,导致计算结果不可靠,故整体在破裂相图中以灰色表示,不探究其破裂行为.本研究中积分核是基于全空间介质模型计算得出的,所有的模型均为全空间下的走滑断层模型.
图 2显示了本文与前人的平面断层破裂相图,对比发现平面断层破裂相图整体趋势相同,验证了破裂过程自动拾取的正确性.

|
图 2 平面断层破裂相图 左(本文),右(Xu et al., 2015).0~0.2区间内Dc过小,导致计算结果不可靠,故整体在破裂相图中以灰色表示,Supershear区域表示算例为超剪切破裂,SubRayleigh区域表示算例破裂速度为亚瑞利波速,Self-arresting区域表示算例破裂未持续传播自发停止. Fig. 2 Phase diagram of rupture on a planar fault (Left) Result in this study, and (right) that in Xu et al. (2015). Since the small Dc value in the range 0~0.2 would produce unreliable results, this part of parameter space is shaded by gray. Region in which super-shear ruptures occur is marked in "Supershear". Rupture speed below Rayleigh wave speed, "SubRayleigh", and rupture ceases spontaneously, "Self-arresting". |
利用前面所描述的方法,本文分别对弯折角度为15°、25°和40°的弯折断层模型进行破裂相图计算.弯折断层模型如图 3所示,断层模型从x方向45 km处开始弯折,整个断层模型由平面部分15 km×45 km的矩形平面和弯折平面部分为15 km×15 km的正方形平面以弯折角α拼接而成,成核区位于矩形平面的中央.

|
图 3 弯折角α=15°的弯折断层模型 黄色三角形单元为图 6所取弯折面上靠近弯折交界线单元. Fig. 3 The fault model with a bending angle α 15° The highlighted yellow triangle element is the grid on the bending plane chosen in Fig. 6 that is close to the bending boundary. |
弯折断层模型考虑了剩余应力的影响,因此仅将Te的无量纲化公式改为:

|
(5) |
其中:τa=σ33(μs-μd),σ33为弯折断层平面部分初始正应力.
弯折断层模型的P波速度VP,S波速度VS,密度ρ和静摩擦系数μs的取值与表 1相同.其余参数如表 2所示.由于重点是观察弯折断层上破裂速度随Dc和Te变化的情况,因此本文除用于变化的参数外,弯折断层破裂算例都采用一致的介质参数和应力参数设置.
|
|
表 2 弯折断层模型参数 Table 2 Parameters of the fault models with a bending angle |
弯折断层模型Dc变化范围从0.025~1.025,由1.15τa≈τu,所以Te变化范围从0.01~1.15.图 4中相图以Dc和Te为横纵坐标的参数空间为41×39,即每个相图包含1599个破裂算例.图 3a、b、c分别为15°,25°和40°的弯折断层模型下的破裂相图,展示了破裂传播速度在(Dc, Te)参数空间中的变化规律.图中A1—I6所圈参数的算例依次对应图 6相同编号的子图,展示图 6所取算例在相图中的位置.

|
图 4 弯折断层破裂相图对比图 (a)、(b)、(c)分别为弯折角α=15°,25°和40°的结果.绿色虚线Ⅰ为自发停止破裂和亚瑞利破裂之间的分界线,蓝色虚线Ⅱ为亚瑞利破裂和超剪切破裂之间的分界线,Sub-Rayleigh 1代表算例破裂速度为亚瑞利波速且破裂未传播至弯折面,Sub-Rayleigh 2代表破裂速度接近但不超过剪切波速的算例,图中A1—I6所圈参数的算例依次对应图 6相同编号的子图. Fig. 4 Comparison of phase diagrams of rupture on faults with different bending angles (a), (b) and (c) are results with the bending angle of 15°, 25° and 40°, respectively. The dashed green line Ⅰ separates the Self-arresting and SubRayleigh. The dashed blue line Ⅱ separates the SubRayleigh and Supershear. Examples marked in "SubRayleigh 1" represent ruptures whose speed are below the Rayleigh wave speed. Examples marked in "SubRayleigh 2" represent ruptures whose speed are approaching, but not beyond the shear wave velocity. The examples circled and annotated with A1—I6 correspond to each subplot in order in Fig. 6. |

|
图 6 15°、25°和40°弯折断层Dc分别取0.35, 0.70和0.93时的滑动速率时空分布组图 每个子图代表一种参数组合下结果,子图左下角所标序号对应着图 4相应相图中所标的序号,红圈代表破裂前锋,为了方便判断破裂前锋的速度,标出了P波和S波速度.破裂算例对应参数以(Dc, Te)标注在白色括号内,白色虚线为弯折交界线x=45 km的标记. Fig. 6 The selected spatiotemporal evolution of slip velocity in 15°-, 25°- and 40°- bending fault when Dc is 0.35, 0.70 and 0.93, respectively Each subplot represents the result under specific combination of parameters which is marked in white brackets as (Dc, Te). The sequential number at the lower left corner of each subplot is the same as that in Fig. 4. Red circles denote the rupture front. P and S wave velocities are illustrated for reference. The white dashed line marks the location of bending boundary (x=45 km). |
观察三个破裂相图的自发停止破裂、亚瑞利破裂和超剪切破裂之间的两条分界线Ⅰ和Ⅱ可以看出,自发停止破裂区域范围在三个不同角度的弯折断层相图中完全一致,不受弯折角度改变影响;而三个相图中分界线Ⅱ的不同,则显示当破裂能够稳定传播时,弯折面的角度对破裂速度有明显影响.随着弯折角度增加,超剪切区域范围减小,亚瑞利破裂范围增大,15°与25°弯折断层破裂相图的差异较小,弯折角度为40°时亚瑞利波破裂范围明显增加,且超剪切破裂边界线变化趋势与平面破裂相图较为相似.
对于分界线Ⅱ,分别固定Dc和Te,可看出Dc越小和Te越大时破裂速度越大,越容易形成超剪切破裂.15°与25°弯折角度较小的断层模型里,此条分界线变化趋势为两段:Dc < 0.9时,随着Dc和Te的增大,边界线整体为一条斜率大于0小于1的圆滑线条,意味着超剪切破裂区域缓慢减少,亚瑞利波区域缓慢增加,Te增加的速度小于Dc增加的速度也能够触发超剪切破裂;Dc>0.9时,边界线斜率陡增并在Dc=1时斜率为0,意味着在Dc较大时需要更大的Te才能够破裂,且在Dc大于某一数值时,破裂只有在Te较大时才能离开自发停止状态,开始传播并发展成为超剪切破裂.
对于弯折角较大的40°弯折断层模型,Dc < 0.9时,分界线Ⅱ分为两段,在0.2~0.48段斜率为正值,0.48~0.9段斜率为0,且发生超剪切破裂所需的Te比15°和25°的破裂相图大,说明40°时的破裂更难形成超剪切破裂;Dc>0.9时,相图形态与较小弯折角度的破裂相图形态一致,对于Dc和Te大于某一值时,破裂速度不受弯折角度影响.
图 5a、b、c分别为平面初始正应力(σ33, σ11)设置为(-10, -26) MPa,(-10, -15) MPa, (-10, -10) MPa的不同弯折面应力莫尔圆示意图,每张子图展示了给定同一平面初始应力时,不同弯折角的断层面初始应力和S.可以看出初始状态下对于15°、25°和40°弯折断层面,α越小的断层面越靠近破裂线τp,参数S越小,意味着破裂越容易传播,也就越容易产生超剪切破裂.图 5a为图 4相图初始应力设置,与图 4的弯折角越小超剪切破裂区域越大规律一致.三幅子图中图 5a即本文所采用应力设置,初始状态下各个弯折面对应S值最小,作为对照组的图 5b、c的应力设置使得平面和弯折断层在莫尔圆上位置整体左移,逐渐偏离破裂线.

|
图 5 断层面不同初始正应力莫尔圆示意图 (a)、(b)、(c)分别为平面初始正应力(σ33, σ11)设置为(-10, -26) MPa,(-10, -15) MPa, (-10, -10) MPa的不同弯折面应力莫尔圆示意图,三个弯折模型除弯折角α外的其他参数相同,所取Te为0.85,S=(τp-τo)/(τo-τr),τp为破裂强度,τo为初始剪应力,τr为剩余剪应力,σn为正应力.图中弯折角α=0°的灰色正方形所标记的横纵坐标展示平面断层的初始正应力和剪应力,其他形状标记对应了不同弯折角的弯折面初始正应力和剪应力. Fig. 5 Diagram of Mohr′s circle under different initial normal stresses on the fault model The planar initial normal stress (σ33, σ11) for the Mohr′s circle diagram (a), (b) and (c) are set to be (-10, -26) MPa, (-10, -15) MPa and (-10, -10) MPa, respectively. All parameters but the bending angle α are the same for three models. Te is set to be 0.85 and the ratio S=(τp-τo)/(τo-τr), where τp is the rupture strength, τo is the initial shear stress, τr is the residual shear stress, and σn is the normal stress. The case α=0° is denoted by the gray square, whose horizontal and vertical coordinate represent the initial normal stress and shear stress on the planar part, respectively. Other symbols correspond to the initial normal stress and shear stress on the bending part, with different bending angles. |
图 6为图 4中用圆圈所标出的参数对应算例的滑动速率的时间空间分布图,图中破裂前锋斜率越小,破裂传播速度越大,能够更为直观地显示不同破裂的传播速度随着参数Dc和Te的变化.所选取的算例在图 4中以子图序号的形式标注出来,每个Dc选取了依次递增的6个Te,能够较为完整地展示相图中所包含的破裂过程相关信息,子图中白色虚线可判断破裂是否传播至弯折面.
图 6显示,当Te较小,破裂未传播至弯折面时,如Te=0.31,相同弯折角的结果中,Dc越大,破裂越难形成,破裂传播速度越小;不同弯折角的结果中,当Dc相同时,破裂传播行为不受角度影响,破裂传播速度相同.当Te较大,破裂传播至弯折面上时,如Te=0.85,相同弯折角的结果中,Dc越大,破裂传播速度越小;不同弯折角的结果中,对于相同Dc的情况,平面部分破裂传播速度相同,弯折角度越大,破裂传播速度越小.
综上所述,当弯折角相同时,Dc越大,破裂越难形成,破裂传播速度越小;当弯折角不同时,相同参数下,平面部分破裂传播速度相同,弯折部分弯折角度越大,破裂传播速度越小.
考察弯折面上的破裂传播情况,对于25°弯折模型,序号为E5、E6和F6子图的滑动速率在弯折交界线(白色虚线)处沿纵轴(时间)方向发生错动,即在弯折交界线处破裂延迟传播,发生延迟效应,Dc越大,弯折交界线处延迟时间越长,延迟效应越明显.15°弯折模型中延迟不明显.
在图 6中同一行算例所取Dc相同,Te从左到右增加,初始剪切应力增大,破裂传播速度依次增大,破裂状态从自发停止过渡到超剪切破裂.可以看出15°和25°弯折模型下随着Te的增大,最终都能在弯折面上形成超剪切破裂,且弯折面上的滑动速率相比平面部分有明显增大;但是对于较大弯折角的40°的情况,随着Te的增大,最终只能在平面部分形成超剪切破裂,无法在弯折面上传播,且平面部分的破裂传播速度与其他弯折角情况下的相同.根据图 6最后一列可以看出,对于相同参数组合设置,随弯折角增大,弯折面上破裂传播速度减小,直至40°时无法在弯折面传播.这种规律为图 5a所设初始正应力(-10, -26) MPa下所得,考察初始正应力不同时弯折面上破裂传播随弯折角的变化,以图 5b所设初始正应力(-10, -15) MPa为例,选取该应力下一组(Dc, Te)为(0.70, 0.85)算例来分析,参数组合选取原则是保证三种弯折角状态下任一弯折角破裂可以传播至弯折面,能够比较明显展示破裂速度的变化.通过图 7a、b、c对比可以看出,同种的应力设置和参数组合,改变后的初始应力状态下仍然存在随弯折角增大,弯折面上破裂传播速度减小,直至40°时无法在弯折面传播.

|
图 7 弯折断层相同初始正应力的滑动速率时空分布对比图 (a)、(b)、(c)分别为平面初始正应力(σ33, σ11)设置为(-10, -15) MPa的弯折角α=15°,25°和40°的弯折断层滑动速率时空分布图,子图所取(Dc, Te)为(0.70, 0.85),图中VP和VS两条白线分别代表P波和S波的传播速度,红圈示意为破裂前锋随时间的变化趋势,绿线为红圈的拟合线条,其斜率近似反映破裂的传播速度. Fig. 7 Comparison of the spatiotemporal evolution of slip velocity under the same initial normal stresses on the bending fault model The planar initial normal stress (σ33, σ11) for the spatiotemporal evolution of slip velocity on the model with a bending angle of 15°, 25° and 40° are set to be (-10, -15) MPa, respectively. The parameters (Dc, Te) for the subfigures are (0.70, 0.85), respectively. The white lines denote the reference P and S wave velocity, respectively. The red circles are the locations of rupture fronts along the fault varying with time, whereas the slope of the fitted connecting green line approximates the rupture propagation speed. |
在图 3所示的模型中,当弯折面相对于平面的弯折角度大于0°(向上弯折),弯折面处于压缩区(Barka and Kadinsky-Cade, 1988; Poliakov et al., 2002).为了进一步探究弯折角40°时破裂无法越过弯折分界线继续传播的原因,并验证在弯折分界线上发生的错位延迟效应,我们选取了如图 3所示的该分界线附近的一个黄色单元,考察此单元上不同初始应力状态下在三种弯折角度断层模型的应力随时间的变化,如图 8所示.并将(Dc, Te)设置为(0.70, 0.85),使得在弯折面上能出现超剪切破裂,图 8a、b、c的初始应力状态与图 5a、b、c分别对应,可以看到图 8每个子图中随着弯折角度的增加,弯折面上的初始正应力也相应地增大.破裂强度与剪切应力差值也随着角度增大而增大,单元发生破裂难度随之增大.当破裂仅在平面传播时,此单元上的正应力和剪应力都保持不变,当将要传播至弯折面时随着时间增加,三个模型下正应力都有明显增大,剪应力也有一定程度的增加,因此Te-Tu随之增大.随着时间继续增加,只有15°和25°弯折模型下Te-Tu能够为0,剪应力达到破裂强度从而破裂.25°断层模型下发生破裂时间晚于15°,对应于图 5中显示的延迟效应,破裂后Te-Tu急速下降,释放能量;而40°断层模型时初始正应力大,弯折交界线处正应力增幅较大,剪应力一直无法克服动态破裂强度.可看出弯折面正应力过大是40°弯折断层无论在何种参数设置下都无法传播至弯折面的原因.对于三种不同初始应力设置,虽在莫尔圆上初始位置不同,S值不同,但弯折面上单元对于每一种应力设置下,随弯折角度增加,正应力越大,破裂强度越大,破裂越难越过弯折交界线继续传播(如40°).

|
图 8 弯折面上交界线附近一个单元的不同弯折角度断层模型应力时间演化对比图 (a)、(b)、(c)分别为平面初始正应力(σ33, σ11)设置为(-10, -26) MPa,(-10, -15) MPa, (-10, -10) MPa的不同弯折角度断层模型应力时间演化对比图.每个子图中三个弯折模型算例除弯折角度外的其他参数相同,(Dc, Te)为(0.70, 0.85),Te为剪切应力,Tu为破裂强度,N为正应力. Fig. 8 Comparison of the temporal variation of stress at one element grid close to the bending line on the fault model with different bending angles (a), (b) and (c) correspond to the comparison of the temporal variation of stress on the fault model with different bending angles when the planar initial normal stress (σ33, σ11) are set to be (-10, -26) MPa, (-10, -15) MPa and (-10, -10) MPa, respectively. All parameters but bending angles are the same for three subfigures. (Dc, Te) is (0.70, 0.85), where Te, Tu and N are the shear stress, the fracture strength and the normal stress, respectively. |
本文在非结构化网格的BIEM基础上针对不同弯折角的弯折断层模型进行了大量数值模拟,围绕无量纲化的Dc和Te两个变化参数,得到了不同弯折模型的破裂速度相图,与前人平面断层破裂相图的对比验证了破裂相图算法的正确性和可行性.
对不同弯折角度的相图和选定参数组合下的滑动速率时空图分析,可以发现对于本文所设应力条件下弯折面处于压缩区(α>0)的弯折断层模型,有以下结论:
(1) 弯折角度对于无法持续传播的自发停止破裂没有影响,相图中自发停止破裂区域所占参数空间完全相同;
(2) 对于可持续传播破裂,在Dc和Te相同,破裂在弯折断层面上传播时,弯折角度越大,破裂的传播速度越小.并且,弯折面交界线处的正应力增大,导致破裂强度也增大,当弯折角度增加到一定程度时,如40°的情况,无论Dc和e参数如何变化,破裂都不能在弯折面上传播.同时在平面断层部分的破裂传播速度相同,不受弯折角度的影响;
(3) 体现在相图上,15°和25°的超剪切区域明显比40°的大,即破裂能够越过弯折交界线在弯折面上继续传播时,更容易形成超剪切破裂;15°的超剪切区域又略大于25°,即弯折角越小,越容易形成超剪切破裂;
(4) 对初始剪应力较小的情况,超剪切破裂更容易在弯折面上形成,而当初始剪应力较大时,超剪切破裂在平面上就可形成;
(5) 对于可持续破裂,不同弯折角度的相图有所差异.但整体上当Dc较小和Te较大时,破裂传播速度更大,更容易形成超剪切破裂,这与平面断层的情况下的结论是一致的(Xu et al., 2015).
根据滑动速率时空分布图,可以直观地分析破裂传播速度和滑动速率的变化,当破裂传播至弯折面上时,需要克服弯折交界线上的正应力,从而破裂前锋在交界线处出现错位延迟效应,同时在弯折面上的滑动速率相对于平面断层有了明显的增大.弯折角度越大,需要克服的时间越长,延迟效应越明显.
本文考虑的全空间弯折断层模型,包括平面部分和相对弯折部分,破裂成核区设在平面断层,弯折断层部分位于平面断层的压缩区,这只是比平面断层稍复杂一点的断层系统,本文进行了该类断层系统的破裂行为研究的初步尝试.对于其他类型的复杂断层,比如分叉断层,甚至更为复杂的断层系统,其破裂行为的控制因素将更为复杂,这将在进一步的研究中予以考虑.
Andrews D J. 1976. Rupture velocity of plane strain shear cracks. Journal of Geophysical Research, 81(32): 5679-5687. |
Andrews D J. 1985. Dynamic plane-strain shear rupture with a slip-weakening friction law calculated by a boundary integral method. Bulletin of the Seismological Society of America, 75(1): 1-21. |
Aochi H, Fukuyama E, Matsu'ura M. 2000a. Spontaneous rupture propagation on a non-planar fault in 3-D elastic medium. Pure and Applied Geophysics, 157(11-12): 2003-2027. |
Aochi H, Fukuyama E, Matsu'ura M. 2000b. Selectivity of spontaneous rupture propagation on a branched fault. Geophysical Research Letters, 27(22): 3635-3638. |
Archuleta R J. 1984. A faulting model for the 1979 Imperial Valley earthquake. Journal of Geophysical Research:Solid Earth, 89(B6): 4559-4585. |
Barka A A, Kadinsky-Cade K. 1988. Strike-slip fault geometry in Turkey and its influence on earthquake activity. Tectonics, 7(3): 663-684. |
Bernard P, Baumont D. 2005. Shear Mach wave characterization for kinematic fault rupture models with constant supershear rupture velocity. Geophysical Journal International, 162(2): 431-447. |
Bhat H S, Dmowska R, Rice J R, et al. 2004. Dynamic slip transfer from the Denali to Totschunda faults, Alaska:Testing theory for fault branching. Bulletin of the Seismological Society of America, 94(6B): S202-S213. |
Bizzarri A. 2010. How to promote earthquake ruptures:Different nucleation strategies in a dynamic model with slip-weakening friction. Bulletin of the Seismological Society of America, 100(3): 923-940. |
Bizzarri A, Das S. 2012. Mechanics of 3-D shear cracks between Rayleigh and shear wave rupture speeds. Earth and Planetary Science Letters, 357-358: 397-404. |
Bouchon M, Bouin M P, Karabulut H, et al. 2001. How fast is rupture during an earthquake? New insights from the 1999 Turkey earthquakes. Geophysical Research Letters, 28(14): 2723-2726. |
Bouchon M, Vallée M. 2003. Observation of long supershear rupture during the magnitude 8.1 Kunlunshan earthquake.. Science, 301(5634): 824-826. |
Bruhat L, Fang Z J, Dunham E M. 2016. Rupture complexity and the supershear transition on rough faults. Journal of Geophysical Research:Solid Earth, 121(1): 210-224. |
Burridge R. 1973. Admissible speeds for plane-strain self-similar shear cracks with friction but lacking cohesion. Geophysical Journal International, 35(4): 439-455. |
Burridge R, Conn G, Freund L B. 1979. The stability of a rapid mode Ⅱ shear crack with finite cohesive traction. Journal of Geophysical Research:Solid Earth, 84(B5): 2210-2222. |
Das S, Aki K. 1977. A numerical study of two-dimensional spontaneous rupture propagation. Geophysical Journal International, 50(3): 643-668. |
Day S M. 1982. Three-dimensional simulation of spontaneous rupture:the effect of nonuniform prestress. Bulletin of the Seismological Society of America, 72(6A): 1881-1902. |
Dieterich J H. 1979. Modeling of rock friction:1. Experimental results and constitutive equations. Journal of Geophysical Research:Solid Earth, 84(B5): 2161-2168. |
Duan B C. 2012. Dynamic rupture of the 2011 Mw9.0 Tohoku-Oki earthquake:Roles of a possible subducting seamount. Journal of Geophysical Research:Solid Earth, 117(B5): B05311. DOI:10.1029/2011JB009124 |
Dunham E M, Favreau P, Carlson J M. 2003. A supershear transition mechanism for cracks. Science, 299(5612): 1557-1559. |
Dunham E M, Archuleta R J. 2004. Evidence for a supershear transient during the 2002 Denali fault earthquake. Bulletin of the Seismological Society of America, 94(6B): S256-S268. |
Dunham E M, Archuleta R J. 2005. Near-source ground motion from steady state dynamic rupture pulses. Geophysical Research Letters, 32(3): L03302. DOI:10.1029/2004GL021793 |
Dunham E M. 2007. Conditions governing the occurrence of supershear ruptures under slip-weakening friction. Journal of Geophysical Research:Solid Earth, 112(B7): B07302. DOI:10.1029/2006JB004717 |
Dunham E M, Bhat H S. 2008. Attenuation of radiated ground motion and stresses from three-dimensional supershear ruptures. Journal of Geophysical Research:Solid Earth, 113(B8): B07302. DOI:10.1029/2007JB005182 |
Fukuyama E, Madariaga R. 1998. Rupture dynamics of a planar fault in a 3D elastic medium:rate-and slip-weakening friction. Bulletin of the Seismological Society of America, 88(1): 1-17. |
Fukuyama E, Madariaga R. 2000. Dynamic propagation and interaction of a rupture front on a planar fault. Pure and Applied Geophysics, 157: 1959-1979. |
Fukuyama E, Olsen K B. 2002. A condition for super-shear rupture propagation in a heterogeneous stress field. Pure and Applied Geophysics, 159(9): 2047-2056. |
Hu F, Xu J K, Zhang Z G, et al. 2016. Supershear transition mechanism induced by step over geometry. Journal of Geophysical Research:Solid Earth, 121(12): 8738-8749. |
Hu F, Oglesby D D, Chen X F. 2019. The sustainability of free-surface-induced supershear rupture on strike-slip faults. Geophysical Research Letters, 46(16): 9537-9543. |
Ida Y. 1972. Cohesive force across the tip of a longitudinal-shear crack and Griffith's specific surface energy. Journal of Geophysical Research, 77(20): 3796-3805. |
Kame N, Rice J R, Dmowska R. 2003. Effects of prestress state and rupture velocity on dynamic fault branching. Journal of Geophysical Research:Solid Earth, 108(B5): 2265. DOI:10.1029/2002JB002189 |
Kaneko Y, Lapusta N. 2010. Supershear transition due to a free surface in 3-D simulations of spontaneous dynamic rupture on vertical strike-slip faults. Tectonophysics, 493(3-4): 272-284. |
Kase Y, Kuge K. 1998. Numerical simulation of spontaneous rupture processes on two non-coplanar faults:the effect of geometry on fault interaction. Geophysical Journal International, 135(3): 911-922. |
Liu Y, Lapusta N. 2008. Transition of mode Ⅱ cracks from sub-Rayleigh to intersonic speeds in the presence of favorable heterogeneity. Journal of the Mechanics and Physics of Solids, 56(1): 25-50. |
Ma J, Ma S L, Liu L Q, et al. 1996. Geometrical texture of faults, evolution of physical field and instability characteristics. Acta Seismologica Sinica (in Chinese), 18(2): 200-207. |
Madariaga R, Olsen K B. 2000. Criticality of rupture dynamics in 3-D. Pure and Applied Geophysics, 157(11): 1981-2001. |
Olsen K B, Madariaga R, Archuleta R J. 1997. Three-dimensional dynamic simulation of the 1992 Landers earthquake. Science, 278(5339): 834-838. |
Palmer A C, Rice J R. 1973. The growth of slip surfaces in the progressive failure of over-consolidated clay. Proceedings of the Royal Society A:Mathematical, Physical and Engineering Sciences, 332(1591): 527-548. |
Passelègue F X, Schubnel A, Nielsen S, et al. 2013. From sub-Rayleigh to supershear ruptures during stick-slip experiments on crustal rocks. Science, 340(6137): 1208-1211. |
Persson P O. 2005. Mesh generation for implicit geometries[Ph. D. thesis]. Massachusetts: Massachusetts Institute of Technology.
|
Poliakov A N B, Dmowska R, Rice R J. 2002. Dynamic shear rupture interactions with fault bends and off-axis secondary faulting. Journal of Geophysical Research, 107(B11): ESE 6-1-ESE 6-18. |
Qian F, Wu B N, Feng X, et al. 2019. 3D numerical simulation of dynamic ruptures on complex fault systems by BIEM with unstructured meshes. Chinese Journal of Geophysics (in Chinese), 62(9): 3421-3431. DOI:10.6038/cjg2019M0642 |
Rosakis A J, Samudrala O, Coker D. 1999. Cracks faster than the shear wave speed. Science, 284(5418): 1337-1340. |
Ryan K J, Oglesby D D. 2014. Dynamically modeling fault step overs using various friction laws. Journal of Geophysical Research:Solid Earth, 119(7): 5814-5829. |
Tada T. 2006. Stress Green's functions for a constant slip rate on a triangular fault. Geophysical Journal International, 164(3): 653-669. |
Wang D, Mori J. 2012. The 2010 Qinghai, China, earthquake:A moderate earthquake with supershear rupture. Bulletin of the Seismological Society of America, 102(1): 301-308. |
Weng H H, Huang J S, Yang H F. 2015. Barrier-induced supershear ruptures on a slip-weakening fault. Geophysical Research Letters, 42(12): 4824-4832. |
Xia K W, Rosakis A J, Kanamori H. 2004. Laboratory earthquakes:The sub-Rayleigh-to-supershear rupture transition. Science, 303(5665): 1859-1861. |
Xia K W, Rosakis A J, Kanamori H, et al. 2005. Laboratory earthquakes along inhomogeneous faults:Directionality and supershear. Science, 308(5722): 681-684. |
Xu J K, Zhang H M, Chen X F. 2015. Rupture phase diagrams for a planar fault in 3-D full-space and half-space. Geophysical Journal International, 202(3): 2194-2206. |
Xu J K, Zhang Z G, Chen X F. 2016. The effects of barriers on supershear rupture. Geophysical Research Letters, 43(14): 7478-7485. |
Yang H F, Liu Y J, Lin J. 2012. Effects of subducted seamounts on megathrust earthquake nucleation and rupture propagation. Geophysical Research Letters, 39(24): L24302. DOI:10.1029/2012GL053892 |
Yang H F, Liu Y J, Lin J. 2013. Geometrical effects of a subducted seamount on stopping megathrust ruptures. Geophysical Research Letters, 40(10): 2011-2016. |
Yuan J, Zhu S B. 2017. Numerical simulation of seismic supershear rupture process facilitated by a fault stepover. Chinese Journal of Geophysics (in Chinese), 60(1): 212-224. DOI:10.6038/cjg20170118 |
Yue H, Lay T, Freymueller J T, et al. 2013. Supershear rupture of the 5 January 2013 Craig, Alaska (Mw7L24302. Journal of Geophysical Research:Solid Earth, 118(11): 5903-5919. |
Zhang H M, Chen X F. 2006. Dynamic rupture on a planar fault in three-dimensional half space-Ⅰ. Theory. Geophysical Journal International, 164(3): 633-652. |
Zhang L F, Shibazaki B, Liao W L, et al. 2016. Controlling factors analysis of dynamic rupture propagation simulation of curved fault based on boundary integral equation method. Chinese Journal of Geophysics (in Chinese), 59(3): 981-991. DOI:10.6038/cjg20160320 |
马瑾, 马胜利, 刘力强, 等. 1996. 断层几何结构与物理场的演化及失稳特征. 地震学报, 18(2): 200-207. |
钱峰, 吴葆宁, 冯禧, 等. 2019. 基于非结构化网格的边界积分方程方法的断层自发破裂模拟. 地球物理学报, 62(9): 3421-3431. DOI:10.6038/cjg2019M0642 |
袁杰, 朱守彪. 2017. 断层阶区对产生超剪切地震破裂的促进作用. 地球物理学报, 60(1): 212-224. DOI:10.6038/cjg20170118 |
张丽芬, Shibazaki B, 廖武林, 等. 2016. 基于边界积分方程方法的弯折断层破裂传播过程控制因素分析. 地球物理学报, 59(3): 981-991. DOI:10.6038/cjg20160320 |