2. 中国地震局震源物理重点实验室, 北京 100081
2. Key Laboratory of Earthquake Source Physics, China Earthquake Administration, Beijing 100081, China
中国华南地区主要指秦岭—大别造山带以南、青藏高原以东的中国南部地区,主要由扬子与华夏地块构成,中间由江南造山带相隔(Zhao and Cawood, 2012; Zheng et al., 2013;张国伟等,2013; Zhang et al., 2018).它早期由不同块体的不断拼贴,到加里东期完成了华南联合古陆的组建(谢窦克和姜月华,1998).中、新生代以来,受太平洋板块与欧亚板块相互作用的影响,华南地区岩浆活动频繁(Zhou and Li, 2000;于津海等,2002).该区经历了长期、多期次的构造变动,具有复杂的地质构造演化历史(Zhou and Li, 2000;谢窦克和姜月华,1998;张国伟等,2013).确定其地壳结构、物质组成及其横向变化,将为认识和理解研究区域的地壳形成、演化及其地球动力学过程提供重要约束.
数十年来,研究人员在该区开展了一系列地球物理探测与研究工作,采用人工地震(邓阳凡等,2011;Teng et al., 2013)、背景噪声、面波成像(Zhou et al., 2012; Shen et al., 2016)及接收函数(黄晖等,2010;沈玉松等,2013;刘云昌等,2019;Ai et al., 2007;He et al., 2013, 2014;Huang et al., 2015;Song et al., 2017)等方法,对该区的地壳结构及其横向变化进行了研究.研究显示,华南地区地壳厚度由东南沿海的约25 km,向西北的扬子地块逐渐增加到约50 km,其中江汉盆地下方地壳厚度具有明显的隆起,但不同研究中关于其隆起的幅度与范围并不一致(Huang et al., 2015;Song et al., 2017).He等(2013)基于接收函数H-κ分析研究发现,江南造山带具有异常低的地壳波速比(<1.70),并推测由于下地壳拆沉导致其地壳物质组成以长英质为主.然而,与周边地区相比,其地壳厚度并没有发生减薄(He et al., 2013;Song et al., 2017; Guo et al., 2019).接收函数研究还进一步揭示,东南沿海地区地壳平均泊松比值较高(>0.27),暗示与晚中生代铁镁质岩浆的底侵作用有关(Ai et al., 2007;黄晖等,2010;黄海波等,2014;赵延娜等,2017),然而基于背景噪声成像(Zhou et al., 2012;Shen et al., 2016)、重震联合反演(Liu et al., 2018)等研究给出的速度结构显示,与江南造山带相比,沿海地区中下地壳部分并没有显著高速物质的存在(Chang and Baag, 2007).由此可见,进一步对该区的地壳结构及其物质组成进行研究,将为上述争议问题的明晰提供重要依据.
本文利用中国国家地震台网336个固定地震台站的2009年1月—2018年2月期间记录的远震波形资料(图 1),采用接收函数H-κ方法(Zhu and Kanamori, 2000)估算了研究区的地壳厚度和波速比.首先,通过与已有的地壳厚度研究结果进行比较,证实了本文及以往研究结果的可靠性.这将有助于我们确定台站下方地壳结构的横向变化,从而为揭示研究区地壳结构及其横向变化,研究该区的构造演化及动力学过程提供依据.随后讨论了地壳厚度与重力均衡的相关性,进一步证明了本研究估算地壳厚度的可靠性.最后,我们根据该研究的地壳平均波速比和泊松比探讨了地壳结构的物理性质及其演化过程.

|
图 1 地质构造背景及地震台站分布 (a)中国华南地区构造背景,改编自Zheng等(2013)和Zhao和Cawood(2012).蓝色虚线为板块边界线.红色字体中,TLF:郯城—庐江断裂,JXF:嘉山—响水断裂,XSF:信阳—舒城断裂,XGF:襄樊—广济断裂,JSF:江山—绍兴断裂,LMSF:龙门山断裂,ASF:哀牢山—松马断裂;(b)研究区台站分布(红色三角形为固定地震台站,蓝色三角形为SC-REG、SC-XCO、YN-CUX和HI-QXL台站). Fig. 1 Geological setting and seismic stations distribution (a) Tectonic setting of South China (modified from Zheng et al. (2013) and Zhao and Cawood (2012)). Blue dashed lines show boundaries between tectonic blocks. TLF: Tancheng-Lujiang fault, JXF: Jiashan-Xiangshui Fault, XSF: Xinyan-Shucheng fault, XGF: Xiangfan-Guangji fault, JSF: Jiangshan-Shaoxing fault, LMSF: Longmenshan fault, ASF: Ailaoshan-Songma fault; (b) Seismic stations in the study area. Red triangles show permanent stations, blue triangles indicate SC-REG, SC-XCO, YN-CUX and HI-QXL stations. |
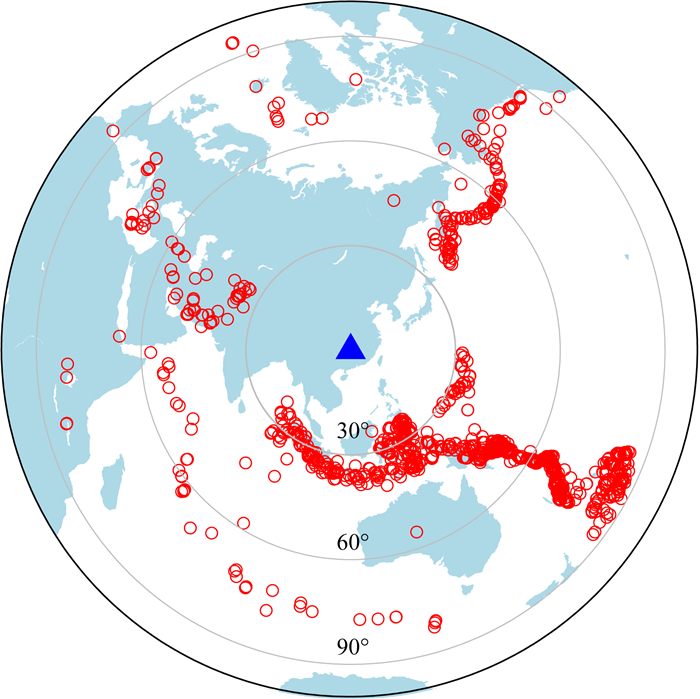
为获得华南地区地壳结构及其横向变化,本文收集了中国国家地震台网(国家测震台网数据备份中心,2007;郑秀芬等,2009)336个固定台站(图 1),从2009年1月—2018年2月记录的远震波形数据.对于台网中每个地震台站,我们挑选了震中距在30°~90°之间,震级>5.5且具有清晰P波初至和高信噪比的远震资料用于P波接收函数的计算.
研究中采用Funclab程序(Eagar and Fouch, 2012;Porritt and Miller, 2018),计算了远震P波接收函数.在接收函数提取之前,我们首先对三分量的原始波形记录作去毛刺、去均值、去线性趋势和波形尖灭等处理,重采样到10 Hz,并以时间窗为直达P波前60 s到240 s截取了原始波形;截取过程中利用AK135模型(Kennett et al., 1995)标记理论到时以帮助直达P波识别.随后,将东西两水平分量旋转到径向和切向,得到径切向分量;然后利用时间域迭代反褶积方法(Kikuchi and Kanamori, 1982;Ligorría and Ammon, 1999)求得径向和切向接收函数.计算中使用了系数为2.5(对应截止频率约1.25 Hz)的高斯滤波器对接收函数作低通滤波以消除高频噪声(刘成林等,2018).计算结果中只保留了对径向P波波形拟合度大于82%(实际计算中,分别计算了拟合度大于80%~98%,综合考虑选择了82%)的接收函数.该拟合度F=100-100× 
|
图 2 地震事件分布 蓝色三角形为研究区域中心,红色圆圈为地震震源. Fig. 2 Epicentre distribution of earthquakes Blue triangle represents the centre of study area, red circles denote seismic events. |
本文研究共计获得了29724条接收函数,多数台站接收函数的数量约大于110条,其中SN-MIAX台站的接收函数数量最多,达到380条,其他台站接收函数数量至少20条才用于进一步的H-κ分析.研究中采用接收函数H-κ方法(Zhu and Kanamori, 2000)用于计算每个台站的地壳厚度、地壳平均波速比和泊松比.研究中分别设定地壳厚度(H)和平均波速比(κ即VP/VS)的变化范围在20~60 km和1.6~2.1之间,以搜索最优的地壳厚度和地壳平均波速比.对于与Moho界面相关的转换震相Ps以及多次波震相PpPs和PpSs+PsPs的振幅分别采用了0.7、0.2和0.1的加权系数.接收函数H-κ研究中,地壳厚度和平均波速比的计算依赖于地壳平均P波速度.为方便计算,本文依据研究区已有人工地震探测结果(邓阳凡等,2011;Teng et al., 2013),统一采用P波平均速度为6.3 km·s-1.研究中通过同一事件波形振幅加权叠加,对接收函数进行了H-κ估计,搜索出最佳地壳厚度和地壳平均波速比,并给出了相应的误差分析.
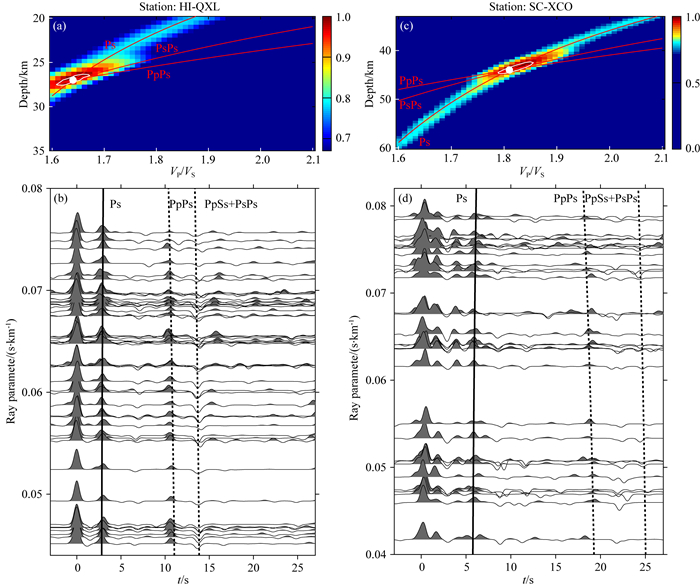
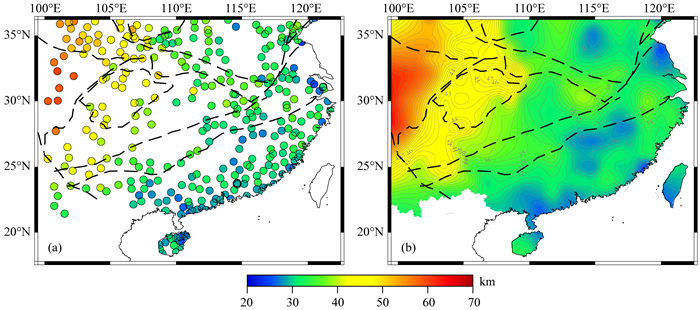
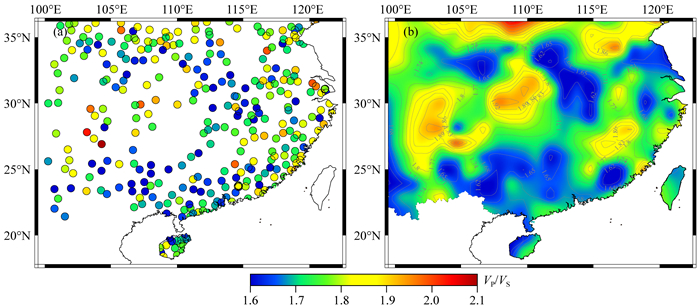
2 结果表1给出了研究区336个台站的地壳厚度H、平均波速比κ和泊松比υ及其标准差等信息,其中泊松比值由转换公式υ=0.5(1-1/(κ2-1))求出(Christensen, 1996).以HI-QXL台站和SC-XCO台站为例(图 1b),图 3表示了它们的接收函数及H-κ叠加结果.图 3a和图 3b分别表示HI-QXL台站的H-κ叠加结果和接收函数.其地壳厚度为27 km,波速比显示1.64,泊松比约0.20.该台站共获得47条接收函数,波形信噪比较高,Ps、PpPs和PpSs+PsPs三种震相清晰明显,与之相对应的叠加振幅谱极值区突出,因此所得的地壳厚度、平均波速比和泊松比等信息较为可靠.同样,SC-XCO台站的H-κ叠加结果(图 3c)显示其平均地壳厚度约为44 km,波速比约1.81,泊松比约0.28,共获得33条接收函数.尽管该台站接收函数(图 3d)的PpSs+PsPs震相较弱,但Ps、PpPs和PpSs+PsPs三种震相叠加振幅谱极值区突出,所得地壳结构等信息仍然可靠.根据H-κ方法所获得的地壳厚度和平均波速比估计,我们还通过对每个台站的地壳厚度和波速比结果进行插值(GMT程序;Wessel and Smith, 1995),得到了研究区的地壳厚度和平均波速比分布图(图 4、图 5).
|
图 3 接收函数及H-κ叠加 (a)和(c)分别表示HI-QXL和SC-XCO台站的H-κ叠加结果,图中白色区域为最大叠加振幅,红线分别表示Ps、PsPs和PpPs+PsPs震相的H-κ关系曲线;(b)和(d)分别为其接收函数结果,黑色实线表示Ps震相走时,黑色虚线分别表示PpPs和PpSs+PsPs震相走时. Fig. 3 Two examples of computed receiver functions and H-κ stacking results (a) and (c) Represent H-κ stacking results at stations HI-QXL and SC-XCO, respectively. White regions denote the maximums for the stacking amplitude. Red lines show the relation between H and κ for phases Ps, PsPs and PpPs+PsPs, respectively; (b) and (d) Denote computed receiver functions at these stations. Black solid lines show travel times for phase Ps. Black dashed lines represent travel times for phase PpPs and PpSs+PsPs, respectively. |
|
图 4 华南地区地壳厚度 (a)地壳厚度散点分布;(b)地壳厚度插值结果. Fig. 4 Crustal thicknesses beneath the South China (a) Scatters of crustal thicknesses; (b) Interpolated results to crustal thicknesses. |
|
图 5 华南地区波速比 (a)波速比散点分布;(b)波速比插值结果. Fig. 5 VP/VS ratios beneath the South China (a) Scatters of VP/VS ratios; (b) Interpolated results to VP/VS ratios. |
本研究显示,该区的地壳厚度横向变化剧烈,其整体分布特征与已有研究相似(Ai et al., 2007;Li et al., 2013, 2014;He et al., 2013, 2014;Huang et al., 2015;黄晖等,2010;黄海波等,2014;赵延娜等, 2015, 2017).即华南大陆沿海地区地壳厚度较薄,约为25~35 km;扬子块体西部的四川盆地下方地壳厚度较厚,约为37~48 km;松潘—甘孜块体的地壳厚度最厚可达60 km;秦岭—大别造山带地壳厚度介于31~54 km之间.研究区地壳厚度整体表现为由西向东逐渐减薄,沿海地区地壳厚度最薄约至24 km.厚度变化40~50 km过渡区域位于松潘—甘孜东南部、秦岭—大别西北段和四川盆地西缘三界交汇处.其30~40 km过渡带分布自秦岭—大别中段,经四川盆地东南边界,至扬子克拉通西南缘,呈现北北东走向.
研究区多数台站(约85%)的地壳平均波速比值都介于1.60~1.85之间,其中秦岭—大别造山带地壳平均波速比整体较低,约为1.72;扬子克拉通波速比变化较大(1.60~1.95),其东部地区平均波速比约为1.67,但其西缘的四川盆地周缘地区波速比值较大,可达1.98;华南地区波速比由西北部的扬子克拉通沿华夏地块东南缘,先降低随之增高,即波速比呈现西北向东南降低又升高的变化趋势.
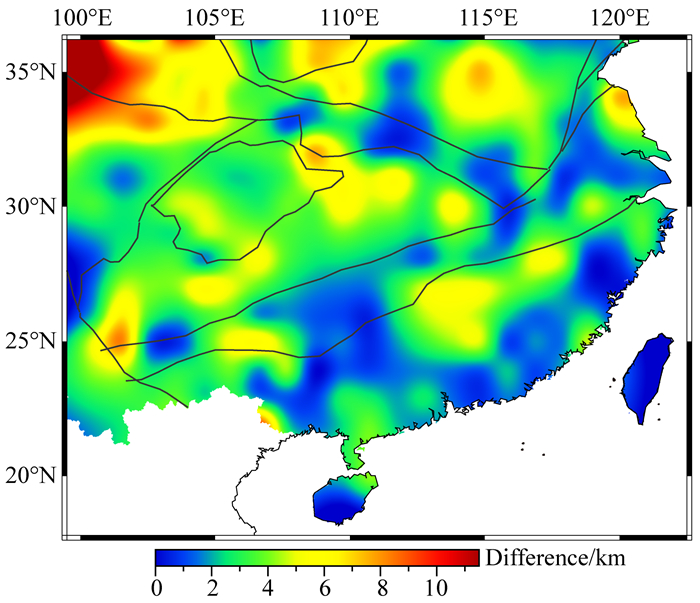
3 讨论 3.1 与已有地壳厚度结果比较CRUST1.0(Laske et al., 2013)是最新的全球地壳模型.该模型基于已有主动、被动源地震探测结果,结合重力反演研究,给出了1°间隔的地壳厚度和速度结构信息.我们利用matlab软件中的自然邻点插值方法对CRUST1.0模型的地壳厚度进行插值,并与本文每个台站所得的地壳厚度结果进行点对点作差画出了两者的地壳厚度差异(图 6).与本文研究结果相比较,二者给出的地壳厚度差异不大,研究区大部分区域的地壳厚度差在4 km以内,但在秦岭—大别和扬子克拉通西段地区,地壳厚度存在明显差异.如在西秦岭地区,本文研究SC-REG台站(图 1b)给出的地壳厚度约48 km,而CRUST1.0给出的地壳厚度约为59 km,二者相差约达11 km.另外,扬子克拉通西缘的YN-CUX台站(图 1b)估计地壳厚度约为40 km,与之对应,CRUST1.0模型显示约48 km.该台站地壳厚度之差相差8 km.
|
图 6 本研究与CRUST1.0模型的地壳厚度差异 Fig. 6 Crustal thickness differences between CRUST1.0 model and this study |
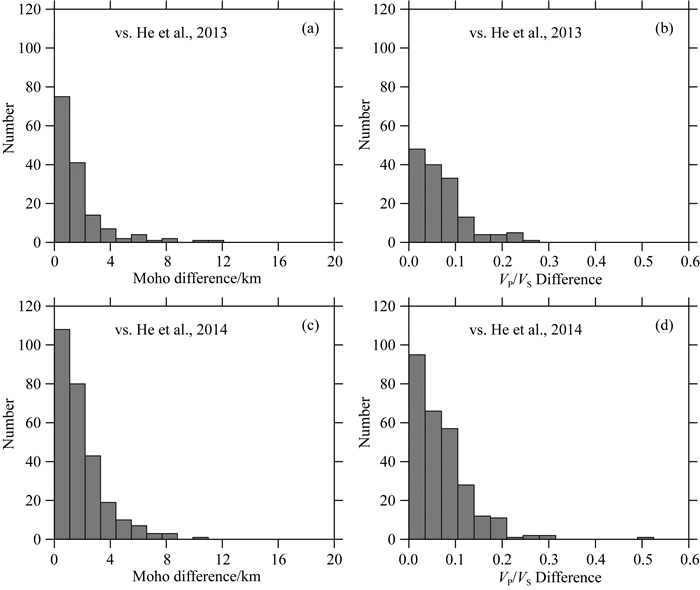
前人(He et al., 2013, 2014)曾经采用中国国家数字地震台网固定地震台站的资料,开展了接收函数H-κ分析,给出了华南地区的地壳厚度和波速比分布.图 7展示了本文研究结果与以往研究在同一台站的观测差异.不同研究中,多数台站的地壳厚度差异都在4 km之内.与之相似,本文得到的VP/VS与已有研究结果也非常接近(多数台站VP/VS之差都小于0.1),由于同样使用了Zhu和Kanamori(2000)的接收函数H-κ分析方法,尽管使用的数据不尽相同,但是相同台站的观测结果差异并不大,这也再次证明了本文研究结果和以往研究结果的一致性和可靠性.但是需要指出的是,在个别台站,不同研究给出的地壳厚度差异可达10 km,如SC-XCO台站(图 1b、图 3c),本文给出的地壳厚度为44 km,而He等(2014)给出的地壳厚度则约为33 km.对于这些台站,我们仔细分析了台站的接收函数记录,确定了可信的地壳厚度与波速比.图 3d给出了位于四川盆地内部SC-XCO台站的接收函数,从图中可以看出Ps转换震相与直达P波的时差约为6 s,我们认为其地壳厚度为44 km更为可信.该台站H-κ分析结果与He等(2013)估计的地壳厚度(约44.5 km)较为一致.
|
图 7 接收函数H-κ结果比较 (a)和(c)分别表示本研究与He等(2013)和He等(2014)的地壳厚度之差的绝对值;(b)和(d)为其地壳平均波速比之差的绝对值. Fig. 7 Comparison of receiver functions H-κ stacking results (a) and (c) Histograms of absolute differences between this study, He et al. (2013) and He et al. (2014) for averaged crustal thicknesses, respectively; (b) and (d) Histograms of absolute differences between averaged VP/VS ratios from sources above. |
华南地区地壳厚度从西部松潘—甘孜的约56 km,中部四川盆地及其邻近区域的约43 km,到整个东部地区的约30 km,整体呈西深东浅的变化趋势.厚度变化30~40 km过渡区域分布自秦岭—大别中段,经四川盆地东南边界,至扬子克拉通西南缘,与北北东向武陵山重力梯度带较为一致.扬子克拉通与华夏块体边界处,地壳厚度减薄平缓,莫霍面起伏平坦,最大差值变化约为12.5 km.
布格重力异常信息主要包含了地壳内部物质成分密度不均匀引起的重力异常和莫霍面起伏引起的重力异常,其中莫霍面起伏引起的重力异常信息占主要部分.在大陆地区,山越高,布格重力异常负值越大,因此布格重力异常应与高程呈负相关关系.图 8a显示了布格重力(由EGM2008地球重力模型下载,http://bgi.omp.obs-mip.fr/data-products/Toolbox/EGM2008-anomaly-maps-visualization)与高程(全球地形起伏模型ETOPO1,https://www.ngdc.noaa.gov/mgg/global/global.html)的相关性.图中可以看出,布格重力异常与地形呈现明显的负相关性.根据Airy均衡假说,地表山脉越高莫霍面越深形成山根以使地壳应力处于平衡状态,因此地壳厚度与地形应呈正相关.将本研究估算的地壳厚度与基于ETOPO1模型的高程数据对比(图 8b),两者呈现正相关性,进一步证明了估算地壳厚度的可靠性.以上讨论了布格重力与高程、地壳厚度与高程的相关性,由此可以推断,地壳厚度与布格重力异常也应呈负相关关系(图 8c).

|
图 8 研究区地壳厚度、布格重力和高程的相关性 (a)布格重力与高程相关性;(b)地壳厚度与高程相关性;(c)布格重力与地壳厚度相关性. Fig. 8 Correlations of crustal thicknesses, Bouguer gravity and elevations (a) Correlation between Bouguer gravity and elevations; (b) Correlation between crustal thicknesses and elevations; (c) Correlation between Bouguer gravity and crustal thicknesses. |
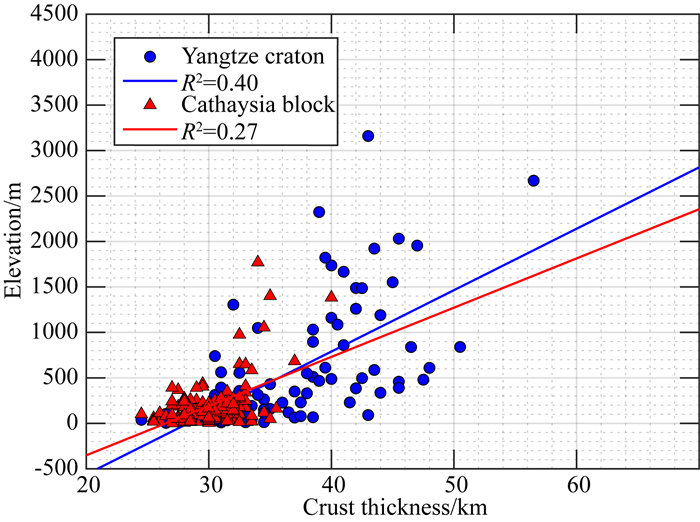
图 9表示扬子克拉通和华夏块体地区(以江山—绍兴断裂为界)地壳厚度与高程的相关性.扬子克拉通地区的数据点(蓝色圆圈)分散在拟合线附近,判定系数为R2=0.40,显示较弱的正相关性.华夏块体地区的线性拟合结果显示判定系数R2=0.27,相较于扬子克拉通地区,具有更弱的正相关性.根据Airy均衡理论,华南地区地壳厚度的变化并不能够很好地解释地形的变化,即呈现明显的正相关.因此表明,华南地区地形的均衡补偿不仅来自于地壳深度范围,也可能与地幔深度下的潜在补偿贡献有关(Tugume et al., 2012; Frassetto and Thybo, 2013).
|
图 9 地壳厚度与高程相关性 蓝色圆圈和直线表示扬子克拉通地区(以江山—绍兴断裂为界)线性拟合结果,判定系数R2=0.40;红色三角形和直线为华夏块体地区线性拟合结果,判定系数R2=0.27. Fig. 9 Correlations between crustal thicknesses and elevations Blue circles and solid lines represent linear regression fits within the Yangtze craton bounded by the Jiangshan-Shaoxing fault with coefficient of determination R2=0.40; Red triangles and solid lines are linear regression fits within the Cathaysia block with coefficient of determination R2=0.27. |
本研究利用H-κ叠加分析估算华南地区的地壳平均波速比,其计算依赖于统一假定的P波平均速度(6.3 km·s-1).Zandt和Ammon(1995)指出,下地壳中当泊松比小于0.26时,地壳组成以酸性的长英质岩石为主;泊松比介于0.26~0.28之间,地壳组成以中基性岩石为主;而泊松比大于0.28时,其岩性主要为基性的铁镁质岩石.根据地壳波速比与泊松比转换公式(Christensen, 1996),两者表现相似的岩性分布特征,即地壳平均波速比从低值(<1.75)到中值(1.76~1.81)和高值(1.81~1.86),地壳物质组成由酸性的长英质岩性、中基性岩石,向基性铁镁质岩石组成逐渐过渡;而波速比>1.86时,则可能与地壳物质的部分熔融有关(Christensen and Mooney, 1995).对于P波速度范围为6.0~6.75 km·s-1,地壳波速比的变化很小,不超过0.05(Zandt and Ammon, 1995),因此本研究测量的地壳平均波速比信息可用来描述地壳的物理性质和物质组成.
已有研究(Zandt and Ammon, 1995; Kachingwe et al., 2015)表明,大陆地盾/克拉通地区地壳厚度介于36~42 km,地壳平均波速比约为1.78.本文研究显示,扬子块体的地壳厚度介于约30~50 km之间,但其地壳平均波速比变化较大(约1.60~1.95).其中四川盆地内部多数台站下方地壳平均波速比约为1.71~1.8,与全球大陆克拉通地区相当,暗示其地壳组成以长英质岩性为主;四川盆地周围地区地壳平均波速比明显较高(约1.81~1.95),暗示其地壳组成以铁镁质岩石组成为主.导致四川盆地周围地区高地壳波速比的原因较多,如克拉通形成过程中岩浆底侵导致下地壳组分以铁镁质麻粒岩为主等.扬子块体的东部显示较低地壳波速比(<1.7)则可能与地表沉积岩的存在相关.
华夏块体地壳平均波速比横向变化比较明显,其西南部地壳平均波速比值基本上都低于1.73,这一观测结果与以往的接收函数分析结果(He et al., 2013, 2014)较为一致,推断其地壳组成主要以长英质为主.华夏块体东南段表现为高地壳平均波速比值(约1.77~1.86),该观测结果与以往的接收函数研究结果(Ai et al., 2007; 黄晖等, 2010;黄海波等, 2014;赵延娜等,2017)较为一致,暗示其地壳组成以中基性铁镁质为主,也可能与地壳中存在流体成分或部分熔融有关(Chang and Baag, 2007).地壳中流体成分或部分熔融的存在使得S波速度相较于P波速度减小,从而表现较高波速比值.Zhao等(2012)北纬25.8°的东西向S波速度剖面显示该地区地壳为高速,且对剪切波速度较敏感的瑞利波相速度图同样显示为高速(Shen et al., 2016).因此,我们推测华夏块体东南段高波速比可能不是由地壳流体或部分熔融所致,而是与晚中生代铁镁质岩浆底侵作用密切相关.采集于广东麒麟和浙江西垄等东南沿海地区的麻粒岩捕虏体都以铁镁质为特征.这些捕虏体来源于下地壳或上地幔顶部,且与太平洋板块西向俯冲到欧亚大陆形成的大陆火山弧环境有关(徐夕生等,1999;于津海等,2002).
华夏块体西南部地壳厚度介于28~36 km之间,地壳平均波速比值基本上都低于1.73,这一观测结果与以往的接收函数分析结果(He et al., 2013, 2014)基本一致,推断其地壳组成主要以中酸性或长英质岩石为主.这与扬子块体(地壳厚度达40~45 km,波速比约1.60~1.95)形成了显著的差异.地质调查研究(如周洁等,2015; Wang et al., 2013)表明,研究区广泛出露多期次的中生代I-型、S-型和A-型花岗岩,其SiO2含量高达75%.与全球铁镁质下地壳(Rudnick and Fountain, 1995)观测结果相比,研究区地壳物质组成以中酸性或长英质岩石为主,则暗示该区镁铁质下地壳的缺失.为解释研究区中生代花岗岩的广泛出露,前人提出了多种不同的模型,至少包括:(1)地幔柱模型(如谢窦克等,1996);(2)与太平洋板块俯冲相关的岩石圈伸展(如Chen et al., 2008);(3)下地壳拆沉模型(如Wang et al., 2006).从本文研究来看,一个成功的模型,至少还应该能解释研究区薄的地壳厚度和低的地壳波速比(铁镁下地壳的缺失).地幔柱的存在将导致形成高的地壳波速比和大的地壳厚度(Chen et al., 2015; Xu et al., 2015),这一点显然和本文观测不相符;而岩石圈伸展模型可以很好的解释薄的地壳厚度,但是其很难解释基性下地壳的缺失.该区基性下地壳物质转变为中酸性的大陆地壳过程可能与增厚的地壳发生拆沉有关(He et al., 2013).
4 结论我们利用P波接收函数H-κ分析估算了中国华南地区的地壳厚度、地壳平均波速比和泊松比.研究区地壳厚度整体表现为由西北的扬子地块约46 km,向东南沿海的约25 km逐渐减薄,呈现西深东浅的变化特点.较厚的地壳形成较深山根使地壳应力处于平衡状态,与布格重力异常相比表现明显的负相关性,而与地形相比显示正相关性.在扬子克拉通和华夏块体地区,地壳厚度与高程显示较弱的正相关,表明华南地区地形的均衡补偿不仅来自于地壳深度范围,也可能与地幔深度下的潜在补偿贡献有关.分布自秦岭—大别中段,经四川盆地东南边界,至扬子克拉通西南缘的地壳厚度30~40 km变化过渡区域与北北东向武陵山重力梯度带较为一致.扬子块体地壳波速比变化较大(介于1.60~1.95),其中在四川盆地内部,地壳平均波速比约为1.71~1.8,与全球大陆地盾/克拉通地区相当,地壳组成以长英质岩性为主.但其周围地区地壳平均波速比明显较高(1.81~1.95),其地壳组成主要表现为铁镁质,推测可能是克拉通形成过程中岩浆的底侵引起下地壳组分以铁镁质麻粒岩为主.扬子块体东部较低的地壳波速比(<1.7)则可能与地表沉积岩的存在相关.华夏块体西部地壳较薄,且具有低的地壳平均波速比(1.65~1.75),暗示该区基性下地壳物质转变为中酸性大陆地壳的过程可能与增厚的地壳发生拆沉有关.而其东南段表现较高地壳平均波速比(约1.77~1.86),地壳组成以中基性铁镁质为主,推断其高的波速比可能不是由地壳流体或部分熔融所致,而是与晚中生代铁镁质岩浆底侵作用密切相关.
致谢 感谢国家测震台网数据备份中心(doi:10.11998/SeisDmc/SN)为本研究提供地震波形数据.
Ai Y S, Chen Q F, Zeng F, et al. 2007. The crust and upper mantle structure beneath southeastern China. Earth and Planetary Science Letters, 260(3-4): 549-563. |
Chang S J, Baag C E. 2007. Moho depth and crustal VP/VS variation in southern Korea from teleseismic receiver functions:Implication for tectonic affinity between the Korean Peninsula and China. Bulletin of the Seismological Society of America, 97(5): 1621-1631. |
Chen C H, Lee C Y, Shinjo R. 2008. Was there Jurassic paleo-Pacific subduction in South China?:Constraints from 40Ar/39Ar dating, elemental and Sr-Nd-Pb isotopic geochemistry of the Mesozoic basalts. Lithos, 106(1-2): 83-92. |
Chen Y, Xu Y G, Xu T, et al. 2015. Magmatic underplating and crustal growth in the Emeishan Large Igneous Province, SW China, revealed by a passive seismic experiment. Earth and Planetary Science Letters, 432: 103-114. |
Christensen N I. 1996. Poisson's ratio and crustal seismology. Journal of Geophysical Research, 101(B2): 3139-3156. |
Christensen N I, Mooney W D. 1995. Seismic velocity structure and composition of the continental crust:A global view. Journal of Geophysical Research, 100(B6): 9761-9788. |
Data Management Centre of China National Seismic Network. 2007. Waveform data of China National Seismic Network (in Chinese). Institute of Geophysics, China Earthquake Administration, http://www.seisdmc.ac.cn.
|
Deng Y F, Li S L, Fan W M, et al. 2011. Crustal structure beneath South China revealed by deep seismic soundings and its dynamics implications. Chinese Journal of Geophysics (in Chinese), 54(10): 2560-2574. DOI:10.3969/j.issn.0001-5733.2011.10.013 |
Eagar K C, Fouch M J. 2012. FuncLab:A MATLAB interactive toolbox for handling receiver function datasets. Seismological Research Letters, 83(3): 596-603. |
Frassetto A, Thybo H. 2013. Receiver function analysis of the crust and upper mantle in Fennoscandia-isostatic implications. Earth and Planetary Science Letters, 381: 234-246. |
Guo L H, Gao R, Shi L, et al. 2019. Crustal thickness and Poisson's ratios of South China revealed from joint inversion of receiver function and gravity data. Earth and Planetary Science Letters, 510: 142-152. |
He C S, Dong S W, Santosh M, et al. 2013. Seismic evidence for a geosuture between the Yangtze and Cathaysia Blocks, South China. Scientific Reports, 3: 2200. |
He R Z, Shang X F, Yu C Q, et al. 2014. A unified map of Moho depth and Vp/Vs ratio of continental China by receiver function analysis. Geophysical Journal International, 199(3): 1910-1918. |
Huang H, Mi N, Xu M J, et al. 2010. S-Wave Velocity Structures of the Crust and Uppermost Mantle, and Poisson's Ratios in Fujian Province. Geological Journal of China Universities (in Chinese), 16(4): 465-474. |
Huang H B, Guo X W, Xia S H, et al. 2014. Crustal thickness and Poisson's ratio in the coastal areas of South China. Chinese Journal of Geophysics (in Chinese), 57(12): 3896-3906. DOI:10.6038/cjg20141204 |
Huang R, Xu Y X, Zhu L P, et al. 2015. Detailed Moho geometry beneath southeastern China and its implications on thinning of continental crust. Journal of Asian Earth Sciences, 112: 42-48. |
Kachingwe M, Nyblade A, Julià J. 2015. Crustal structure of Precambrian terranes in the southern African subcontinent with implications for secular variation in crustal genesis. Geophysical Journal International, 202(1): 533-547. |
Kennett B L N, Engdahl E R, Buland R. 1995. Constraints on seismic velocities in the Earth from traveltimes. Geophysical Journal International, 122(1): 108-124. |
Kikuchi M, Kanamori H. 1982. Inversion of complex body waves. Bulletin of the Seismological Society of America, 72(2): 491-506. |
Laske G, Masters G, Ma Z T, et al. 2013. Update on CRUST1.0-A 1-degree global model of Earth's crust. Geophysical Research Abstracts, 15: 2658. |
Li Q S, Gao R, Wu F T, et al. 2013. Seismic structure in the southeastern China using teleseismic receiver functions. Tectonophysics, 606: 24-35. |
Li Y H, Gao M T, Wu Q J. 2014. Crustal thickness map of the Chinese mainland from teleseismic receiver functions. Tectonophysics, 611: 51-60. |
Ligorría J P, Ammon C J. 1999. Iterative deconvolution and receiver-function estimation. Bulletin of the Seismological Society of America, 89(5): 1395-1400. |
Liu C L, Chen H P, Xie J. 2018. Progress in the studies of the joint inversion of surface wave dispersion and receiver functions. Progress in Geophysics (in Chinese), 33(2): 479-488. DOI:10.6038/pg2018BB0189 |
Liu H, Chen F, Leng W, et al. 2018. Crustal footprint of the Hainan plume beneath Southeast China. Journal of Geophysical Research:Solid Earth, 123(4): 3065-3079. |
Liu Y C, Sun Y, Zhang J. 2019. Crustal structure and anisotropy beneath the Anhui province and its surroundings revealed by teleseismic receiver functions. Progress in Geophysics (in Chinese), 34(2): 442-453. DOI:10.6038/pg2019CC0054 |
Porritt R W, Miller M S. 2018. Updates to FuncLab, a Matlab based GUI for handling receiver functions. Computers and Geosciences, 111: 260-271. |
Rudnick R L, Fountain D M. 1995. Nature and composition of the continental crust:A lower crustal perspective. Reviews of Geophysics, 33(3): 267-309. |
Shen W S, Ritzwoller M H, Kang D, et al. 2016. A seismic reference model for the crust and uppermost mantle beneath China from surface wave dispersion. Geophysical Journal International, 206(2): 954-979. |
Shen Y S, Kang Y, Xu G M. 2013. The crustal thickness and Poisson's ratio distribution in Guangdong and its adjacent areas. Earthquake Research in China (in Chinese), 29(2): 210-218. |
Song P H, Zhang X M, Liu Y S, et al. 2017. Moho imaging based on receiver function analysis with teleseismic wavefield reconstruction:Application to South China. Tectonophysics, 718: 118-131. |
Teng J W, Zhang Z J, Zhang X K, et al. 2013. Investigation of the Moho discontinuity beneath the Chinese mainland using deep seismic sounding profiles. Tectonophysics, 609: 202-216. |
Tkalčić H, Chen Y L, Liu R F, et al. 2011. Multistep modelling of teleseismic receiver functions combined with constraints from seismic tomography:crustal structure beneath southeast China. Geophysical Journal International, 187(1): 303-326. |
Tugume F, Nyblade A, Julià J. 2012. Moho depths and Poisson's ratios of Precambrian crust in East Africa:Evidence for similarities in Archean and Proterozoic crustal structure. Earth and Planetary Science Letters, 355-356: 73-81. |
Wang Q, Wyman D A, Xu J F, et al. 2006. Petrogenesis of Cretaceous adakitic and shoshonitic igneous rocks in the Luzong area, Anhui Province (eastern China):Implications for geodynamics and Cu-Au mineralization. Lithos, 89(3-4): 424-446. |
Wang Y J, Fan W M, Zhang G W, et al. 2013. Phanerozoic tectonics of the South China Block:Key observations and controversies. Gondwana Research, 23(4): 1273-1305. |
Wessel P, Smith W H F. 1995. New version of the generic mapping tools. Eos, Transactions, American Geophysical Union, 76(33): 329. |
Xie D K, Jiang Y H. 1998. Evolutionary process and structural framework of the crust of South China. Journal of Chengdu University of Technology (in Chinese), 25(2): 153-161. |
Xie D K, Ma R S, Zhang Y S, et al. 1996. The crust growth and mantle plume tectonics of South China continent. Beijing: Geological Publishing House.
|
Xu T, Zhang Z J, Liu B F, et al. 2015. Crustal velocity structure in the Emeishan large igneous province and evidence of the Permian mantle plume activity. Science China Earth Sciences, 58(7): 1133-1147. |
Xu X S, Zhou X M, Tang H F. 1999. Exploration for the lower crustal materials and granite genesis in southeast China. Acta Petrologica Sinica (in Chinese), 15(2): 217-223. |
Zandt G, Ammon C J. 1995. Continental crust composition constrained by measurements of crustal Poisson's ratio. Nature, 374(6518): 152-154. |
Zhang G W, Guo A L, Wang Y J, et al. 2013. Tectonics of South China continent and its implications. Science China:Earth Sciences, 56: 1804-1828. |
Zhang H, Zheng J P, Lu J G, et al. 2018. Composition and evolution of the lithospheric mantle beneath the interior of the South China Block:insights from trace elements and water contents of peridotite xenoliths. Contributions to Mineralogy and Petrology, 173(7): 53. DOI:10.1007/s00410-018-1476-z |
Zhao G C, Cawood P A. 2012. Precambrian geology of China. Precambrian Research, 222-223: 13-54. |
Zhao L, Allen R M, Zheng T Y, et al. 2012. High-resolution body wave tomography models of the upper mantle beneath eastern China and the adjacent areas. Geochemistry, Geophysics, Geosystems, 13(6): Q06007. DOI:10.1029/2012GC004119 |
Zhao Y N, Duan Y H, Wei Y H, et al. 2017. Crustal thickness and Poisson's ratio in Jiangxi and Fujian Province in eastern areas of South China. Journal of Geodesy and Geodynamics (in Chinese), 27(3): 261-266. |
Zhao Y N, Duan Y H, Zou C Q, et al. 2015. Study of the receiver function profile from Jiujang, Jiangxi Province to Ninghua, Fujian Province. Acta Seismologica Sinica (in Chinese), 37(5): 722-732. |
Zheng X F, Ouyang B, Zhang D N, et al. 2009. Technical system construction of Data Backup Centre for China Seismograph Network and the data support to researches on the Wenchuan earthquake. Chinese Journal of Geophysics (in Chinese), 52(5): 1412-1417. DOI:10.3969/j.issn.0001-5733.2009.05.031 |
Zheng Y F, Xiao W J, Zhao G C. 2013. Introduction to tectonics of China. Gondwana Research, 23(4): 1189-1206. |
Zhou J, Ge W Y, Jiang Y H. 2015. Geochemical characteristic of tungsten-bearing pluton in the eastern Jiangnan orogen. Contributions to Geology and Mineral Resources Research (in Chinese), 30(2): 157-166. |
Zhou L Q, Xie J Y, Shen W S, et al. 2012. The structure of the crust and uppermost mantle beneath South China from ambient noise and earthquake tomography. Geophysical Journal International, 189(3): 1565-1583. |
Zhou X M, Li W X. 2000. Origin of late Mesozoic igneous rocks in southeastern China:implications for lithosphere subduction and underplating of mafic magmas. Tectonophysics, 326(3-4): 269-287. |
Zhu L P, Kanamori H. 2000. Moho depth variation in southern California from teleseismic receiver functions. Journal of Geophysical Research, 105(B2): 2969-2980. |
邓阳凡, 李守林, 范蔚茗, 等. 2011. 深地震测深揭示的华南地区地壳结构及其动力学意义. 地球物理学报, 54(10): 2560-2574. DOI:10.3969/j.issn.0001-5733.2011.10.013 |
国家测震台网数据备份中心. 2007.国家测震台网地震数据.中国地震局地球物理研究所, http://www.seisdmc.ac.cn.
|
黄海波, 郭兴伟, 夏少红, 等. 2014. 华南沿海地区地壳厚度与泊松比研究. 地球物理学报, 57(12): 3896-3906. DOI:10.6038/cjg20141204 |
黄晖, 米宁, 徐鸣洁, 等. 2010. 福建地区地壳上地幔S波速度结构与泊松比. 高校地质学报, 16(4): 465-474. |
刘成林, 陈浩朋, 谢军. 2018. 面波频散与体波接收函数联合反演研究回顾及展望. 地球物理学进展, 33(2): 479-488. DOI:10.6038/pg2018BB0189 |
刘云昌, 孙娅, 张俊. 2019. 利用远震接收函数研究安徽及周边地区地壳结构和各向异性. 地球物理学进展, 34(2): 442-453. DOI:10.6038/pg2019CC0054 |
沈玉松, 康英, 徐果明. 2013. 广东及其邻域的地壳厚度和泊松比分布. 中国地震, 29(2): 210-218. |
谢窦克, 姜月华. 1998. 华南地壳演化过程及其构造格架. 成都理工学院学报, 25(2): 153-161. |
谢窦克, 马荣生, 张禹慎, 等. 1996. 华南大陆地壳生长过程与地幔柱构造. 北京: 地质出版社.
|
徐夕生, 周新民, O'Reilly SY, 等. 1999. 中国东南部下地壳物质与花岗岩成因探索. 岩石学报, 15(2): 217-223. |
于津海, 徐夕生, 周新民. 2002. 华南沿海基性麻粒岩捕虏体的地球化学研究和下地壳组成. 中国科学(D辑), 32(5): 383-393. |
张国伟, 郭安林, 王岳军, 等. 2013. 中国华南大陆构造与问题. 中国科学:地球科学, 43(10): 1553-1582. |
赵延娜, 段永红, 魏运浩, 等. 2017. 华南大陆东部赣闽地区地壳厚度与泊松比研究. 大地测量与地球动力学, 37(3): 261-266. |
赵延娜, 段永红, 邹长桥, 等. 2015. 江西九江-福建宁化接收函数剖面研究. 地震学报, 37(5): 722-732. |
郑秀芬, 欧阳飚, 张东宁, 等. 2009. "国家数字测震台网数据备份中心"技术系统建设及其对汶川大地震研究的数据支撑. 地球物理学报, 52(5): 1412-1417. DOI:10.3969/j.issn.0001-5733.2009.05.031 |
周洁, 葛伟亚, 姜耀辉. 2015. 江南造山带东段含钨岩体地球化学特征. 地质找矿论丛, 30(2): 157-166. |
 2021, Vol. 64


