 2020, Vol. 63


2. 中国科学技术大学地球和空间科学学院, 合肥 230026;
3. 中国科学技术大学安徽蒙城地球物理国家野外科学观测研究站, 合肥 230026;
4. 美国迈阿密大学罗森斯蒂尔海洋与大气科学学院, 佛罗里达州迈阿密 33149;
5. 新构造运动与地质灾害重点实验室, 中国地质科学院地质力学研究所, 北京 100081
2. School of Earth and Space Sciences, University of Science and Technology of China, Hefei 230026, China;
3. Mengcheng National Geophysical Observatory, University of Science and Technology of China, Hefei 230026, China;
4. Rosenstiel School of Marine and Atmospheric Science, University of Miami, Miami, FL 33149, USA;
5. Key Laboratory of Neotectonic Movement & Geohazard, Institute of Geomechanics, Chinese Academy of Geological Sciences, Beijing 100081, China
宾川盆地位于红河断裂带尾端,自第四纪以来主要以伸展断陷活动为主.该区主体在大理—丽江活断层系中(图 1b),是由正断和左旋走滑断裂构成的“Z”型张扭性复合变形带,包括丽江—大理断裂带和程海—宾川断裂带,一系列近南北向与北西向的断裂在此交汇叠加(黄小巾等,2014).众多的控震构造和发震断层使得滇西北裂陷带地震多发,黄小巾等(2014)搜集整理了滇西北断陷带自公元886年以来的地震记录,表明该区域发生过3.0级以上地震959次,其中5级以上204次,6级以上大震70次,7级以上地震8次,最大震级达7.5级.对于现今这些地震活动,是红河断裂带尾端的北西向断裂起主要控震作用还是当地近南北向至北北东向断裂是主控构造,以及这些断层在深部的延伸情况如何,还需进一步的研究分析.

|
图 1 宾川密集台阵观测实验的台站位置及布设期间地震分布情况 红色五角星为宾川地震信号发射台位置,蓝色三角形为二维台阵,红色三角形为线性台阵,灰色圆点为中国地震台网中心编目系统中的地震震中位置;(a)和(b)中的黑色实线为断层分布(邓起东等,2003;黄小巾等, 2014, 2018;罗睿洁等,2015;Huang X L et al., 2018),(b)中粉色粗实线为宾川盆地轮廓,(b)中的断层粗细代表活动性的强弱,各断层名称及性质见表 1;(c)为地震发震时刻分布情况;(d)和(e)分别为震源深度和台站海拔分布. Fig. 1 The station and earthquake distribution during the Binchuan dense array observation experiment The red star is the location of Binchuan fixed airgun signal transmission stations. The blue triangles are two-dimensional station array and the red triangles are linear station array. The gray dots are earthquake epicenter location from China Earthquake Network Center (CENC) bulletin. The black lines in (a) and (b) denote surface traces of faults (Deng et al., 2003; Huang X J et al., 2014, 2018; Luo et al., 2015; Huang X L et al., 2018). The thick pink line in (b) is the outline of the Binchuan basin. The thickness of the fault in (b) represents the strength of fault activity, and their parameters and characteristics are shown in Table 1. (c) is the earthquake origin time. (d) and (e) are earthquake focal depth and station elevation, respectively. |
大量研究表明盆地的沉积层能够放大地震波的振幅(Denolle et al., 2014; Kawase, 1996),使得地震的破坏显著增加.同时盆地边界速度对比强烈,会导致多次反射且延长地震持续时间(刘启方等,2013),进一步加剧地震的影响.滇西北区域强烈的地震活动和复杂的盆地结构都使得宾川盆地具有较高的地震危险性.对宾川盆地进行精细结构的研究有利于更准确地评估区域地震风险,减轻区域地震灾害.
自20世纪中期开始,地震学家在滇西北地区开展了一系列的工作,包括人工地震测深(Kan et al., 1986;白志明和王椿镛,2004;Wang et al., 2015;陈思文等,2016)、接收函数反演(白一鸣等,2018)和体波面波层析成像(Huang J L et al., 2002; Wang et al., 2002;Yao et al., 2006;Huang J et al., 2012; 鲁来玉等, 2014; Bao et al., 2015;Huang Z C et al., 2015; 陈浩朋等, 2018)等,积累了丰富的地球物理研究成果.但这些工作或是稀疏的面状,或是密集的线状,对于盆地及周边区域三维精细结构的认识仍存在不足.
近些年来,随着地震观测仪器的发展和观测技术的进步,密集台阵为获取高分辨率的三维地下结构提供了新的手段.例如在局部尺度上,沿断裂带布设的超密集台站可以对断层的精细结构进行细致刻画(Qin et al., 2018).利用在加州长滩盆地7 km×10 km范围内高密度布设的5200个单分量检波器,可以获取该地区高精度的浅地表波速结构及隐伏断层分布特征(Lin et al., 2013).利用在西藏东缘布设的160 km长的密集台阵由远震接收函数可得到精细的地壳结构(Liu et al., 2017).由于密集台阵观测期一般为1~2个月,通常只能记录少量天然地震.因此到目前为止,这些密集台阵的数据主要用于噪声成像和接收函数研究,利用密集台阵结合近震体波层析成像研究地下三维速度结构的工作仍很少见.
为了对地震孕育过程的监测提供一种全新方法,并为地震波研究地下介质结构、物性乃至地下介质应力场及其变化提供有效的手段(王彬等,2016),2011年在云南宾川建立了全球第一个固定气枪信号发射台.到目前为止,宾川地震信号发射台已运行将近8年,并开展了很多方面的研究(王彬等, 2016;Wang et al., 2018, 2020).宾川气枪信号发射台可以看成位置和时间精确已知的震源,信号传播距离远,震相丰富(Wang et al., 2018),可为进行三维速度模型检验提供标准事件.
为了获取宾川地震信号发射台周围浅层地壳的高精度速度结构,2017年上半年我们在该地区进行了密集台阵观测实验.Xu等(2018)和She等(2019)已经分别对该密集台阵进行了多方位的数据分析,包括功率谱密度、气枪和地震信号振幅、噪声互相关函数和地震波传播特征等.密集台阵观测期间,宾川地区及附近还发生了近百次天然地震.在本文中,根据2017年密集台阵和区域地震资料,我们利用体波层析成像得到了宾川及其附近地区的上地壳精细速度结构,并对这些地震进行了重定位研究.
1 宾川密集台阵观测实验2017年3月25日—2017年5月25日期间我们在宾川附近开展了密集台阵观测实验,布设了一个二维台阵和一个线性台阵(Xu et al., 2018;She et al., 2019).二维台阵(图 1中蓝色三角形)以宾川信号发射台为中心,成40 km×40 km分布,台站平均间距约为2 km.线性台阵(图 1中红色三角形)布设于云县和宁蒗之间,长约300 km,是为了将气枪信号与爆破信号的波形特征进行对比分析(陈思文等,2016;Wang et al., 2018).
宾川密集台阵由510台三分量短周期地震仪构成,其中二维台阵和线性台阵分别为381台和129台.实验中共使用了三种不同型号的短周期仪器,分别为EPS、EPS-2和QS-05A,频带范围均为5 s~150 Hz,内部时钟根据GPS时间记录并进行自动修正.
以宾川信号发射台为中心,我们从地震编目系统下载了2017年3月25日—2017年5月25日期间的区域地震(在1°×0.8°的范围内共96个),地震分布如图 1.另外,在密集台阵布设期间,宾川地震信号发射台进行了约1400次气枪激发.图 1b中各断层详细的名称、类型、走向及活动性等见表 1(修改自黄小巾等, 2014, 2018;罗睿洁等,2015).
|
|
表 1 宾川盆地主要活动断裂参数及活动特征(修改自黄小巾等, 2014, 2018;罗睿洁等,2015) Table 1 Parameters and characteristics of the major active faults in Binchuan basin (modified from Huang X J et al., 2014, 2018; Luo et al., 2015) |
根据从地震编目系统下载的地震目录(图 1b),我们首先从宾川密集台阵数据库中截取得到各台站的三分量波形(发震时刻的-10~200 s)(张云鹏等,2017).然后用SAC软件对各地震具有高信噪比的原始波形进行手动震相拾取,最终共拾取到117221条初至P波震相和5475条初至S波震相(图 2a).研究区附近的Pn震相一般出现在220 km以后(陈思文等,2016),故而拾取震相中基本不存在此震相.初至P波和S波的射线覆盖如图 2b和图 2c,在整个研究区都具有非常密集的分布.

|
图 2 初至震相走时曲线及射线分布,其中(b)和(c)分别对应P波和S波 (a)中黑色圆点为初至P波震相,灰色圆点为初至S波震相;(b)和(c)中黑色圆点为编目系统地震震中位置,黑色五角星为宾川地震信号发射台位置,白色三角形为二维台阵,黑色三角形为线性台阵;(c)中黑色坐标系XY为反演时所用坐标系,黑色方框为图 5和图 6绘图区域. Fig. 2 Travel time curve and raypath distribution of the first-arrival phases. (b) and (c) are raypath distribution for P-wave and S-wave, respectively The black and gray dots in (a) are first arrival P-wave and S-wave phases, respectively. The black dots in (b) and (c) are earthquake epicenter location from CENC bulletin. The black star is the location of Binchuan fixed airgun signal transmission stations. The white triangles are two-dimensional station array and the black triangles are linear station array. The black coordinate system XY in (c) is the coordinate system used in our tomographic inversion. The black box is the drawing area of Fig. 5 and Fig. 6. |
我们首先利用改进的和达法(Matrullo et al., 2013)得到了研究区域平均的VP/VS值(VP/VS=1.72),如图 3a.该方法是利用不同地震事件不同台

|
图 3 平均VP/VS和初始P波速度模型选取 (a)中黑线为VP/VS拟合线;(b)中灰线为陈思文等(2016)P波速度模型,黑线为本文使用的初始P波一维速度模型. Fig. 3 The selections of average VP/VS and initial P-wave velocity model The black line in (a) is the VP/VS fitted line. The gray line in (b) is the P-wave velocity model from Chen et al. (2016) and the black line is the initial one-dimensional P-wave velocity model used in our tomographic inversion. |
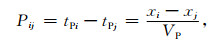
站之间的到时差来进行统计分析,公式如下:
|
(1) |

|
(2) |

|
(3) |
其中Pij、Sij、tP、tS、VP和VS分别为同一事件不同台站(i和j)之间的P波到时差、S波到时差、P波到时、S波到时、P波速度和S波速度.xi和xj分别为该事件所对应的不同台站(i和j)的震源距.
本文使用的一维P波初始模型参考陈思文等(2016),是利用云县—宁蒗宽角反射/折射剖面结合初至波走时成像及正演建模方法得到的P波速度模型(图 3b中灰线).对陈思文等(2016)模型进行稍许调整后,选取图 3b中黑线作为最终的一维初始P波速度,并将1.72作为初始VP/VS,用于三维层析成像反演.反演时使用了simul2000程序(Thurber, 1983, 1993; Evans et al., 1994; Thurber and Eberhart-Phillips, 1999),该程序已被广泛应用于小尺度成像中(Lin and Thurber, 2012; Lin, 2013; Lin et al., 2014).由于可拾取的S波震相通常比P波震相要少很多,simul2000程序利用P波和S-P到时差来反演VP和VP/VS,比直接反演VS要稳定可靠(Evans et al., 1994).另外,VP/VS和泊松比直接相关,比VS能更好地反映物性特征(Zhang et al., 2009).
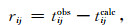
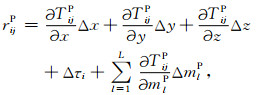
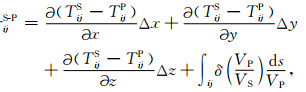
3 三维速度反演和重定位结果在simul2000反演中,到时残差可以写成速度的函数:
|
(4) |
|
(5) |
|
(6) |
这里tijobs、tijcalc和Tij分别为地震i到台站j的观测到时、理论到时和走时.rijP和rijS-P分别为P波到时残差和S-P残差.τi为发震时刻,(x, y, z)代表地震位置.mlP为第l个网格的P波速度,VP和VS分别为P波和S波速度.
在反演时以气枪发射台为原点(图 2c),将网格在水平方向上划分为5 km×5 km,深度上设置在0、3、6、9、12、15、20、35、60 km.考虑到台站的最高海拔为海平面以上2.93 km(图 1e),故而在海平面以上3 km处设置额外的速度层以避免空地震.另外,在反演中为保证地震定位质量,仅使用单个地震震相数目在8条以上的数据,共有82个地震参与反演.
阻尼参数的选取在反演中具有关键性作用,通常可以对数据偏差与模型方差进行权衡分析(Eberhart-Phillips, 1986, 1993; Lin et al., 2013),通过搜索大范围的阻尼值(10~9000)来选取最优的阻尼参数(图 4a和4b).我们首先将VP/VS的阻尼参数设置为9000以保证S波数据的影响降到最低,根据L曲线分布将VP的阻尼定为120(图 4a).接着固定VP的阻尼在120来选取VP/VS的阻尼并将此值取为70(图 4b).

|
图 4 阻尼参数选取和反演前后残差分布 (a)和(b)分别为VP和VP/VS的数据偏差与模型方差的权衡曲线;(c)和(d)分别为P波和S-P反演前后残差分布情况. Fig. 4 Damping parameters selection and residual distributions before and after inversion (a) and (b) are VP and VP/VS trade-off curves between data misfit and model variance. (c) and (d) are the P-wave and S-P arrival time residual distributions before and after tomographic inversion. |
反演在经过8次迭代后已经达到收敛.P波和S-P走时残差的均方根分别从0.80 s和0.79 s降为0.23 s和0.40 s.在反演之前,残差分布在-3~1 s,表明初始模型与真实速度存在整体偏差.反演之后,P波和S波走时残差均以0 s为中心呈现高斯分布(图 4c和4d).
为了对反演后的模型质量进行评估,我们进行了检测板测试.在检测板测试中,所有反演参数均与实际数据反演时相同,并在初始一维模型基础上,对相邻网格的VP和VP/VS分别设置±5%和∓5%的扰动.检测板测试结果如图 5所示,其中蓝色等值线包络区为分辨率大于0.1的区域(1.0代表最佳分辨率,0代表没有分辨).从0 km至9 km,VP和VP/VS在研究区均具有很好的分辨.

|
图 5 不同深度VP和VP/VS检测板结果 将相邻网格VP和VP/VS分别设置±5%和∓5%的异常扰动作为理论模型.其中蓝色等值线包络区为分辨率大于0.1的区域. Fig. 5 Checkerboard resolution test for the VP and VP/VS at different depth slices We computed the synthetic times through the 1-D starting velocity model with ±5% VP and ∓5% VP/VS perturbations that alternate at different depths and across two grid nodes. The blue contours enclose the well-resolved area with resolution value greater than 0.1. |
不同深度VP和VP/VS分布结果如图 6.从VP和VP/VS分布来看,宾川盆地下方速度结构分布非常复杂.在0 km, 盆地的P波速度呈现低速异常,山地呈现高速异常,与区域地形有很好的对应.从0~3 km,高低速主要反映出与地表地质构造相一致的特征,近南北向与北西向异常趋势相互交错.自6~9 km,更多的是由区域构造(以近南北向)为主,北西向的速度分布趋势已不再明显.

|
图 6 不同深度VP和VP/VS分布 其中白色等值线包络区为分辨率大于0.1的区域.各图右上角为反演后该深度平均VP和VP/VS值.(a)中黑色粗实线为宾川盆地轮廓;(h)中紫线为图 9中的剖面位置.F3:宾川盆地南缘断裂;F7:白土坡—杨公菁断裂;F10:宾川盆地东缘断裂;F11:宾川断裂;F12:期纳走滑断裂. Fig. 6 Map views of the VP and VP/VS at different depth slices The white contours enclose the well-resolved area with resolution value greater than 0.1. The average P-wave velocity and VP/VS values are also shown in the top right corner for each depth. The thick black line in (a) is the outline of the Binchuan basin. The purple lines in (h) are the sections shown in Fig. 9. F3, Binchuan basin southern margin fault; F7, Baitupo-Yanggongjing fault; F10, Binchuan basin eastern margin fault; F11, Binchuan fault; F12, Qina strike-slip fault. |
速度结构反演前后地震位置分布情况如图 7.重定位后的地震在水平方向和深度方向上平均误差分别为0.03 km和0.07 km,具有很好的定位质量(Lin et al., 2014).重定位之后的地震分布更聚集,与断层分布呈现很好的一致性,集中分布于宾川盆地东缘断裂、弥渡北端断裂和祥云断裂附近.另外,在洱海南侧(宾川断裂尾端),地震呈现条带状分布.

|
图 7 地震重定位结果 黑色五角星为宾川地震信号发射台位置;(a)中黑色粗实线为宾川盆地轮廓.F4:点苍山断裂;F10:宾川盆地东缘断裂;F11:宾川断裂;F12:期纳走滑断裂;F15:弥渡北端断裂;F16-17:祥云断裂. Fig. 7 Result of earthquake relocation The black star is the location of Binchuan fixed airgun signal transmission stations. The thick black line in (a) is the outline of the Binchuan basin. F4, Diancangshan fault; F10, Binchuan basin eastern margin fault; F11, Binchuan fault; F12, Qina strike-slip fault; F15, Midu northern margin fault; F16-17, Xiangyun fault. |
2017年3月25日—5月25日期间,宾川地震信号台进行了约1400次气枪激发.根据气枪激发时刻,我们截取了各台站的波形(激发时刻的-10~200 s).由于气枪波形具有非常好的重复性,可利用RMS筛选法(蒋生淼等,2017)对信号进行线性叠加(图 8a).然后同样对初至P波和S波震相进行了手动拾取,共拾取到436条初至P波震相和162条初至S波震相(图 8a).

|
图 8 气枪线性叠加波形及震相走时残差分布 (a)为抽样后的波形,黑色圆点和圆圈分别为人工拾取的气枪P波和S波初至到时;(b)和(c)分别为P波和S-P人工拾取到时与理论计算值的残差分布. Fig. 8 The linear stacked waveforms of airgun and the residuals distribution of phase arrival times The waveform in (a) is part of the entire data. The black dots and circles in (a) are manually picked first arrival P-wave and S-wave phases, respectively. (b) and (c) are the P-wave and S-P residual distributions of manually picked and theoretically calculated arrival time, respectively. |
将simul2000反演得到的三维速度模型作为初始模型,我们正演计算了气枪在各台站的理论到时,并得到到时残差.将震中距小于30 km的到时残差数据进行了统计分析,如图 8b和图 8c所示,P波和S-P到时残差集中分布于0 s附近.因为气枪源位置在海平面以上1.55 km,而反演得到的三维速度在0 km以上分辨有限,可能会造成某些到时残差稍微偏离0 s.总体来说,气枪震源的到时检验表明本文速度模型具有很好的可靠性.
4.2 地震重定位分析重定位后的中小地震与断裂带有很好的一致性,地震活动与断裂活动性紧密相关.黄小巾等(2014)研究也表明滇西北裂陷带的断裂活动区域主要分布在边界上,且断裂活动性的分区性和差异性与现今地震活动性整体上是一致的.
在宾川盆地附近,重定位前地震分布很分散,重定位后主要分布于宾川盆地东缘断裂(F10)边界上(图 7b),且集中于断裂弧形转折部位(大坪子—火烧坡,即宾川盆地东缘断裂向东突出位置).一般来说断层转折位置为应力最为集中的区域.宾川盆地东缘断裂自北向南运动性质、走向和活动性均有不同(罗睿洁等,2015;黄小巾等,2018).北段走向为NNW并以正断层为主,到南段走向变为NNE向且正断层减弱而左旋走滑作用逐渐突出,而大坪子至火烧坡的转折区地层为二叠纪灰岩,灰岩中发育倾向西的断坎和断层崖(罗睿洁等,2015).另外,该地震集中区也是滑坡高频次发生区,沿断裂带呈线性发育(张铎等,2016).
在研究区的南部,地震集中于祥云盆地(图 7b).祥云盆地内部构造复杂,地震分布可能是由于各断层的综合作用.该区地震的分布也表明盆地内部可能存在隐伏断层,祥云断裂(F17)在深部可能继续向北延伸.也有可能是因为祥云盆地内部断层倾角较缓,导致地震在水平面上比较分散.另外,研究区南部的地震相对于重定位之前,更规律性地集中于弥渡北端断裂(F15).
在洱海南侧,地震主要分布于大理盆地南部,夹杂在点苍山断裂(F4)南侧和宾川盆地南缘断裂(F3)之间(图 7b).地震呈现北东向条带状分布,受宾川断裂(F11)末端一系列小断层的影响.可能是由于现有断层位置不精确或存在深部延伸问题,也可能是由于西北部微地块顺时针旋转影响的,地震分布趋势可能反映了宾川盆地西南侧综合的旋转-走滑拉分方向(罗睿洁等,2015).具体原因需要后续利用更多地震对震源深度分布进行更深入的研究.
点苍山断裂(F4)是活动性很强的断裂,前期发生过多次5级以上地震.在宾川密集台阵布设的2个月期间,该断裂带上地震数目较少,可能是应力得到了有效的释放或是应力正在积累阶段,后续我们会用更长时间的地震事件进行深入研究.对于宾川断裂(F11)、河曲—宾居断裂(F5)和宾川盆地东缘断裂(F10),在断层北侧速度显示为高速(图 6b—d),表明这些断层下方可能处于闭锁状态,故而也很少发生地震(图 7b).
程海断裂历史上在南北两端皆发生过M≥7.0的大震活动,而中南段的宾川盆地区域近200年尚未发生过6.0级以上地震(黄小巾等,2018).罗睿洁等(2015)表明应关注宾川盆地主断裂(宾川盆地东缘断裂和期纳走滑断裂)的地震危险性.本文所使用的中小地震可以反映地震活动性,但由于使用地震目录时间较短,暂未发现期纳走滑断裂有地震集中分布现象.后续我们将搜集气枪发射台建立以来编目系统的全部地震,对地震活动性进行更为深入的研究.
4.3 宾川盆地VP和VP/VS分布特征宾川盆地为滇西北裂陷区内面积第二大的断陷盆地,可达577 km2.盆地西侧为期纳走滑断裂的延伸,有明显的正断成分.盆地东侧的宾川盆地东缘断裂也为正断性质.盆地整体形态呈月半状,边界呈弧形,是由走滑断层活动影响的正断层控制的盆地(黄小巾等,2014).
宾川盆地下方呈现明显的低速异常(图 6a),与气枪震源得到的走时残差分布规律一致(Xu et al., 2018).在0 km,宾川盆地下方的VP/VS存在部分高值区,呈现V字型分布,该趋势正好与黄小巾等(2018)计算的河道陡峭指数(常被用于河道基岩侵蚀速率的检验,该值异常高时反映区域的差异抬升较强烈,并导致横切抬升山地的河流下切侵蚀能力加强)高值区相一致.
宾川盆地自北向南可分为3个次级沉降中心(力角、宾川和州城),最大沉积中心在州城(可达1000 m),属于全新世河流相、洪沉相沉积(罗睿洁等,2015),而VP成像结果也表明州城的低速异常幅值最大(图 6a).同时成像结果表明同属于全新世河流相、洪沉相沉积的祥云盆地也呈现低速异常分布.
从3~9 km,宾川盆地内部VP和VP/VS分布趋势基本一致,与断层有很好的对应,且均呈现出很强的差异性.She等(2019)在利用频域聚束分析和单台极化进行分析时就发现地震波在盆地内部传播时非常复杂,盆地内的浅层地壳具有很强的各向异性.波形传播方向的异常和速度差异是探测盆地内部隐伏断层的有力证据.
总体而言,宾川盆地速度结构在整体上被期纳走滑断裂(F12)、宾川盆地东缘断裂(F10)和宾川盆地南缘断裂(F3)所控制,在内部又主要受白土坡—杨公菁断裂(F7)和宾川断裂(F11)的影响(图 6).其中宾川盆地东缘断裂的两侧高低速异常在北端较为明显,从大坪子向南逐渐变弱,与黄小巾等(2014)推测该断层的活动规模由北向南逐渐减弱相一致.宾川盆地VP和VP/VS分布整体呈现向西南旋转趋势(图 6),与罗睿洁等(2015)认为该区域微地块向西南方向顺时旋转是一致的.
4.4 宾川盆地速度剖面为了对宾川盆地VP和VP/VS进行更深一步的了解,我们切取了Y=10、5、0、-5、-10、-15 km的剖面进行分析,如图 9.

|
图 9 不同剖面VP和VP/VS分布(Y=10、5、0、-5、-10、-15 km;图 6f中紫线) 其中白色等值线包络区为分辨率大于0.1的区域;黑色圆圈为地震震源位置,地震取剖面南北2.5 km以内.F3:宾川盆地南缘断裂;F5:河曲—宾居断裂;F7:白土坡—杨公菁断裂;F8:花桥断裂;F10:宾川盆地东缘断裂;F11:宾川断裂;F12:期纳走滑断裂.图中黑色虚线为预测的断层倾向;各图顶部为当地地形. Fig. 9 Map views of the VP and VP/VS for different sections (Y=10, 5, 0, -5, -10, -15 km; The purple lines shown in Fig. 6f) The white contours enclose the well-resolved area with resolution value greater than 0.1. The black circles are the earthquakes within 2.5 km of different sections, respectively. F3, Binchuan basin southern margin fault; F5, Hequ-Binju fault; F7, Baitupo-Yanggongjing fault; F8, Huaqiao fault; F10, Binchuan basin eastern margin fault; F11, Binchuan fault; F12, Qina strike-slip fault. The black dashed lines are the predicted dip of different faults; Gray areas at top illustrate the local topography. |
根据各剖面VP和VP/VS分布可得,重定位后的地震多位于断层下方,且震源位置大多位于VP和VP/VS的高低异常分界处,但更深入的分析需要后续利用更多的地震数据进行研究.
由VP和VP/VS分布特征可以看到(图 9),宾川盆地东缘断裂(F10)两侧结构变化很明显(尤其是在3 km深度以下),且两侧差异性在研究区北侧要高于南侧,与断层南北性质差异相关.该断层倾角(图 9中黑色虚线)在中部较缓(Y=0 km和Y=-5 km),向两端变陡,指示该断层面产状沿走向发生变化,反映了区域地块旋转特征.
期纳走滑断裂(F12)、白土坡—杨公菁断裂(F7)和宾川盆地南缘断裂(F3)两侧结构也有部分不同,但该差异要明显小于宾川盆地东缘断裂(F10).Y=10 km和Y=5 km剖面表明白土坡—杨公箐断裂(F7)两侧速度结构差异很大,该断裂是一条正断层,其两侧的构造应力场发生转变,在北侧以正断作用为主且活动性强,而南侧左旋走滑更为明显且活动性减弱(罗睿洁等,2015).Y=-10 km和Y=-15 km剖面在州城盆地处为低速异常,而VP/VS为高值区,和盆地内部发达的水系相关.
黄小巾等(2014)和罗睿洁等(2015)还认为大理—丽江活断层系统在深部极可能与永胜地区相同(黄小龙等,2016),呈负花状构造.我们根据VP和VP/VS(图 9)差异性得到的断层倾向在深部延伸也有此趋势,可能是滇西北地区两侧块体顺时针旋转叠加近东西向伸展作用导致旋扭拉张的变形结果(黄小龙等,2016).
5 结论在本文中,我们基于宾川密集台阵观测期间的96个区域小地震利用simul2000开展了地震重定位和体波层析成像研究,得到了该区域高精度的上地壳VP和VP/VS分布特征.可获得以下主要认识或结论:
(1) 重定位后的地震相对编目系统原始的定位参数有很大改善,小震活动主要集中于宾川盆地东缘断裂的弧形转折部位,并在洱海南侧呈现北东向的条带状分布,且相对于区域地表断层呈现出向南旋转趋势,可能揭示了宾川断裂在西南方向的延伸形态,具体原因还需后续进行更为深入的研究.
(2) 0 km的速度分布与区域地形有很好的对应关系.山地呈现高速异常,宾川盆地呈现低速异常.从3 km至9 km,高低速分界与断层有很好的对应.尤其是到9 km深度后,宾川盆地东缘断裂作为区域性分界断裂的作用更为明显.
(3) 层析成像结果同时揭示宾川盆地东缘断裂的三维形态变化在空间上呈现出南北部倾角大、中部倾角缓的变化特征,可能反映了区域地块旋转变形的特征.
(4) 高精度浅层速度结构和地震重定位结果综合反映出区域上的近南北向至北北东向断裂正逐步取代北西向构造成为主要的分界断裂和控震构造.
总体来看,气枪震源的到时检验表明本文速度模型具有很好的可靠性,可为利用气枪信号观测地下介质变化提供参考.另外,研究结果显示利用密集台阵记录的少量地震也可以获得较高分辨率的区域上地壳速度结构,这为今后的密集台阵研究提供了一个参考.在后续工作中,我们将开展背景噪声成像研究并与体波进行联合反演,以得到更精细的盆地速度结构.同时,还将利用宾川地震信号发射台建立以来该区域编目系统中的所有地震进行重定位和体波成像研究,以对地震活动性有更深入的认识并解决一些地质构造的深部结构特征问题.
致谢 感谢中国地震局地球物理勘探中心在野外观测中的大力支持.感谢叶泵、张博和豆辉在文章撰写过程中给予的宝贵意见.感谢审稿专家们为本文提供宝贵的修改意见.文中图件均采用GMT(Wessel et al., 2013)软件包绘制,在此表示感谢.
Bai Y M, Ai Y S, Jiang M M, et al. 2018. Structure of the mantle transition zone beneath the southeastern Tibetan plateau revealed by P-wave receiver functions. Chinese Journal of Geophysics (in Chinese), 61(2): 570-583. DOI:10.6038/cjg2018L0182 |
Bai Z M, Wang C Y. 2004. Tomography research of the Zhefang-Binchuan and Menglian-Malong wide-angle seismic profiles in Yunnan province. Chinese Journal of Geophysics (in Chinese), 47(2): 257-267. |
Bao X W, Sun X X, Xu M J, et al. 2015. Two crustal low-velocity channels beneath SE Tibet revealed by joint inversion of Rayleigh wave dispersion and receiver functions. Earth and Planetary Science Letters, 415: 16-24. DOI:10.1016/j.epsl.2015.01.020 |
Chen H P, Li Z W, Chu R S, et al. 2018. 3D S-wave velocity and radial anisotropy structure of the crust and uppermost mantle in Yunnan, SE Tibet. Chinese Journal of Geophysics (in Chinese), 61(8): 3219-3236. DOI:10.6038/cjg2018M0150 |
Chen S W, Wang B S, Tian X F, et al. 2016. Crustal structure from Yunxian-Ninglang wide-angle seismic reflection and refraction profile in northwestern Yunnan, China. Seismology and Geology (in Chinese), 38(1): 91-106. DOI:10.3969/j.issn.0253-4967.2016.01.007 |
Deng Q D, Zhang P Z, Ran Y K, et al. 2003. Active tectonics and earthquake activities in China. Earth Science Frontiers (in Chinese), 10(S1): 66-73. DOI:10.3321/j.issn:1005-2321.2003.z1.012 |
Denolle M A, Miyake H, Nakagawa S, et al. 2014. Long-period seismic amplification in the Kanto Basin from the ambient seismic field. Geophysical Research Letters, 41(7): 2319-2325. DOI:10.1002/2014GL059425 |
Eberhart-Phillips D. 1986. Three-dimensional velocity structure in northern California Coast Ranges from inversion of local earthquake arrival times. Bulletin of the Seismological Society of America, 76(4): 1025-1052. |
Eberhart-Phillips D. 1993. Local earthquake tomography: earthquake source regions.//Iyer H M, Hirahara K eds. Seismic Tomography: Theory and Practice. London: Chapman and Hall, 613-643.
|
Evans J, Eberhart-Phillips D, Thurber C H. 1994. User's manual for SIMULPS12 for imaging VP and VP/VS:A derivative of the "Thurber" tomographic inversion SIMUL3 for local earthquakes and explosions. U.S. Geological Survey Open-File Report: 94-431. |
Hu H X, Lu H X, Wang C Y, et al. 1986. Explosion investigation of the crustal structure in western Yunnan Province. Chinese Journal of Geophysics (Acta Geophysica Sinica) (in Chinese), 29(2): 133-144. |
Huang J, Liu X J, Su Y J, et al. 2012. Imaging 3-D crustal P-wave velocity structure of western Yunnan with bulletin data. Earthquake Science, 25(2): 151-160. DOI:10.1007/s11589-012-0842-6 |
Huang J L, Zhao D P, Zheng S H. 2002. Lithospheric structure and its relationship to seismic and volcanic activity in southwest China. Journal of Geophysical Research:Solid Earth, 107(B10): ESE 13-1-ESE 13-14. DOI:10.1029/2000JB000137 |
Huang X J, Wu Z H, Li J C, et al. 2014. Tectonic geomorphology and Quaternary tectonic activity in the northwest Yunnan rift zone. Geological Bulletin of China (in Chinese), 33(4): 578-593. DOI:10.3969/j.issn.1671-2552.2014.04.013 |
Huang X J, Wu Z H, Huang X L, et al. 2018. Tectonic geomorphology constrains on the Quaternary activity and segmentation along Chenghai-Binchuan fault zone in northwest Yunnan, China. Earth Science (in Chinese), 43(12): 4651-4670. DOI:10.3799/dqkx.2017.548 |
Huang X L, Wu Z H, Wu K G, et al. 2016. The main active faults and tectonic system in Yongsheng area, northwestern Yunnan. Journal of Geomechanics (in Chinese), 22(3): 531-547. |
Huang X L, Wu Z H, Wu K G. 2018. Surface rupture of the 1515 Yongsheng earthquake in Northwest Yunnan, and its seismogeological implications. Acta Geologica Sinica (English Edition), 92(4): 1324-1333. DOI:10.1111/1755-6724.13629 |
Huang Z C, Wang P, Xu M J, et al. 2015. Mantle structure and dynamics beneath SE Tibet revealed by new seismic images. Earth and Planetary Science Letters, 411: 100-111. DOI:10.1016/j.epsl.2014.11.040 |
Jiang S M, Wang B S, Zhang Y P, et al. 2017. The influence of noise on the stacking effect of airgun signal and the automatic data screening method. Journal of Seismological Research (in Chinese), 40(4): 534-542. |
Kan R J, Hu H X, Zeng R S, et al. 1986. Crustal structure of Yunnan province, people's republic of China, from seismic refraction profiles. Science, 234(4775): 433-437. DOI:10.1126/science.234.4775.433 |
Kawase H. 1996. The cause of the damage belt in Kobe:"The Basin-Edge Effect", constructive interference of the direct S-wave with the basin-induced diffracted/Rayleigh waves. Seismological Research Letters, 67(5): 25-34. DOI:10.1785/gssrl.67.5.25 |
Lin F C, Li D Z, Clayton R W, et al. 2013. High-resolution 3D shallow crustal structure in Long Beach, California:Application of ambient noise tomography on a dense seismic array. Geophysics, 78(4): Q45-Q56. DOI:10.1190/GEO2012-0453.1 |
Lin G Q, Thurber C H. 2012. Seismic velocity variations along the rupture zone of the 1989 Loma Prieta earthquake, California. Journal of Geophysical Research:Solid Earth, 117(B9): B09301. DOI:10.1029/2011JB009122 |
Lin G Q. 2013. Three-dimensional seismic velocity structure and precise earthquake relocations in the Salton trough, Southern California. Bulletin of the Seismological Society of America, 103(5): 2694-2708. DOI:10.1785/0120120286 |
Lin G Q, Shearer P M, Matoza R S, et al. 2014. Three-dimensional seismic velocity structure of Mauna Loa and Kilauea volcanoes in Hawaii from local seismic tomography. Journal of Geophysical Research:Solid Earth, 119(5): 4377-4392. DOI:10.1002/2013JB010820 |
Liu Q F, Yu Y Y, Zhang X B. 2013. Three-dimensional ground motion simulation for Shidian basin. Journal of Earthquake Engineering and Engineering Vibration (in Chinese), 33(4): 54-60. DOI:10.11810/1000-1301.20130407 |
Liu Z, Tian X B, Gao R, et al. 2017. New images of the crustal structure beneath eastern Tibet from a high-density seismic array. Earth and Planetary Science Letters, 480: 33-41. DOI:10.1016/j.epsl.2017.09.048 |
Lu L Y, He Z Q, Ding Z F, et al. 2014. Azimuth anisotropy and velocity heterogeneity of Yunnan area based on seismic ambient noise. Chinese Journal of Geophysics (in Chinese), 57(3): 822-836. DOI:10.6038/cjg2014031 |
Luo R J, Wu Z H, Huang X L, et al. 2015. The main active faults and the active tectonic system of Binchuan area, northwestern Yunnan. Geological Bulletin of China (in Chinese), 34(1): 155-170. DOI:10.3969/j.issn.1671-2552.2015.01.013 |
Matrullo E, De Matteis R, Satriano C, et al. 2013. An improved 1-D seismic velocity model for seismological studies in the Campania-Lucania region (Southern Italy). Geophysical Journal International, 2013, 195(1): 460-473, doi: 10.1093/gji/ggt224.
|
Qin L, Ben-Zion Y, Qiu H, et al. 2018. Internal structure of the San Jacinto fault zone in the trifurcation area southeast of Anza, California, from data of dense seismic arrays. Geophysical Journal International, 213(1): 98-114. DOI:10.1093/gji/ggx540 |
She Y, Yao H, Wang W, et al. 2019. Characteristics of seismic wave propagation in Binchuan region of Yunnan using a dense seismic array and large-volume airgun shots. Earthquake Research in China, 33(2): 174-185. |
Thurber C H. 1983. Earthquake locations and three-dimensional crustal structure in the Coyote Lake Area, central California. Journal of Geophysical Research:Solid Earth, 88(B10): 8226-8236. DOI:10.1029/JB088iB10p08226 |
Thurber C H. 1993. Local earthquake tomography: Velocities and VP/VS-theory.//Iyer H M, Hirahara K eds. Seismic Tomography: Theory and Practice. London: Chapman and Hall, 563-583.
|
Thurber C H, Eberhart-Phillips D. 1999. Local earthquake tomography with flexible gridding. Computers & Geosciences, 25(7): 809-818. |
Wang B S, Li X B, Liu Z F, et al. 2016. The source and observation system of Binchuan earthquake signal transmitting seismic station and its preliminary observation results. Earthquake Research in China (in Chinese), 32(2): 193-201. DOI:10.3969/j.issn.1001-4683.2016.02.004 |
Wang B S, Tian X F, Zhang Y P, et al. 2018. Seismic signature of an untuned large-volume airgun array fired in a water reservoir. Seismological Research Letters, 89(3): 983-991. DOI:10.1785/0220180007 |
Wang B S, Yang W, Wang W T, et al. 2020. Diurnal and semidiurnal P-and S-wave velocity changes measured using an Airgun source. Journal of Geophysical Research:Solid Earth, 125(1): e2019JB018218. DOI:10.1029/2019JB018218 |
Wang C Y, Mooney W D, Wang X L, et al. 2002. A study on 3-D velocity structure of crust and upper mantle in Sichuan-Yunnan region, China. Acta Seismologica Sinica, 15(1): 1-17. DOI:10.1007/s11589-002-0042-x |
Wang S J, Liu B J, Zhang J S, et al. 2015. Study on the velocity structure of the crust in Southwest Yunnan of the north-south seismic belt-Results from the Menghai-Gengma-Lushui deep seismic sounding profile. Science China Earth Sciences, 58(12): 2175-2187. DOI:10.1007/s11430-015-5189-0 |
Wessel P, Smith W H F, Scharroo R, et al. 2013. Generic mapping tools:improved version released. Eos, Transactions American Geophysical Union, 94(45): 409-410. DOI:10.1002/2013EO450001 |
Xu Y H, Wang B S, Wang W T, et al. 2018. Multiple seismological evidences of basin effects revealed by Array of Binchuan (ABC), northwest Yunnan, China. Earthquake Science, 31(5-6): 281-290. DOI:10.29382/eqs-2018-0281-8 |
Yao H J, Van Der Hilst R D, De Hoop M V. 2006. Surface-wave array tomography in SE Tibet from ambient seismic noise and two-station analysis:Ⅰ-Phase velocity maps. Geophysical Journal International, 166(2): 732-744. DOI:10.1111/j.1365-246X.2006.03028.x |
Zhang D, Wu Z H, Li J C, et al. 2016. Analysis of the influential factor of landslide in Yongsheng-Binchuan region of northwest Yunnan and the exploration of its dynamic cause and significance. Journal of Natural Disasters (in Chinese), 25(1): 176-190. DOI:10.13577/j.jnd.2016.0621 |
Zhang H J, Thurber C, Bedrosian P. 2009. Joint inversion for VP, VS, and VP/VS at SAFOD, Parkfield, California. Geochemistry, Geophysics, Geosystems, 10(11): Q11002. DOI:10.1029/2009GC002709 |
Zhang Y P, Li X B, Wang W T, et al. 2017. Data service system and data quality assessment for mobile observation of transmittingseismic stations in Binchuan, Yunnan. Journal of Seismological Research (in Chinese), 40(4): 525-533. DOI:10.3969/j.issn.1000-0666.2017.04.003 |
白志明, 王椿镛. 2004. 云南遮放-宾川和孟连-马龙宽角地震剖面的层析成像研究. 地球物理学报, 47(2): 257-267. |
白一鸣, 艾印双, 姜明明, 等. 2018. 利用P波接收函数研究青藏高原东南缘地幔转换带结构. 地球物理学报, 61(2): 570-583. DOI:10.6038/cjg2018L0182 |
陈浩朋, 李志伟, 储日升, 等. 2018. 云南地区地壳上地幔三维S波速度与径向各向异性结构研究. 地球物理学报, 61(8): 3219-3236. DOI:10.6038/cjg2018M0150 |
陈思文, 王宝善, 田晓峰, 等. 2016. 滇西北地区云县-宁蒗宽角反射/折射剖面结果. 地震地质, 38(1): 91-106. DOI:10.3969/j.issn.0253-4967.2016.01.007 |
邓起东, 张培震, 冉勇康, 等. 2003. 中国活动构造与地震活动. 地学前缘, 10(S1): 66-73. DOI:10.3321/j.issn:1005-2321.2003.z1.012 |
黄小巾, 吴中海, 李家存, 等. 2014. 滇西北裂陷带的构造地貌特征与第四纪构造活动性. 地质通报, 33(4): 578-593. DOI:10.3969/j.issn.1671-2552.2014.04.013 |
黄小巾, 吴中海, 黄小龙, 等. 2018. 滇西北程海-宾川断裂带第四纪分段活动性的构造地貌表现与限定. 地球科学, 43(12): 4651-4670. DOI:10.3799/dqkx.2017.548 |
黄小龙, 吴中海, 吴坤罡, 等. 2016. 滇西北永胜地区主要活动断裂与活动构造体系. 地质力学学报, 22(3): 531-547. |
蒋生淼, 王宝善, 张云鹏, 等. 2017. 噪声对气枪信号叠加效果的影响及自动数据筛选方法. 地震研究, 40(4): 534-542. |
刘启方, 于彦彦, 章旭斌. 2013. 施甸盆地三维地震动研究. 地震工程与工程振动, 33(4): 54-60. DOI:10.11810/1000-1301.20130407 |
鲁来玉, 何正勤, 丁志峰, 等. 2014. 基于背景噪声研究云南地区面波速度非均匀性和方位各向异性. 地球物理学报, 57(3): 822-836. DOI:10.6038/cjg20140312 |
罗睿洁, 吴中海, 黄小龙, 等. 2015. 滇西北宾川地区主要活动断裂及其活动构造体系. 地质通报, 34(1): 155-170. DOI:10.3969/j.issn.1671-2552.2015.01.013 |
王彬, 李孝宾, 刘自凤, 等. 2016. 宾川地震信号发射台的震源系统、观测系统和观测结果. 中国地震, 32(2): 193-201. DOI:10.3969/j.issn.1001-4683.2016.02.004 |
张云鹏, 李孝宾, 王伟涛, 等. 2017. 云南宾川地震信号发射台的流动观测数据服务系统及数据质量评估. 地震研究, 40(4): 525-533. DOI:10.3969/j.issn.1000-0666.2017.04.003 |
张铎, 吴中海, 李家存, 等. 2016. 滇西北永胜-宾川地区滑坡发育的影响因子分析及其动力成因与意义探讨. 自然灾害学报, 25(1): 176-190. DOI:10.13577/j.jnd.2016.0621 |