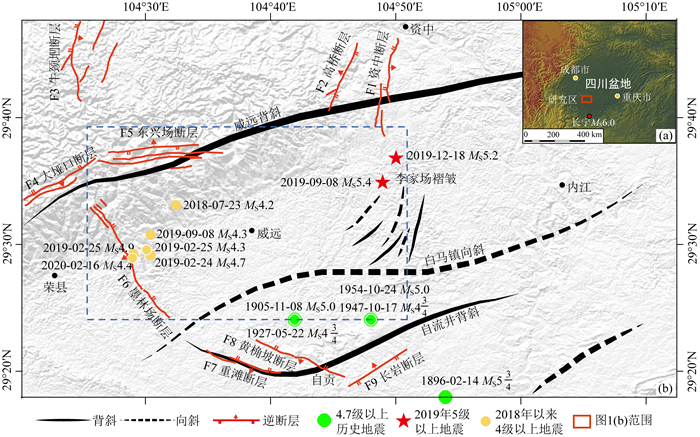
近3年来,四川盆地南缘地震极为活跃,宜宾长宁、兴文、珙县、筠连区域相继发生一系列MS≥4.7破坏性地震(Lei et al., 2019a, b; Meng et al., 2019),2019年6月17日长宁MS6.0地震更是突破了四川盆地最高震级历史记录(图 1a; 易桂喜等,2019; Lei et al, 2019b;Long et al., 2020).与此同时,四川盆地中西部历史弱震区自贡荣县、内江威远和资中地区地震活动也不断增强(图 1b、图 2),2019年以来,以威远为中心、半径20km范围内,先后发生了2019年2月24日荣县MS4.7和25日荣县MS4.9、9月8日威远MS5.4、12月18日资中MS5.2及多次Ms4.0~4.4地震(图 1),震级也突破了震中区历史记录.尽管2月24~25日发生的荣县震群震级不高,但极震区烈度高达Ⅵ度(四川省地震局,2019),而且灾害叠加,导致两人死亡、12人受伤,直接经济损失超过8000万,呈现出小震大灾的特征.
|
图 1 荣县—威远—资中地区构造、4.7级以上历史地震及2018年以来MS≥4.0地震分布.图中构造改编自遂宁幅、自贡幅、内江幅、宜宾幅和泸州幅区域地质报告(四川省地质局,1980).右上角索引图指示本文研究区域和2019年长宁MS6.0地震震中位置.图 1b中的蓝色虚线矩形区域为图 2地震统计区域 Fig. 1 Tectonic settings and the epicenters of the MS≥4.7 historical earthquakes and MS≥4.0 earthquakes since 2018 in Rongxian-Weiyuan-Zizhong region.Geological structure in the map is modified from the regional geological survey report of Suining, Zigong, Neijiang, Yibin and Luzhou geological map sheets (Sichuan Geology Bureau, 1980).Index map on the right-top corner indicates the studied area and the epicenter of the 2019 MS6.0 Changning earthquake.Blue dashed-line rectangle in Fig. 1b displays the area for earthquake statistics in Fig. 2 |
|
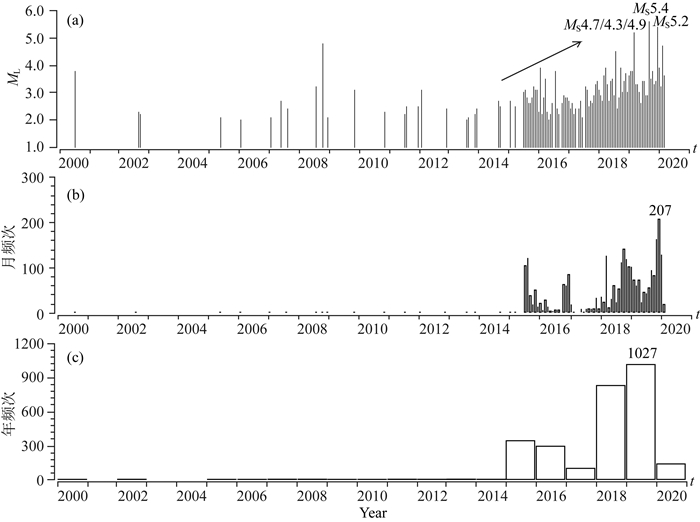
图 2 2000年以来荣县—威远—资中地区ML≥2.0地震M-T、月频次和年频次图(统计区域:29.40°N—29.65°N,104.45°E—104.85°E).(a) M-t图;(b)月频次图;(c)年频次图 Fig. 2 M-t, monthly and annual frequency N-t diagrams of the ML≥2.0 earthquakes since 2000 in Rongxian-Weiyuan-Zizhong region (29.40°N—29.65°N, 104.45°E—104.85°E).(a) M-t diagram; (b) Monthly frequency N-t diagram; (c) Annual frequency N-t diagram |
根据历史地震资料记载,2018年之前,自贡北部的荣县—威远—资中地区地震活动频度低、强度弱,5次MS4.7以上历史地震均发生在该区域南侧的自贡附近(图 1b),分别为:1896年2月14日富顺53/4、1905年11月8日自贡5.0、1927年5月22日自贡43/4、1947年10月18日自贡南43/4及1954年10月24日自贡5.0级地震(国家地震局震害防御司,1995;汪素云,1999).然而,自2015年开始,研究区域(范围:29.40°—29.65°N,104.45°—104.85°E,见图 1b蓝色虚线矩形区域)小震活动显著增多,ML≥2.0地震年频次由2015年之前的低于10次突升至2015年的352次,2019年年频次已达到1027次(图 2c),其中2019年12月单月频次高达207次(图 2b);区内地震事件的震级也逐渐增大(图 2a),从2015年的偶有ML≥3.0地震发生至2016年之后ML≥3.0地震频发,仅2019年就发生MS≥4.7地震4次.荣县—威远—资中地区地震活动呈现明显的时、空丛集特征(图 1b、图 2).
根据中国地震台网中心(CENC)和美国地质调查局(USGS)给出的荣县—威远—资中地区2019年4次MS≥4.7地震的震源参数(见表 1),这4次地震均发生在上地壳,但CENC给出的位于研究区西部的两次荣县地震(表 1中第1、2号)与东部的威远、资中地震(表 1中第3、4号)震源深度具有较大差异,这种差异性是否真实存在?此外,从图 1b可以看出,多数4级地震震中附近并无已知断层出露.这些地震的发震构造又是哪些?荣县—威远—资中地区作为历史少震区,其区域构造应力场特征如何?近些年该区域频繁发生的中小地震为初步回答上述问题提供了机会.
|
|
表 1 CENC与USGS给定的荣县—威远—资中地区4次MS≥4.7地震的震源参数 Table 1 Source parameters of the four MS≥4.7 earthquakes in Rongxian-Weiyuan-Zizhong region from CENC and USGS |
地震震源机制解和相对准确的震源深度是确定发震构造几何结构特征、运动学特征、构造变形特征、震源区应力场特征及深入分析孕震环境的最基础性资料(郑勇等,2009;吕坚等,2013;Xie et al., 2013, 2018;易桂喜等, 2016, 2017, 2019;Long et al., 2019).本文拟采用目前使用最广泛的Cut and Paste(简称CAP)波形反演方法(Zhao and Helmberger, 1994;Zhu and Helmberger, 1996)计算2016年以来荣县—威远—资中地区MS≥3.0地震的震源机制解、震源矩心深度和矩震级;在此基础上,利用Amelung和King(1997)的应变花方法以及Vallage等(2014)提出的面应变As值,定量分析该区域发震构造几何结构特征和运动学特征及震源区构造变形特征; 基于震源机制解反演的应力场,分析研究区域的构造应力场特征.此外,对该区域中小地震不同震级标度之间的关系进行了初步统计分析.研究结果可为进一步研究四川盆地中西部地区发震机理及建立区域地球动力学模型提供依据.
1 区域构造背景与历史地震活动概况荣县—威远—资中地区位于青藏高原东缘、四川盆地中西部(图 1a红色方框标示区域).四川盆地结构相对稳定(Zheng et al., 2013),盆地内的地表构造形迹主要受周边大型构造带活动的影响,形成多期多组构造叠合的复杂构造格局,以华蓥山断裂带和龙泉山断裂带为界,华蓥山断裂带以东为川东南斜坡构造区,龙泉山断裂带以西为川西坳陷构造区,介于两者之间的区域为川中低缓隆起区(谷志东等,2012;邓宾,2013).其中,川中低缓隆起区以舒缓褶皱构造为主,伴有逆冲断裂体系,与盆地东部强烈褶皱区和盆地西部NE走向的造山带内强烈褶皱-断裂带形成了显著差异(谷志东等,2012).
荣县—威远—资中地区位于四川盆地川中低缓隆起区,威远背斜、白马镇向斜和自流井背斜构成区内主要构造格架(四川省地质局,1980)(图 1b).其中,威远背斜为川中褶皱带规模最大、隆起最高的背斜构造,长约100 km,轴向NE-NEE,北西翼较缓,地层倾角1°~5°,南东翼略陡,地层倾角8°~12°(刘树根等,2008;许海龙,2012;李英强,2018).白马镇向斜总体轴向N60°E,位于威远背斜与自流井背斜之间,两翼宽缓,近对称展布.自流井背斜位于区域南部,长约42 km,东段轴向N60°E,西段由近EW转向NW,两翼呈不对称箱状结构,北翼倾角1°~12°,南翼倾角15°~40°.处于威远背斜与白马镇向斜之间的李家场褶皱由6条弧形鼻状、箕状的褶曲组成,褶曲两翼倾角2°~4°,总体呈向NE收敛、向SW撒开的扫帚状形态(四川省地质局,1980).区内与褶皱伴生系列规模不等、产状不同的断层,出露地表的NE向、NNE向和NW向断层大多为沉积盖层断层,以压性逆断层或压扭性断层为主(四川省地质局,1980)(图 1b,表 2).
|
|
表 2 荣县—威远—资中地区与褶皱伴生的主要断层概况(据四川省地质局,1980) Table 2 The information of major faults associated with folds in Rongxian-Weiyuan-Zizhong region (from Sichuan Geology Bureau, 1980) |
从图 1b可以看出,2018年之前,历史记载的5次4.7级以上地震全部发生在白马镇向斜以南的自流井背斜两翼(图 1b),白马镇向斜以北无4.7级以上历史地震;而2018年以来发生的4次MS4.7以上地震均发生在白马镇向斜以北的威远背斜南翼,其中2019年9月8日威远MS5.4与12月18日资中MS5.2地震发生在李家场褶皱向北延伸区域.
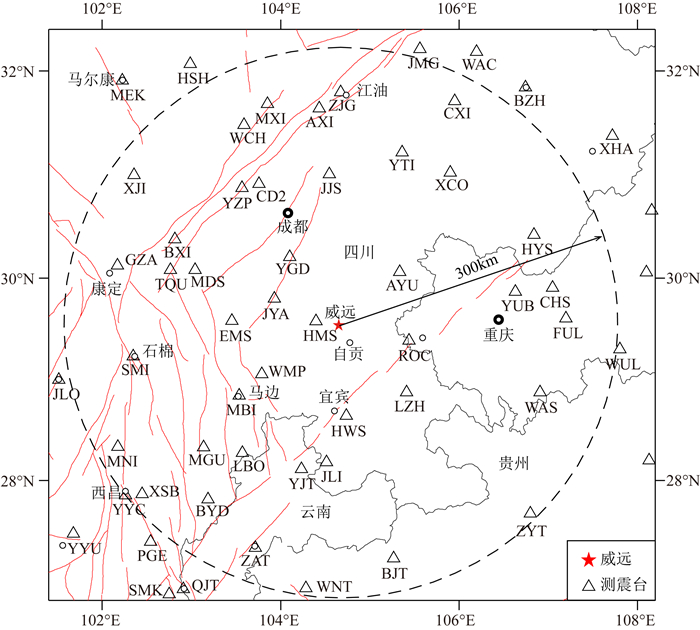
2 资料与计算方法 2.1 资料本文收集了2016年以来区内所有MS≥3.0地震的固定台站宽频带地震波形记录.波形资料均来源于四川区域地震台网,所用台站包括四川及邻区的云南、贵州、重庆区域地震台网部分台站,台站分布见图 3.
|
图 3 荣县—威远—资中地区26个MS≥3.0地震震源机制解计算所用台站分布 黑色虚线圆代表以威远为中心、300 km半径范围 Fig. 3 Distribution of seismic stations for relocation and focal mechanism calculation of the 26 MS≥3.0 in Rongxian-Weiyuan-Zizhong region The black dashed-line circle indicates the range centered at Weiyuan city with a radius of 300 km |
地震震源机制解和震源矩心深度计算采用CAP波形反演方法(Zhao and Helmberger, 1994;Zhu and Helmberger, 1996).CAP方法具有对速度模型和台站分布依赖性较小、计算结果相对稳定等特点(Tan et al., 2006;郑勇等, 2009;易桂喜等, 2017, 2019; 祁玉萍等,2018);同时,由于在波形反演过程中采用了体波与面波的相对强度进行深度约束,利用该方法可获得较准确的震源矩心深度(罗艳等, 2015).利用区域台网波形资料反演得到的矩心深度当搜索步长为1km时误差不超过2km(郑勇等,2009).可靠的震源深度有利于发震构造判识和孕震环境分析(Long et al., 2019, 2020).
在计算震源机制解之前,先利用多阶段定位方法(Long et al., 2015)对荣县—威远—资中地区的地震进行重新定位(定位结果将另文介绍),并产出荣县—威远—资中地区一维速度模型(表 3).基于该速度模型,选取震中距300km范围内的固定台站(图 3)高信噪比宽频带完整波形记录,反演2016年以来发生在该区域的MS≥3.0地震事件的震源机制解、震源矩心深度和矩震级.计算中,MS≥5.0地震的震源函数持续时间设为2 s,其他事件为1 s,体波与面波截取波形窗长分别为30 s和60 s,相应的滤波频带分别为0.05~0.2 Hz和0.05~0.1 Hz;断层面参数走向、倾角、滑动角搜索步长5°,深度步长0.5 km.此外,为保证计算结果的可靠性,在计算参数设置完全相同的情况下,每个地震还利用与表 3模型差异明显的龙门山一维速度模型(郑勇等,2009)进行了计算,只有当这两个不同速度模型获得的震源机制解节面参数基本一致且震源深度差异≤2 km时,该地震的结果才被认为是可靠的.
|
|
表 3 荣县—威远—资中地区一维速度模型 Table 3 1-D velocity model in Rongxian-Weiyuan-Zizhong region |
特定条件下,局部构造变形与更大范围的构造变形仅仅存在幅度上的差异,其应变张量形态是一致的,由此,Amelung和King(1997)提出了利用震源机制解获取局部构造变形模式和区域构造变形模式的应变花方法(strain rosette).应变花代表应变张量的方位和形状,应变花的白瓣长轴代表挤压方向,黑瓣长轴代表拉张方向,直观体现了构造应变模式(Amelung and King, 1997),是进行区域构造应变模式定量分析与比较的最有力工具,目前被广泛地应用到Denali断层、龙门山构造带及四川盆地南缘等地区(Vallage et al., 2014;易桂喜等, 2016, 2017, 2019).
Vallage等(2014)在应变花方法基础上,提出了面应变(Areal strain)As值,用于定量评估发震构造运动学特征与构造变形特征:As=A1-A2,其中,A1为应变花挤压瓣(白瓣)长度,A2为应变花拉张瓣(黑瓣)长度.对于同一个地震,应变花唯一, 因此,即使不能确定震源机制解中哪个节面是发震断层面,仍可利用As值进行发震构造变形模式的比较(Vallage et al., 2014).对于单个地震,As值在-1与1之间,根据面应变As值,将震源机制与构造变形模式分成以下5类:(1)0.7≤As≤1,逆冲型; (2)0.3≤As < 0.7,逆冲兼走滑型;(3)-0.3≤As < 0.3,走滑型;(4)-0.7≤As < -0.3,正断兼走滑型;(5)-1≤As < -0.7,正断型;特别地,As=1,纯挤压逆冲;As=0,纯走滑;As=-1,纯拉张(Vallage et al., 2014;易桂喜等,2016).
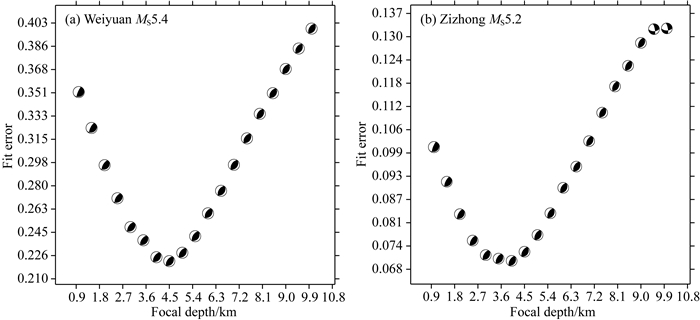
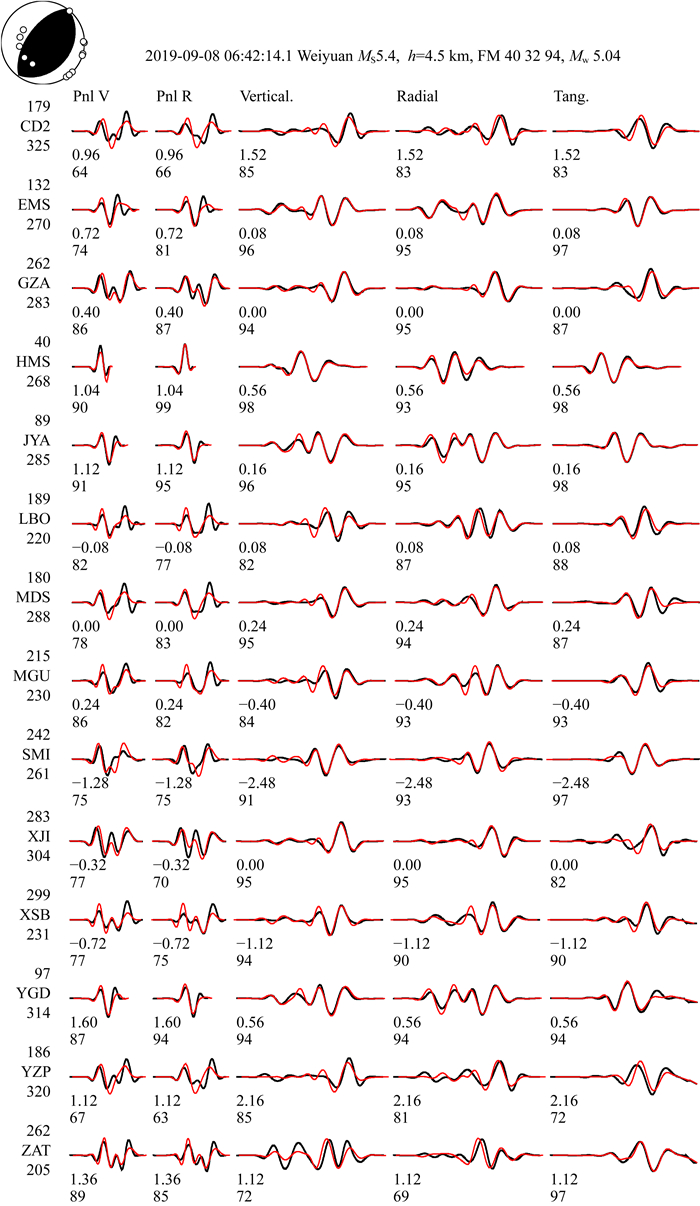
3 结果及分析 3.1 荣县—威远—资中地区发震构造几何结构特征与运动学特征图 4展示了基于荣县—威远—资中地区一维速度模型获得的2019年9月8日威远MS5.4和12月18日资中MS5.2地震的CAP波形反演误差随深度的变化图,具有最小误差的最佳拟合深度分别为4.5 km、4.0 km.图 5和图 6则分别给出了这两个地震在最佳拟合深度处各台站的理论波形与实际波形拟合图,可以看出,超过四分之三的分量拟合相关系数高于80%,表明理论波形与实际波形具有较好的拟合关系.
|
图 4 两个5级以上地震震源机制解反演残差随深度分布图 (a) 2019年9月8日威远MS5.4;(b) 2019年12月18日资中MS5.2 Fig. 4 Variation of fitting error with depth during the focal mechanism inversion for the two MS≥5.0 earthquakes (a) The MS5.4 Weiyuan earthquake on September 8, 2019; (b) The MS5.2 Zizhong earthquake on December 18, 2019 |
|
图 5 2019年9月8日威远MS5.4地震震源机制和理论波形与观测波形拟合图.红线表示理论地震图, 黑线为观测地震图, 波形左侧台站名上方的数字为震中距(单位:km),下部数字为方位角(单位:°);波形下方的两行数字分别代表理论地震图相对观测地震图的移动时间(单位:s)及二者的相关系数(用百分比表示) Fig. 5 Focal mechanism solution and comparison between observed and synthetic waveforms of the MS5.4 Weiyuan earthquake on September 8, 2019. The red and black lines are the synthetic and observed waveforms, respectively. The station names are given on the left, and the numbers above and below the names are epicentral distance (in km) and azimuth (in degree). Numbers below the traces are the time shifts (in second) of the synthetics relative to the observations and the corresponding cross-correlation coefficients (in percentage) |

|
图 6 2019年12月18日资中MS5.2地震震源机制和理论波形与观测波形拟合图.红线表示理论地震图, 黑线为观测地震图, 波形左侧台站名上方的数字为震中距(单位:km),下部数字为方位角(单位:°);波形下方的两行数字分别代表理论地震图相对观测地震图的移动时间(单位:s)及二者的相关系数(用百分比表示) Fig. 6 Focal mechanism solution and comparison between observed and synthetic waveforms of the MS5.2 Zizhong earthquake on December 18, 2019. The red and black lines are the synthetic and observed waveforms, respectively. The station names are given on the left, and the numbers above and below the names are epicentral distance (in km) and azimuth (in degree). Numbers below the traces are the time shifts (in second) of the synthetics relative to the observations and the corresponding cross-correlation coefficients (in percentage) |
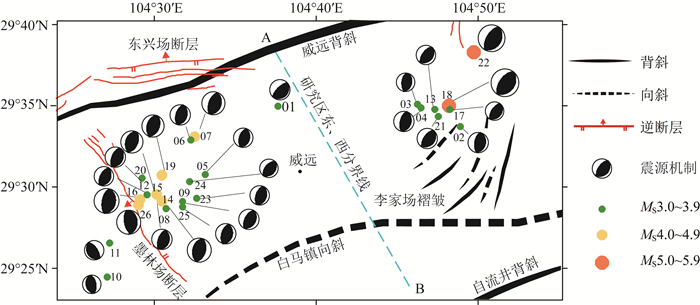
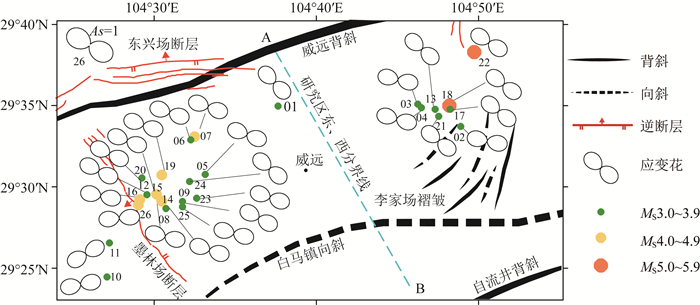
利用CAP波形反演方法,本文共获得了2016年以来荣县—威远—资中地区26个MS≥3.0地震的可靠震源机制解、震源矩心深度和矩震级,计算结果见表 4和图 7.基于震源机制解,分别计算了每个地震以及26个地震整体的应变花和面应变As值,结果见表 4和图 8.本文获得的2019年9月8日威远MS5.4和12月18日资中MS5.2地震(表 4中第18、22号)震源机制解与USGS结果接近,但震源矩心深度远小于USGS给出的10 km震源深度.研究表明,对于破裂尺度较小的中小地震,利用区域台网波形资料反演获得的震源矩心深度比利用远震波形资料反演结果更可靠(易桂喜等, 2017, 2019;Long et al., 2019).本文利用波形反演获得的荣县—威远—资中地区4个MS≥4.7地震的震源矩心深度(表 4)均小于CENC给出的震源初始破裂深度(表 1),且两者的深度差异远大于5级左右地震不到0.5 km半径的震源尺度(王培德等,1988), 说明CENC给出的深度与实际深度可能存在较大误差.
|
|
表 4 荣县—威远—资中地区26个MS≥3.0地震震源机制解 Table 4 Focal mechanism solutions of the 26 earthquakes with size MS≥3.0 in Rongxian-Weiyuan-Zizhong region |
|
图 7 荣县—威远—资中地区26个MS≥3.0地震震源机制解.震中编号与表 4中的地震序号一致 图中带AB字母标示的蓝色虚线为研究区东、西分界线,也是图 9b垂直剖面位置 Fig. 7 Focal mechanism solutions for the 26 MS≥3.0 earthquakes in Rongxian-Weiyuan-Zizhong region. The number on each epicenter dots is the same as the first column in Table 4 The blue dashed-line with symbols A and B is the mark divided the studied area into eastern and western parts, and the location of the vertical cross-section A-B |
|
图 8 荣县—威远—资中地区26个MS≥3.0地震的应变花.震中编号与表 4中的地震序号一致 左上角为26个地震整体的应变花和As值 Fig. 8 Strain rosettes for the 26 MS≥3.0 earthquakes in Rongxian-Weiyuan-Zizhong region. The number on each epicenter dots is the same as the first column in Table 4 The strain rosette and As value for the entire 26 MS≥3.0 earthquakes are shown on the left-top corner |
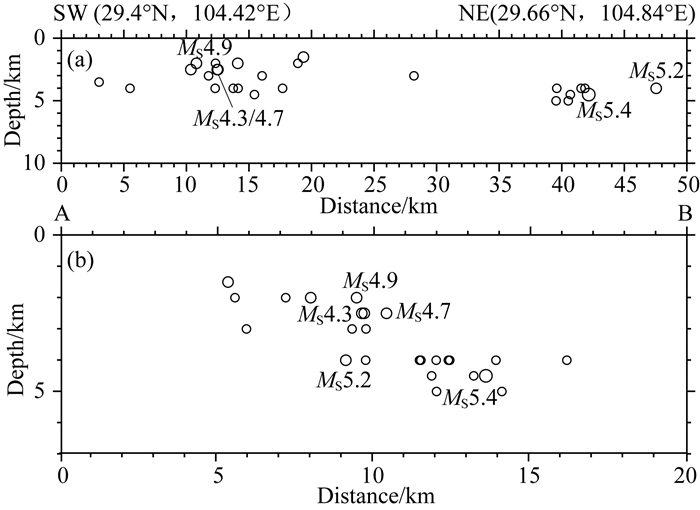
计算结果显示,荣县—威远—资中地区26个MS≥3.0地震的震源矩心深度在1.5~5 km之间(表 4),表明地震均发生在上地壳浅部.26个地震的平均震源矩心深度3.4 km,与发生在四川盆地南缘的2019年6月17日宜宾长宁MS6.0地震序列震源矩心深度均值(3.5 km)一致(易桂喜等,2019),可能反映了四川盆地中西部优势孕震层位于大约5~7 km深度的浅部滑脱层之上(Hubbard and Shaw, 2009;Jia et al., 2010; Wang et al., 2014; Zhang et al., 2019).我们注意到,大致以威远为界(分界线见图 7中蓝色虚线),发生在分界线西侧的2019年2月24日荣县MS4.7、25日荣县MS4.3和MS4.9地震的震源矩心深度分别为2.5 km、2.5 km、2.0 km(表 4、图 7中第14~16号),明显小于分界线东侧的威远MS5.4和资中MS5.2地震深度.自SW(起点坐标:29.4°N,104.42°E)至NE(终点坐标:29.66°N,104.84°E)的深度剖面图可以看出,东侧8个MS≥3.0地震震源深度均超过4.0 km(图 9a),平均震源深度约4.4 km,而西侧18个地震平均震源深度为3.0 km,表明荣县—威远—资中地区MS≥3.0地震震源存在东深、西浅的空间差异.自NW至SE的A-B震源深度剖面图(图 9b)清晰地展示出发震断层面倾向SE,由图 9b粗略估计的断层面倾角约21°~27°,表明发震断层缓倾角.
|
图 9 荣县—威远—资中地区26个MS≥3.0地震的震源深度剖面. (a)自南西(29.4°N,104.42°E)至北东(29.66°N,104.84°E)方向的深度剖面;(b) A-B深度剖面 Fig. 9 Vertical cross-sections of the 26 MS≥3.0 earthquakes in Rongxian-Weiyuan-Zizhong region. (a) Vertical cross-section from SW at (29.4°N, 104.42°E) to NE at (29.66°N, 104.84°E); (b) Vertical cross-section from A to B |
荣县—威远—资中地区主要构造为褶皱及伴生断层(谷志东等,2012),仅少量断层出露地表(图 1b、图 7、图 8),造成发震构造的判识存在很大困难.从表 4和图 7可以看出,该地区地震的震源机制解节面走向与错动类型具有非常好的一致性.26个MS≥3.0地震的As值全部接近于1(表 4),根据第2.3节As值分类标准,这些地震的震源错动类型均可归属于第一类中的特例,即纯逆冲型(图 7、图 8),与该区长期处于挤压构造环境相吻合(刘树根等,2008;Hubbard and Shaw, 2009; 陈朝伟等,2019).震源机制解节面参数统计玫瑰图显示(图 10),节面走向优势方位NNE-NE/SSW-SW向,揭示荣县—威远—资中地区的发震构造以走向相近的近NE/SW向逆冲型断裂为主.除去发生在墨林场断层及其西侧节面走向近SN和NW-SE向的3个地震(即表 4和图 7中第10、11、26),墨林场断层东侧的23个地震震源机制解倾向SE的节面Ⅰ走向与倾角均值分别为26°、33°,倾向NW的节面Ⅱ走向与倾角均值约203°、57°,节面走向和倾角与震中附近的NNW向墨林场断层、近EW向的东兴场断层(表 2)及缓倾角的李家场褶皱几何特征(四川省地质局,1980)不匹配,结合震源深度剖面图(图 9b),由此推测,荣县—威远—资中地区的主要发震构造可能是发育在威远背斜南翼的一系列倾向SE、走向NNE-NE的缓倾角盲冲断层.

|
图 10 荣县—威远—资中地区26个MS≥3.0地震震源机制解节面走向(Strike)、倾角(Dip)和滑动角(Rake)统计玫瑰图 Fig. 10 Rose maps of the strike, dip and rake of nodal planes for the 26 MS≥3.0 earthquakes in Rongxian-Weiyuan-Zizhong region |
26个MS≥3.0地震的P、T、B轴俯角均值分别为13°、77°、2°,显示P、B轴近水平,T轴近直立;P、T、B三轴优势方位单一(图 11),反映该区域处于相对简单的构造应力环境.采用震源机制应力场反演程序FMSI(Gephart and Forsyth, 1984),基于表 4和易桂喜等(2019)的2019年长宁MS6.0地震序列震源机制解,分别反演了荣县—威远—资中地区和研究区南侧长宁余震区的构造应力场.结果显示,荣县—威远—资中地区应力场最大主应力轴σ1方位136°,俯角1°;中间主应力轴σ2方位226°,俯角1°;最小主应力轴σ3方位355°,俯角89°,其中,σ1呈NW-SE向,与目前已知的该区域构造应力场(陈朝伟等,2019)及其所处华南块体大区域构造应力场(Heidbach et al., 2018)最大水平主应力方向一致,也与该区域GPS速度场方向基本一致(Xu and Stamps, 2019; Wang and Shen, 2020),反映该区域构造活动主要受区域构造应力场控制,断层错动类型为纯逆冲型.而位于研究区南侧的2019年长宁MS6.0地震余震区的最大主压应力轴σ1为NE-SW向,断层错动方式以逆冲为主略带走滑分量(σ1方位63°,俯角18°;σ2方位332°,俯角1°;σ3方位238°,俯角72°),揭示四川盆地构造应力场具有明显的分区特征(易桂喜等,2019).

|
图 11 荣县—威远—资中地区震源机制P、T、B轴方位角(az)与俯角(pl)统计玫瑰图 Fig. 11 Rose maps of the azimuth (az) and plunge (pl) of P, T and B axes for the 26 MS≥3.0 earthquakes in Rongxian-Weiyuan-Zizhong region |
表 4列出了26个地震的三个不同标度震级值:MW、MS、ML,其中,矩震级MW为本文利用波形反演所得,面波震级MS、地方性震级ML则分别来自于区域地震台网快报目录和正式目录.在地震台网的日常工作中,利用震中距1000 km以内台站记录的优势周期为1.0 s左右的S波(或Lg波)波形测定其地方性震级ML;通常,对于面波发育的4.5级以上浅源地震,利用震中距>250 km台站记录的3 s以上周期面波测定其面波震级MS, 对于震级较大的地震,当震中距在20°~160°范围内时,面波周期在18~22 s之间,测定面波震级MS的波形优势周期为20 s左右(刘瑞丰等,2015).可见,ML和MS均是在某一周期(或频率)测定的“单色震级”(刘瑞丰等,2020).实际上,在四川区域台网产出的地震目录中,中、小地震的ML震级均为实测震级;5级以上地震和部分面波发育的5级以下地震同时测定其MS震级.因受震源特性与地壳不均匀结构的影响,可测定MS震级的地震下限震级存在较大的区域差异.此外,当震源破裂尺度大于测定震级所使用的波长时,ML、MS震级存在震级饱和问题(Kanamori, 1977).有鉴于此,Kanamori(1977)提出了利用地震矩描述地震大小的矩震级MW,这种震级标度适用于从大震到极微震的震级范围(陈运泰和刘瑞丰,2004).矩震级MW通过地震波形拟合获取,将是未来台网目录产出的目标震级标度.
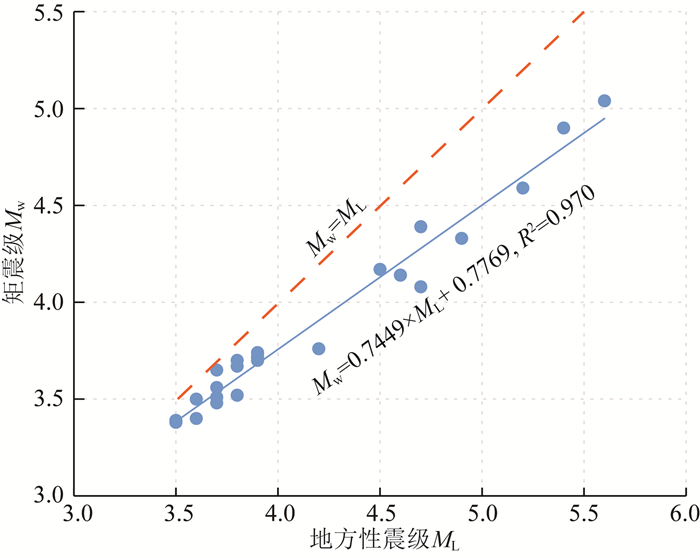
地震震级是度量地震大小的一个无量纲量,为地震的三个最基本参数(时间、地点、震级)之一,也是进行地震活动性分析和地震危险性及灾害评估的重要基础资料.在实际工作中,因不同的需求,需根据经验统计关系进行不同震级标度之间的转换.前人研究表明,ML与MS只有等于6.5级时才基本一致;对于其他震级的地震,其不同震级标度值都有一定的差别(Gutenberg, 1945a, 1945b, 1945c).因表 4中多数地震的MS震级为利用经验公式由ML震级转换所得,本文仅讨论实测震级ML与MW之间的关系.图 12直观展示了荣县—威远—资中地区26个地震的实测ML与MW震级的关系,图中,蓝色实线为实测ML与MW值拟合趋势线,红色虚线代表ML与MW相等时的趋势线,可以看出,蓝色实线与红色虚线存在剪刀差,表明实测ML与MW震级具有较明显差异,且这种差异存在随震级增大而增大的趋势.
|
图 12 荣县—威远—资中地区地震震级MW与ML之间的关系 Fig. 12 Relationship between magnitudes MW and ML for earthquakes in Rongxian-Weiyuan-Zizhong region |
基于表 4中26个地震实测MW与ML震级,获得荣县—威远—资中地区中小地震的MW与ML震级之间的统计关系如下:

|
上式中拟合相关系数R值接近1.0,表明荣县—威远—资中地区MW与ML震级之间具有较好的线性拟合关系,即便如此,对于某一具体的地震,根据经验关系转换得到的震级值与实测值仍可能存在不同程度的偏差.以表 4中具有相同实测震级ML3.7的第5、9、13、23号地震为例,根据上述统计关系转换获得的相应MW震级为MW3.53,与第5、13、23号地震实测MW震级差异较小(≤0.05),但第9号地震的实测值MW3.65与该转换值之差超过0.1,这种差异可能会给震级分档统计、地震释放能量计算等带来一定的不确定性.
4 荣县—威远—资中地区发震构造变形特征及意义26个MS≥3.0地震整体的应变花表现为长轴NW-SE向展布的纯挤压白瓣形态(见图 8左上角应变花),显示荣县—威远—资中地区发震构造整体呈NW-SE向纯挤压变形模式,明显有别于四川盆地南缘2019年长宁MS6.0地震余震区NE-SW向挤压兼具小量NW-SE向拉张分量的构造变形模式(易桂喜等,2019),揭示四川盆地构造变形具有明显的分区特征.
图 8显示,26个地震中,位于墨林场断层东侧的23个地震的应变花均表现为近NW-SE向的挤压白瓣形态,揭示墨林场断层东侧的发震构造呈近NW-SE向纯挤压变形特征;而位于该断层上的第26号地震及西侧的第10、11号地震的应变花则为近EW或NE-SW向挤压白瓣形态,表明该断层西侧的发震构造尽管仍呈纯挤压变形特征,但挤压方向在断层两侧呈现较大差异.因该断层西侧目前的地震样本太少,造成这种差异的原因尚无法确定,有待积累更多的资料后深入分析.
荣县—威远—资中地震密集活动区也是四川盆地页岩气生产区.中国石油西南油气田公司于2009年12月在威远部署了国内第一口页岩气评价井,即威201井,2010年11月投产,初期日产2000 m3;2014年“威远—长宁页岩气示范区”建产(姜磊,2014),同年底开始规模化水压致裂.已有研究表明,包括盐矿开采和页岩气水压致裂在内的工业流体注入能显著改变当地的构造应力环境,在一定条件下,流体的注入可能使过去不活动的老断层重新活化或者不成熟断层发生破裂,从而激发大量地震(张致伟等,2012;Ellsworth, 2013; Ellsworth et al., 2019;雷兴林等,2014;McNamara et al., 2015; Shapiro, 2015;Li et al., 2015, 2016, 2017;Chen et al., 2017;Sun et al., 2017; Wang et al., 2017;Zhai et al., 2017; Pei et al., 2018;Schultz et al., 2018;Lei et al., 2013, 2017, 2019a, 2019b;Jia et al., 2020).微地震监测显示断层的激活和水力压裂操作具有同步性(陈朝伟等,2019).本文的研究结果显示荣县—威远—资中地区MS≥3.0地震的震源机制解具有很好的一致性(图 7),表明荣县—威远—资中地区的地震发生在大致相同的构造应力环境(图 11),未观测到类似长宁—兴文盐矿开采区震源机制发散的现象(朱航和何畅,2014),推测两个地区震源机制特征存在明显差异的原因可能与长宁—兴文地区经历了多期构造变形造成不同产状断层并存有关(王适择,2014;Lei et al., 2019a, 2019b;易桂喜等,2019;Lei et al., 2020; Long et al., 2020),也反映了荣县—威远—资中地区的发震构造与构造应力场环境较地处盆山结合部位的长宁—兴文地区相对简单,进而反映这两个区域经历的构造运动和变形程度存在较大差异.最新研究显示,对于发生在四川盆地的4级以上地震,尚未发现诱发地震与天然地震在地震学特征上有明显差异(Lei et al., 2020).因此,尽管荣县—威远—资中地区的地震活动增加与页岩气规模开采时间准同步(图 2),但该区地震活动与页岩气开采到底存在怎样的关系以及在何种条件下可能导致老断层活化等问题必须在充分了解深部构造展布、生产井位分布、压裂时间进程及流体注入等相关信息的基础上,通过数字模拟试验等进行分析研究.
5 结论与认识基于四川区域地震台网宽频带地震仪记录的波形资料,利用CAP波形反演方法,获得了四川盆地中西部荣县—威远—资中地区2016年以来26个MS≥3.0地震的震源机制解、震源矩心深度和矩震级.初步分析了其发震构造几何结构特征、运动学特征以及孕震区构造变形特征与区域构造应力场特征,同时,对该区域地震不同震级标度之间的关系进行了初步探讨.获得的主要认识与结论有:
(1) 26个MS≥3.0地震的震源矩心深度在1.5~5 km之间,平均深度3.4 km,表明该区域地震全部发生在上地壳浅部5~7 km滑脱层之上.位于威远东侧的地震震源相对较深,平均震源深度约4.4 km,西侧地震平均震源深度3.0 km,显示荣县—威远—资中地区MS≥3.0地震震源存在东深、西浅的空间差异.震源深度剖面揭示发震断层面倾向SE,缓倾角.
(2) 26个地震的震源机制解全部为逆冲型,揭示荣县—威远—资中地区的发震构造整体为逆冲型断裂.节面走向优势方位NNE-NE/SSW-SW,其倾向SE的节面走向与倾角均值分别为26°、33°,倾向NW的节面走向与倾角均值约203°、57°,与区内已知断层几何结构特征不符.结合震源深度剖面图,推测荣县—威远—资中地区的主要发震构造可能是发育在威远背斜南翼的一系列倾向SE、走向NNE~NE的缓倾角盲冲断层.
(3) 26个地震的P、T、B轴优势方位单一,表明荣县—威远—资中地区处于相对简单的构造应力环境.区域应力场反演获得的最大主压应力轴σ1方位NW-SE,近水平,与目前已知的该研究区构造应力场水平主压应力方向一致,反映该区域发震断层活动主要受区域构造应力场控制.荣县—威远—资中地区最大主压应力轴方位明显有别于四川盆地南缘2019年6月17日长宁MS6.0地震余震区的NE-SW向最大主压应力轴,揭示四川盆地构造应力场具有明显的分区特征.
(4) 26个MS≥3.0地震整体的应变花呈NW-SE向挤压白瓣形态,揭示荣县—威远—资中地区的发震构造呈NW-SE向纯挤压变形模式,明显有别于四川盆地南缘长宁地震余震区NE-SW向挤压兼具小量NW-SE向拉张分量的构造变形模式,揭示四川盆地构造变形模式具有明显的分区特征.
(5) 荣县—威远—资中地区MS≥3.0地震的实测震级ML与MW具有较明显差异,且这种差异存在随震级增大而增大的趋势.
致谢 应变花计算程序由法国巴黎地球物理研究所Yann Klinger教授和Amaury Vallage博士提供.CAP程序由美国圣路易斯大学的朱露培教授提供.部分图件采用GMT软件绘制.与中国地震局地球物理研究所刘瑞丰研究员就震级测定及不同震级标度之间的关系问题进行了较深入讨论,受益匪浅.审稿专家提出了宝贵的修改建议.在此一并致以衷心感谢.
Amelung F, King G. 1997. Large-scale tectonic deformation inferred from small earthquakes. Nature, 386(6626): 702-705. DOI:10.1038/386702a0 |
Chen X W, Nakata N, Pennington C, et al. 2017. The Pawnee earthquake as a result of the interplay among injection, faults and foreshocks. Scientific Reports, 7: 4945. DOI:10.1038/s41598-017-04992-z |
Chen Y T, Liu R F. 2004. Earthquake magnitude. Seismological and Geomagnetic Observation and Research (in Chinese), 25(6): 1-12. |
Chen Z W, Xiang D G, Zhang F S, et al. 2019. Fault slip and casing deformation caused by hydraulic fracturing in Changning-Weiyuan Blocks, Sichuan:Mechanism and prevention strategy. Petroleum Science Bulletin, 4(4): 364-377. DOI:10.3969/j.issn.2096-1693.2019.04.033 |
Deng B. 2013. Meso-Cenozoic Architecture of Basin-mountain system in the Sichuan Basin and its gas distribution[Ph. D. thesis] (in Chinese). Chengdu: Chengdu University of Technology.
|
Department of Earthquake Disaster Prevention, China Earthquake Administration. 1995. The Catalogue of Chinese Historical Strong Earthquakes (in Chinese). Beijing: Seismological Press.
|
Ellsworth W L. 2013. Injection-induced earthquakes. Science, 341(6142): 1225942. DOI:10.1126/science.1225942 |
Ellsworth W L, Giardini D, Townend J, et al. 2019. Triggering of the Pohang, Korea, earthquake (MW5.5) by enhanced geothermal system stimulation. Seismological Research Letters, 90(5): 1844-1858. DOI:10.1785/0220190102 |
Gephart J W, Forsyth D W. 1984. An improved method for determining the regional stress tensor using earthquake focal mechanism data:application to the San Fernando earthquake sequence. Journal of Geophysical Research:Solid Earth, 89(B11): 9305-9320. DOI:10.1029/JB089iB11p09305 |
Gu Z D, Yan S Y, Zhang B, et al. 2012. Triassic tectonic decoupling in weiyuan uplift (Sichuan) and its implications. Acta Scientiarum Naturalium Universitatis Pekinensis (in Chinese), 48(2): 262-272. |
Gutenberg B. 1945a. Amplitudes of surface waves and magnitudes of shallow earthquakes. Bulletin of the Seismological Society of America, 35(1): 3-12. |
Gutenberg B. 1945b. Amplitudes of P, PP, and S and magnitude of shallow earthquakes. Bulletin of the Seismological Society of America, 35(2): 57-69. |
Gutenberg B. 1945c. Magnitude determination for deep-focus earthquakes. Bulletin of the Seismological Society of America, 35(3): 117-130. |
Heidbach O, Rajabi M, Cui X F, et al. 2018. The World Stress Map database release 2016:Crustal stress pattern across scales. Tectonophysics, 744: 484-498. DOI:10.1016/j.tecto.2018.07.007 |
Hubbard J, Shaw J H. 2009. Uplift of the Longmen Shan and Tibetan plateau, and the 2008 Wenchuan (M=7.9) earthquake. Nature, 458(7235): 194-197. DOI:10.1038/nature07837 |
Jia D, Li Y Q, Lin A M, et al. 2010. Structural model of 2008 MW7.9 Wenchuan earthquake in the rejuvenated Longmen Shan thrust belt, China. Tectonophysics, 491(1-4): 174-184. DOI:10.1016/j.tecto.2009.08.040 |
Jia K, Zhou S Y, Zhuang J C, et al. 2020. Nonstationary background seismicity rate and evolution of stress changes in the Changning salt mining and shale-gas hydraulic fracturing region, Sichuan Basin, China. Seismological Research Letters, 91(4): 2170-2181. DOI:10.1785/0220200092 |
Jiang L. 2014. Research on the preservation conditions of lower Paleozoic shale gas in southern Sichuan under strong transformation[Ph. D. thesis] (in Chinese). Chengdu: Chengdu University of Technology.
|
Kanamori H. 1977. The energy release in great earthquakes. Journal of Geophysical Research, 82(20): 2981-2987. DOI:10.1029/JB082i020p02981 |
Lei X L, Ma S L, Chen W K, et al. 2013. A detailed view of the injection-induced seismicity in a natural gas reservoir in Zigong, Southwestern Sichuan Basin, China. Journal of Geophysical Research:Solid Earth, 118(8): 4296-4311. DOI:10.1002/jgrb.50310 |
Lei X L, Li X Y, Li Q, et al. 2014. Role of immature faults in injection-induced seismicity in oil/gas reservoirs-a case study of the Sichuan Basin, China. Seismology and Geology (in Chinese), 36(3): 625-643. |
Lei X L, Huang D J, Su J R, et al. 2017. Fault reactivation and earthquakes with magnitudes of up to MW4.7 induced by shale-gas fracking in the Sichuan Basin, China. Scientific Reports, 7: 7971. DOI:10.1038/s41598-017-08557-y |
Lei X L, Wang Z W, Su J R. 2019a. The December 2018 ML5.7 and January 2019 ML5.3 earthquakes in south Sichuan Basin induced by shale gas hydraulic fracturing. Seismological Research Letters, 90(3): 1099-1110. DOI:10.1785/0220190029 |
Lei X L, Wang Z W, Su J R. 2019b. Possible link between long-term and short-term water injections and earthquakes in salt mine and shale gas site in Changning, south Sichuan Basin, China. Earth and Planetary Physics, 3(6): 510-525. DOI:10.26464/epp2019052 |
Lei X L, Su J R, Wang Z W. 2020. Growing seismicity in the Sichuan Basin and its association with industrial activities. Science China:Earth Sciences. DOI:10.1007/s11430-020-9646-x |
Li X Y, Lei X L, Li Q, et al. 2015. Characteristics of acoustic emission during deformation and failure of typical reservoir rocks under triaxial compression:An example of Sinian dolomite and shale in the Sichuan Basin. Chinese Journal of Geophysics (in Chinese), 58(3): 982-992. DOI:10.6038/cjg20150323 |
Li X Y, Lei X L, Li Q. 2016. Injection-induced fracturing process in a tight sandstone under different saturation conditions. Environmental Earth Sciences, 75: 1466. DOI:10.1007/s12665-016-6265-2 |
Li X Y, Lei X L, Li Q, et al. 2017. Experimental investigation of Sinian shale rock under triaxial stress monitored by ultrasonic transmission and acoustic emission. Journal of Natural Gas Science and Engineering, 43: 110-123. DOI:10.1016/j.jngse.2017.03.035 |
Li Y Q. 2018. Geological architecture and formation mechanism of the transitional zone between Longmenshan Mountains and Sichuan Basin[Ph. D. thesis] (in Chinese). Beijing: China University of Geosciences (Beijing).
|
Liu R F, Chen Y T, Ren X, et al. 2015. Magnitude Measurement (in Chinese). Beijing: Seismological Press.
|
Liu R F, Wang Z B, Li Z, et al. 2020. How to use earthquake magnitude correctly. Seismological and Geomagnetic Observation and Research (in Chinese), 41(1): 1-7. |
Liu S G, Ma Y S, Sun W, et al. 2008. Studying on the differences of Sinian natural gas pools between Weiyuan gas field and Ziyang gas-brone area, Sichuan Basin. Acta Geologica Sinica (in Chinese), 82(3): 328-337. |
Long F, Wen X Z, Ruan X, et al. 2015. A more accurate relocation of the 2013 MS7.0 Lushan, Sichuan, China, earthquake sequence, and the seismogenic structure analysis. Journal of Seismology, 19(3): 653-665. DOI:10.1007/s10950-015-9485-0 |
Long F, Yi G X, Wang S W, et al. 2019. Geometry and tectonic deformation of the seismogenic structure for the 8 August 2017 MS7.0 Jiuzhaigou earthquake sequence, northern Sichuan, China. Earth and Planetary Physics, 3(3): 253-267. DOI:10.26464/epp2019027 |
Long F, Zhang Z W, Qi Y P, et al. 2020. Three dimensional velocity structure and accurate earthquake location in Changning-Gongxian area of southeast Sichuan. Earth and Planetary Physics, 4(2): 165-177. DOI:10.26464/epp2020022 |
Luo Y, Zhao L, Zeng X F, et al. 2015. Focal mechanisms of the Lushan earthquake sequence and spatial variation of the stress field. Science China Earth Sciences, 58(7): 1148-1158. DOI:10.1007/s11430-014-5017-y |
Lü J, Wang X S, Su J R, et al. 2013. Hypocentral location and source mechanism of the MS7.0 Lushan earthquake sequence. Chinese Journal of Geophysics (in Chinese), 56(5): 1753-1763. DOI:10.6038/cjg20130533 |
McNamara D E, Benz H M, Herrmann R B, et al. 2015. Earthquake hypocenters and focal mechanisms in central Oklahoma reveal a complex system of reactivated subsurface strike-slip faulting. Geophysical Research Letters, 42(8): 2742-2749. DOI:10.1002/2014gl062730 |
Meng L Y, McGarr A, Zhou L Q, et al. 2019. An Investigation of seismicity induced by hydraulic fracturing in the Sichuan Basin of China based on data from a temporary seismic network. Bulletin of the Seismological Society of America, 109(1): 348-357. DOI:10.1785/0120180310 |
Pei S P, Peng Z G, Chen X W. 2018. Locations of injection-induced earthquakes in Oklahoma controlled by crustal structures. Journal of Geophysical Research:Solid Earth, 123(3): 2332-2344. DOI:10.1002/2017jb014983 |
Qi Y P, Zhang Z W, Long F, et al. 2018. Earthquake focal mecanisms in the Daliangshan sub-block and adjacent areas and characteristics of the regional stress field. Seismology and Geology (in Chinese), 40(2): 377-395. |
Schultz R, Atkinson G, Eaton D W, et al. 2018. Hydraulic fracturing volume is associated with induced earthquake productivity in the Duvernay play. Science, 359(6373): 304-308. DOI:10.1126/science.aao0159 |
Shapiro S A. 2015. Fluid-Induced Seismicity. Cambridge: Cambridge University Press.
|
Sichuan Geology Bureau. 1980. Regional Geological Survey Report. (Suining, Zigong, Neijiang, Yibin and Luzhou Geological Map Sheet, 1: 200000). Chengdu: Sichuan Geology Bureau.
|
Sichuan Earthquake Administration. (2019-02-28). Intensity map of the MS4.7, MS4.3 and MS4.9 Rongxian earthquakes. http://www.scdzj.gov.cn/xwzx/fzjzyw/201902/t20190228_50987.html.
|
Sun X L, Yang P T, Zhang Z W. 2017. A study of earthquakes induced by water injection in the Changning salt mine area, SW China. Journal of Asian Earth Sciences, 136: 102-109. DOI:10.1016/j.jseaes.2017.01.030 |
Tan Y, Zhu L P, Helmberger D V, et al. 2006. Locating and modeling regional earthquakes with two stations. Journal of Geophysical Research:Solid Earth, 111(B1): B01306. |
Vallage A, Devès M H, Klinger Y, et al. 2014. Localized slip and distributed deformation in oblique settings:the example of the Denali fault system, Alaska. Geophysical Journal International, 197(3): 1284-1298. DOI:10.1093/gji/ggu100 |
Wang M, Shen Z K. 2020. Present-day crustal deformation of continental china derived from GPS and its tectonic implications. Journal of Geophysical Research:Solid Earth, 125(2): e2019JB018774. DOI:10.1029/2019JB018774 |
Wang M M, Jia D, Shaw J H, et al. 2014. The 2013 Lushan earthquake:Implications for seismic hazards posed by the Range Front blind thrust in the Sichuan Basin, China. Geology, 42(10): 915-918. DOI:10.1130/G35809 |
Wang P D, Wu D M, Chen Y T. 1988. Study on relationship among moment, magnitude, source size and stress drop. Crustal Deformation and Earthquake (in Chinese), 8(2): 109-123. |
Wang R J, Gu Y J, Schultz R, et al. 2017. Source characteristics and geological implications of the January 2016 induced earthquake swarm near Crooked Lake, Alberta. Geophys. J. Int., 201: 979-988. DOI:10.1093/gji/ggx204 |
Wang S Y. 1999. The Catalogue of Chinese Modern Earthquakes (in Chinese). Beijing: China Science and Technology Press.
|
Wang S Z. 2014. The tectonic characteristics of Changning area, south of Sichuan and crack characteristics of Longmaxi Formation of Silurian system[Master's thesis] (in Chinese). Chengdu: Chengdu University of Technology.
|
Xie Z J, Jin B K, Zheng Y, et al. 2013. Source parameters inversion of the 2013 Lushan earthquake by combining teleseismic waveforms and local seismograms. Science China Earth Sciences, 56(7): 1177-1186. DOI:10.1007/s11430-013-4640-3 |
Xie Z J, Zheng Y, Yao H J, et al. 2018. Preliminary analysis on the source properties and seismogenic structure of the 2017 MS7.0 Jiuzhaigou earthquake. Science China Earth Sciences, 61(3): 339-352. DOI:10.1007/s11430-017-9161-y |
Xu H L. 2012. The tectonic evolution of Leshan-Longnvsi paleo-uplift and its controlling effects upon gas reservoir forming in Sinian strata[Ph. D. thesis] (in Chinese). Beijing: China University of Geosciences (Beijing).
|
Xu R, Stamps D S. 2019. Strain accommodation in the Daliangshan Mountain area, southeastern margin of the Tibetan Plateau. Journal of Geophysical Research:Solid Earth, 124(9): 9816-9832. DOI:10.1029/2019JB017614 |
Yi G X, Long F, Vallage A, et al. 2016. Focal mechanism and tectonic deformation in the seismogenic area of the 2013 Lushan earthquake sequence, southwestern China. Chinese Journal of Geophysics (in Chinese), 59(10): 3711-3731. DOI:10.6038/cjg20161017 |
Yi G X, Long F, Liang M J, et al. 2017. Focal mechanism solutions and seismogenic structure of the 8 August 2017 M7.0 Jiuzhaigou earthquake and its aftershocks, northern Sichuan. Chinese Journal of Geophysics (in Chinese), 60(10): 4083-4097, doi: 10.6038/cjg20171033.
|
Yi G X, Long F, Liang M J, et al. 2019. Focal mechanism solutions and seismogenic structure of the 17 June 2019 MS6.0 Sichuan Changning earthquake sequence. Chinese Journal of Geophysics (in Chinese), 62(9): 3432-3447. DOI:10.6038/cjg2019N0297 |
Zhai H Y, Chang X, Wang Y B, et al. 2017. Sensitivity analysis of seismic velocity and attenuation variations for Longmaxi shale during hydraulic fracturing testing in laboratory. Energies, 10(9): 1393. DOI:10.3390/en10091393 |
Zhang Z, Zhang H, Wang L S, et al. 2019. Late Cenozoic structural deformation and evolution of the central-southern Longmen Shan fold-and-thrust belt, China:insights from numerical simulations. Journal of Asian Earth Sciences, 176: 88-104. DOI:10.1016/j.jseaes.2019.01.026 |
Zhang Z W, Cheng W Z, Liang M J, et al. 2012. Study on earthquakes induced by water injection in Zigong-Longchang area, Sichuan. Chinese Journal of Geophysics (in Chinese), 55(5): 1635-1645. DOI:10.6038/j.issn.0001-5733.2012.05.021 |
Zhao L S, Helmberger D V. 1994. Source estimation from broadband regional seismograms. Bulletin of the Seismological Society of America, 84(1): 91-104. |
Zheng Y, Ma H S, Lü J, et al. 2009. Source mechanism of strong aftershocks (MS ≥ 5. 6) of the 2008/05/12 Wenchuan earthquake and the implication for seismotectonics. Science in China Series D:Earth Sciences, 52(6): 739-753. DOI:10.1007/s11430-009-0074-3 |
Zheng Y, Ge C, Xie Z J, et al. 2013. Crustal and upper mantle structure and the deep seismogenic environment in the source regions of the Lushan earthquake and the Wenchuan earthquake. Science China Earth Sciences, 56(7): 1158-1168. DOI:10.1007/s11430-013-4641-2 |
Zhu H, He C. 2014. Focal mechanism Changing character of earthquake sequence induced by water injection:a case study of Changning sequence, Sichuan Province. Earth Science-Journal of China University of Geosciences (in Chinese), 39(12): 1776-1782. DOI:10.3799/dqkx.2014.161 |
Zhu L P, Helmberger D V. 1996. Advancement in source estimation techniques using broadband regional seismograms. Bulletin of the Seismological Society of America, 86(5): 1634-1641. |
陈运泰, 刘瑞丰. 2004. 地震的震级. 地震地磁观测与研究, 25(6): 1-12. |
陈朝伟, 项德贵, 张丰收, 等. 2019. 四川长宁-威远区块水力压裂引起的断层滑移和套管变形机理及防控策略. 石油科学通报, 4(4): 364-377. DOI:10.3969/j.issn.2096-1693.2019.04.033 |
邓宾. 2013.四川盆地中-新生代盆-山结构与油气分布[博士论文].成都: 成都理工大学.
|
谷志东, 闫淑玉, 张波, 等. 2012. 川中威远低缓隆起区三叠系地层中的构造解耦记录及其构造暗示. 北京大学学报(自然科学版), 48(2): 262-272. |
国家地震局震害防御司. 1995. 中国历史强震目录. 北京: 地震出版社.
|
姜磊. 2014.强改造作用下川南下古生界页岩气保存条件研究[博士论文].成都: 成都理工大学.
|
雷兴林, 李霞颖, 李琦, 等. 2014. 沉积岩储藏系统小断层在油气田注水诱发地震中的作用——以四川盆地为例. 地震地质, 36(3): 625-643. |
李英强. 2018.龙门山与四川盆地结合带的地质结构与成因机制[博士论文].北京: 中国地质大学(北京).
|
刘瑞丰, 陈运泰, 任枭, 等. 2015. 震级的测定. 北京: 地震出版社.
|
刘瑞丰, 王子博, 李赞, 等. 2020. 如何正确使用地震的震级. 地震地磁观测与研究, 41(1): 1-7. |
刘树根, 马永生, 孙玮, 等. 2008. 四川盆地威远气田和资阳含气区震旦系油气成藏差异性研究. 地质学报, 82(3): 328-337. |
罗艳, 赵里, 曾祥方, 等. 2015. 芦山地震序列震源机制及其构造应力场空间变化. 中国科学:地球科学, 45(4): 538-550. |
吕坚, 王晓山, 苏金蓉, 等. 2013. 芦山7.0级地震序列的震源位置与震源机制解特征. 地球物理学报, 56(5): 1753-1763. DOI:10.6038/cjg20130533 |
祁玉萍, 张致伟, 龙锋, 等. 2018. 大凉山次级块体及邻区震源机制解与区域应力场特征分析. 地震地质, 40(2): 377-395. |
四川省地质局. 1980.区域地质报告(遂宁幅、自贡幅、内江幅、宜宾幅、泸州幅).成都: 四川省地质局.
|
四川省地震局. (2019-02-28).四川荣县4.7、4.3和4.9级地震烈度图正式发布. http://www.scdzj.gov.cn/xwzx/fzjzyw/201902/t20190228_50987.html.
|
王培德, 吴大铭, 陈运泰. 1988. 地震矩、震级、震源尺度及应力降之间相互关系的研究. 地壳形变与地震, 8(2): 109-123. |
汪素云. 1999. 中国近代地震目录. 北京: 中国科学技术出版社.
|
王适择. 2014.川南长宁地区构造特征及志留系龙马溪组裂缝特征研究[硕士论文].成都: 成都理工大学.
|
许海龙. 2012.乐山-龙女寺古隆起构造演化及其对震旦系成藏的控制[博士论文].北京: 中国地质大学(北京).
|
易桂喜, 龙锋, Vallage A, 等. 2016. 2013年芦山地震序列震源机制与震源区构造变形特征分析. 地球物理学报, 59(10): 3711-3731. DOI:10.6038/cjg20161017 |
易桂喜, 龙锋, 梁明剑, 等. 2017. 2017年8月8日九寨沟M7.0地震及余震震源机制解与发震构造分析. 地球物理学报, 60(10): 4083-4097. DOI:10.6038/cjg20171033 |
易桂喜, 龙锋, 梁明剑, 等. 2019. 2019年6月17日四川长宁MS6.0地震序列震源机制解与发震构造分析. 地球物理学报, 62(9): 3432-3447. DOI:10.6038/cjg2019N0297 |
张致伟, 程万正, 梁明剑, 等. 2012. 四川自贡-隆昌地区注水诱发地震研究. 地球物理学报, 55(5): 1635-1645. DOI:10.6038/j.issn.0001-5733.2012.05.021 |
郑勇, 马宏生, 吕坚, 等. 2009. 汶川地震强余震(MS ≥ 5.6)的震源机制解及其与发震构造的关系. 中国科学D辑:地球科学, 39(4): 413-426. |
朱航, 何畅. 2014. 注水诱发地震序列的震源机制变化特征:以四川长宁序列为例. 地球科学-这个地质大学学报, 39(12): 1776-1782. |
 2020, Vol. 63

