南亚高压是位于青藏高原及邻近地区上空的深厚反气旋, 是夏季北半球对流层高层最稳定、强大的行星尺度环流系统(如:Flohn, 1957; 叶笃正等, 1957; Mason and Anderson, 1963; 叶笃正和张捷迁, 1974), 影响范围广阔, 也称之为亚洲季风高压或青藏高压, 是亚洲夏季风系统的主要成员之一, 其对中国的旱涝及亚洲大气环流演变具有重要影响(如:Tao and Chen, 1987; 胡景高等, 2010).目前, 已有不少学者对南亚高压的活动规律、结构特征和形成机制及其气候影响做了深入分析(如:Ye and Wu, 1998; 张琼等, 2000; Zhang et al., 2002; 刘伯奇等, 2009; 曾刚等, 2013; 彭丽霞等, 2016; Wang et al., 2016, 2017).
以往关于南亚高压强度变化的研究, 主要从非绝热加热、海温强迫、臭氧浓度等方面讨论其与南亚高压的联系.非绝热加热作为主要的能量来源影响大气运动和变化.南亚高压是由高原热力作用形成的环流系统, 不少学者就青藏高原热力作用展开研究(Ye, 1981;杨伟愚等, 1992; 吴国雄等, 1997; Duan and Wu, 2005).Qian等(2002)指出夏季强大的南亚高压主要与南亚地区的潜热和感热有关.雨季开始, 降水量较大, 凝结潜热的作用更为显著.刘伯奇等(2009)指出南亚高压的形成与亚洲南部大气非绝热加热状态的改变有关.大量研究表明, 非绝热加热对南亚高压的形成及维持具有显赫的作用, 也影响垂直速度在其内部不同位置的分布(Guo et al., 2020).此外, 海温等外强迫也对南亚高压的强度有影响.Qu和Huang(2012)发现热带印度洋海温强迫的作用, 使得对流层温度产生变化, 会影响南亚高压强度.曾刚等(2013)通过数值模拟揭示热带印度洋海温异常是南亚高压强度变化的关键因子, 偏暖的海温可以诱发偏强的南亚高压.
南亚高压作为深厚稳定的系统, 不仅影响了对流层的天气气候, 还对平流层的环流异常和大气成分产生重要影响.对流层水汽进入平流层, 也受南亚高压大尺度环流和其对流层顶的异常低温控制(王卫国等, 2010; 陈斌等, 2012).而平流层环流异常, 通过平流层-对流层耦合, 与对流层的天气和气候异常相联系(Hu et al., 2017, 2018; Rao and Ren, 2018; Zhang et al., 2016, 2018; Chen et al., 2019; Yu et al., 2018; Yu and Ren, 2019).此外, 该位置的臭氧低值区更是全球关注的问题.Reiter和Gao(1982)发现了与南亚高压相关联的青藏高原臭氧谷, Zou(1996)通过卫星资料证实了青藏高原臭氧谷的存在.此后的研究表明, 南亚高压的动力过程对上对流层和下平流层区(Upper Troposphere and Lower Stratosphere, UTLS)的臭氧低值形成起主要作用(Bian et al., 2011; Guo et al., 2012, 2017).周任君和陈月娟(2005)指出, 南亚高压增强时存在异常上升气流, 从而将下层低浓度臭氧含量的空气带入上层, 使得该层臭氧浓度减少.
南亚高压在气压场上, 是向上隆起的高压系统, 抬升了本地的对流层顶高度, 并影响了对流层顶附近的温度.从水平流场看, 是大尺度顺时针的反气旋环流, 而垂直速度场上, 通常认为是东侧上升而西侧下沉的不对称结构.以往研究中表征南亚高压强度指标的通常是局地气压或水平风场的异常, 而用对流层顶附近温度异常作为指标的很少见.其次, 南亚高压强度与其邻近地区的不对称分布的垂直速度是如何相互影响的?垂直速度可能是其他多种因子作用的后续体现, 在不同的时间尺度上, 是某地垂直速度影响大尺度南亚高压?还是南亚高压反馈到某地垂直速度?在以往讨论中涉及到两者关系时, 往往不区分时间尺度, 仅讨论二者的相关性, 这并不能说明它们之间的因果关系.因此, 本文首先讨论以温度异常表征南亚高压强度的合理性, 然后使用相关分析和信息流方法, 分析不同时间尺度上, 南亚高压强度与邻近地区局地垂直速度之间的因果联系, 为加深对南亚高压内部结构的认识提供依据.
1 资料和方法 1.1 资料本文采用欧洲中期天气预报中心(ECMWF)提供的1979—2018年6—8月的ERA-Interim再分析资料, 包括月平均和逐日两套再分析资料.变量有温度、位势及垂直速度.本文主要研究南亚高压所在的UTLS区, 因此垂直范围选用10层, 分别为300、250、225、200、175、150、125、100、70、50 hPa.
1.2 方法本文主要采用了Pearson相关系数、t检验、信息流因果分析、合成分析等方法对南亚高压强度及其与垂直速度的互相依赖关系等进行了研究.
以往研究多利用位势高度定义南亚高压的强度指数(张琼等, 2000; 覃皓等, 2018), 而本文从热力角度建立了一套新的表征南亚高压强度的指数, 即南亚高压温差指数, 其定义如下:(1)选取南亚高压UTLS区温度纬向偏差(某要素值与整个纬圈平均值的差值, 定义为纬向偏差, 可以消除因气候变化引起的全球性变化)的暖、冷中心所在气压层的典型温度异常等值线作为特征值(3 ℃和-3 ℃); (2)将南亚高压区范围内(30°E—120°E, 10°N—50°N)选定等压面所有大于(小于)特征值的格点温度异常与特征值做差后累加作为暖(冷)温度差值, 将其标准化后定义为暖(冷)温度指数; (3)将暖、冷温度差值相减后并标准化, 得到南亚高压温差指数, 从热力方面表征南亚高压强度.
为研究南亚高压邻近地区垂直速度与温差指数的相关性, 利用了Pearson相关系数方法, 它是反映变量之间相关程度的量, 相关系数绝对值越大表明变量之间的相关性越密切, 反之越弱.判断相关关系是否显著可以用t检验, 具体方法可参考(魏凤英, 2007).
相关系数只能判定变量之间的相关性, 存在局限性, 两者之间是否存在因果关系还需要用Liang Kleeman信息流方法(Liang, 2008, 2014)进行分析, 结合相关分析可以诊断要素之间的依赖和决定关系.信息流方法通过定量的将两个时间序列间传递的信息表征出来, 反映前者和后者之间因果关系的强弱.针对两个时间序列X1和X2, 后者到前者的单位时间信息流可表示如下:

|
其中, Cij表示Xi和Xj的样本协方差, Ci, dj表示Xi和

合成分析表征特殊年份某个变量的平均分布情况, 可以与反位相特殊年份的平均分布情况相比较, 也可以与气候平均态相比较, 分析特殊年份有何显著特征.本文利用合成分析讨论了南亚高压区上升运动异常偏强(弱)年南亚高压强度的变化, 并采用t检验对样本平均值差异做了显著性检验, 具体方法可参考(周航, 2014).
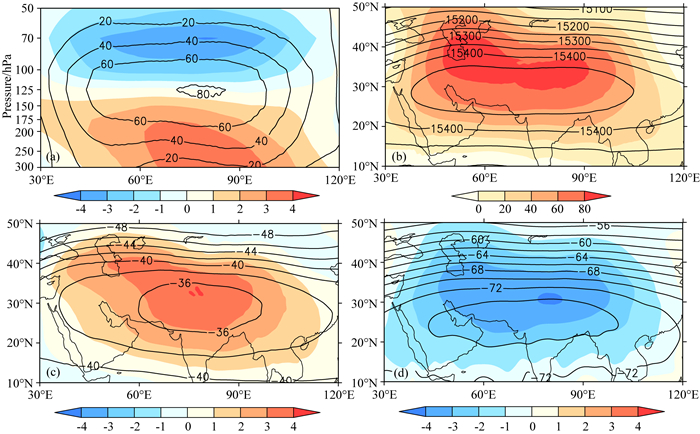
2 表征南亚高压强度的温差指数 2.1 南亚高压的热力结构南亚高压在气压场上, 是向上隆起的高压系统, 抬升了本地的对流层顶高度, 这影响了对流层顶附近的温度.在沿30°N的垂直剖面上, 位势高度的纬向偏差显示南亚高压的位势高度异常中心位于125 hPa, 位势高度纬向偏差值最大可达80 gpm(图 1a).而在异常位势高度的上、下方, 分别存在明显的异常偏冷和偏暖区域, 冷中心位于70 hPa, -3 ℃的温度负异常区跨越30个经度以上; 暖中心位于250 hPa, 存在较大范围3 ℃以上的温度正异常区.可见, 在南亚高压的对流层顶附近, 位势高度的最强中心125 hPa附近, 上方的冷中心位于70 hPa附近, 下方的暖中心位于250 hPa附近.其中, 位势高度及其纬向偏差图显示, 多年平均夏季南亚高压闭合的最大位势高度值在125 hPa达到15450 gpm(图 1b), 位势高度纬向偏差也有最大达80 gpm的闭合中心, 位置较高压中心位置偏北.而热力结构在250 hPa存在暖中心, 3 ℃的温度纬向偏差暖中心控制了青藏高原主体(图 1c).与此对应, 70 hPa存在冷中心, 温度纬向偏差负异常的位置稍偏北, -3 ℃的冷中心控制了青藏高原主体(图 1d).

|
图 1 1979—2018年6—8月气候平均的气象要素分布 (a)沿30°N温度(填色, 单位:℃)和位势高度(等值线, 单位: gpm)纬向偏差的垂直剖面; (b) 125 hPa位势高度(等值线, 单位:gpm)及其纬向偏差(填色, 单位: gpm); (c) 250 hPa温度(等值线, 单位: ℃)及其纬向偏差(填色, 单位: ℃); (d)同(c), 但为70 hPa情况. Fig. 1 The distributions of climatic meteorological factors in June, July and August (JJA) from 1979 to 2018 (a) Vertical section of the zonal deviations of temperature (shaded, unit:℃) and geopotential height (contours, unit: gpm) along 30°N; (b) Geopotential height (contours, unit: gpm) and its zonal deviation (shaded, unit: gpm) at 125 hPa; (c) Temperature (contours, unit:℃) and its zonal deviation (shaded, unit:℃) at 250 hPa; (d) Same as (c) but at 70 hPa. |
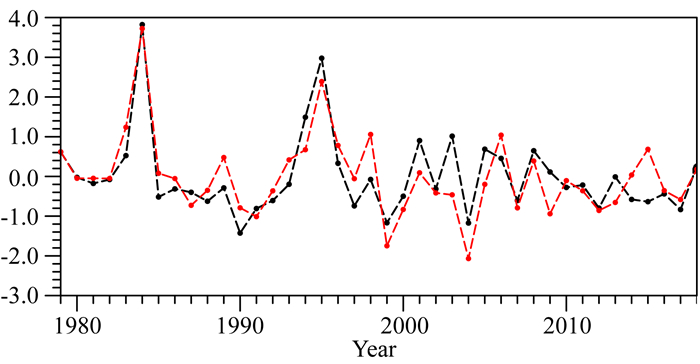
根据图 1的分析, 考虑南亚高压UTLS区上、下层的冷、暖中心的对称结构,尝试从热力异常角度建立一套新的南亚高压指数, 具体方法见1.2节对南亚高压温差指数的定义, 并和用位势高度定义的南亚高压指数对比.利用70 hPa(250 hPa)的温度纬向偏差与-3 ℃(3 ℃)特征值做差, 将小于(大于)零的格点差值累加并标准化, 得到1979—2018年的冷(暖)温度指数.南亚高压冷、暖温度指数呈现明显的反相关, 相关系数为-0.63, 并通过99.9%的信度检验, 这说明了两者的协同变化关系(亦见图 1a).因此, 利用暖、冷温度指数相减后并标准化, 得到南亚高压的温差指数, 能更全面地从热力方面表征南亚高压强度.从该指数与125 hPa(位势高度异常中心所在位置)位势高度指数(位势高度纬向偏差与60 gpm特征值做差, 将大于零的格点差值累加并标准化得到)随时间演变分布图看(图 2), 温差指数和位势高度指数的年际变率一致性很好, 两者的相关系数为0.82, 达到了99.9%置信水平.南亚高压温差指数和位势高度指数偏强年主要有1984、1995年, 偏弱年主要有1990、1991、1999、2004年等, 两者年际变化基本一致.对比两种南亚高压指数, 发现用热力异常定义的新指数有较好的效果.因此, 可以用南亚高压温差指数表征南亚高压强度.

|
图 2 1979—2018年南亚高压的温差指数(黑色)和位势高度指数(红色) Fig. 2 Temperature difference index (black) and geopotential height index (red) of the SAH from 1979 to 2018 |
已有的研究表明, 南亚高压是大尺度顺时针的反气旋环流, 而垂直速度场上, 通常认为是东侧上升而西侧下沉的不对称结构.那么, 南亚高压强度与其邻近地区的不对称分布的垂直速度是如何相互影响的?南亚高压的强度变化固然会影响到周边的垂直速度; 而垂直速度与对流加热有关, 热源强迫异常也是南亚高压变化的重要原因之一.因此, 南亚高压强度与其邻近地区的垂直速度, 是如何相互影响的, 它们之间的因果关系在不同的时间尺度上, 是否存在差异, 是个有待解决的问题.
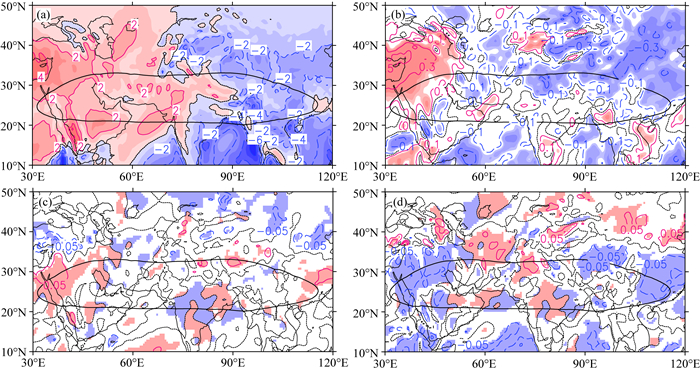
3.1 南亚高压强度对垂直速度的影响在上对流层(以200 hPa为例), 垂直速度在南亚高压的东部地区以上升运动为主, 而西部地区以下沉运动为主(图 3a).其中, 上升运动最强区位于南亚高压东南部, 与该位置显著的对流活动有关(Shi et al., 2018), 此外, 南亚高压偏东北部作为上升运动的次强区, 可能与夏季风降水有关, 而下沉运动最强位于南亚高压偏西北部的伊朗高原.在月时间尺度上, 南亚高压温差指数与垂直速度的相关系数分布表明(图 3b), 南亚高压西北部两者呈显著正相关, 东北部两者呈显著负相关, 且都通过了99%的信度检验.这说明南亚高压强度越强, 东北部的上升运动越强, 西北部的下沉越强, 但垂直运动和南亚高压之间的相互因果关系, 尚不明确.信息流分析可以明确两者之间存在因果关系, 信息流负值表示使预报趋于稳定, 而正值使其预报趋于不稳定, 因此信息流分析主要关注负值区域.在月时间尺度上, 垂直速度对南亚高压温差指数的信息流分布中, 负值且达到90%置信水平的区域较小, 且分布较零星(图 3c), 说明在月时间尺度上垂直速度对南亚高压强度的影响不显著.而南亚高压强度对垂直速度的信息流分布(图 3d)显示, 负值且达到90%置信水平的区域较大, 主要集中在南亚高压的东北部和西北部地区(与图 3b的相关系数显著区域一致), 说明这两个区域南亚高压强度对垂直速度的预报性较好, 即在月时间尺度上南亚高压强度主导了这两个区域的垂直速度.

|
图 3 1979—2018年6—8月200 hPa月时间尺度上的变量分布 (a)平均垂直速度(填色, 单位:10-2 Pa·s-1); (b)南亚高压温差指数和垂直速度的相关系数(填色由浅及深为通过90%、95%、99%信度检验); (c)垂直速度对南亚高压温差指数的信息流(填色区表示通过90%的信度检验); (d)南亚高压温差指数对垂直速度的信息流(填色区表示通过90%的信度检验).图中黑色粗实线为200 hPa南亚高压12510 gpm特征等值线. Fig. 3 Distributions of variables on monthly time scale at 200 hPa in JJA from 1979 to 2018 (a) Mean vertical velocity (shaded, unit: 10-2 Pa·s-1); (b) Correlation coefficient between temperature difference index and vertical velocity (the gradients from light to dark indicate the values pass 90%, 95% and 99% confidence levels, respectively); (c) The information flow from vertical velocity to temperature difference index (shaded areas indicate the values pass 90% confidence level); (d) The information flow from temperature difference index to vertical velocity (shaded areas indicate the values pass 90% confidence level).Black thick solid curves are characteristic 12510 gpm of the SAH at 200 hPa. |
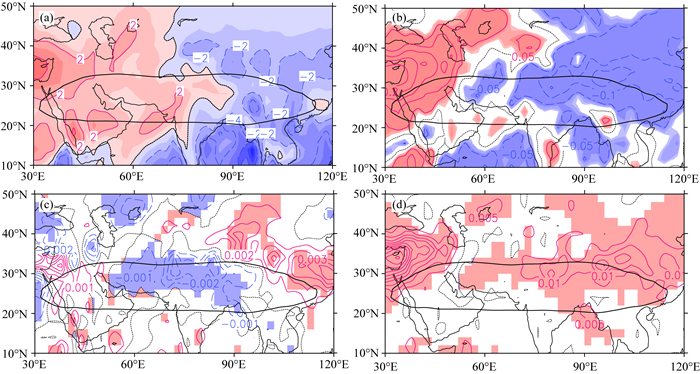
为进一步确定以200 hPa为代表的上对流层的分析是否合理, 可以进一步把该分析放到沿30°N的UTLS区垂直剖面图中进行讨论(图 4).在整个上对流层, 都有类似的结论, 在垂直方向上, 约90°E以东主要以上升运动为主, 以西以下沉运动为主, 且垂直速度随高度的增大而逐渐减小, 200 hPa是比较代表性的位置(图 4a).相关分布图上, 整个UTSL区90°E以东呈现负相关, 以东呈现正相关, 都达到99%信度水平(图 4b).垂直速度对南亚高压温差指数信息流分布图上(图 4c), 负值且通过了90%信度检验的区域小而不连续, 但南亚高压强度对垂直速度的信息流分布图中(图 4d), 南亚高压的东部和西部地区大范围呈负值且通过了90%信度检验, 说明南亚高压强度是垂直速度变化的原因, 可预报性较强.

|
图 4 同图 3, 但为沿30°N的垂直剖面图, 图中黑色粗实线为位势高度纬向偏差(单位: gpm) Fig. 4 Same as Fig. 3, but for vertical sections along 30°N, black thick solid curves are the zonal deviation of geopotential height (unit: gpm) |
可见, 在月时间尺度上, 南亚高压强度变化影响邻近地区的垂直速度, 当南亚高压强度增强(减弱), 导致了东部地区上升运动增强(减弱), 西部下沉运动增强(减弱), 这反映了南亚高压对周边大气的动力影响.
3.2 垂直速度对南亚高压强度的影响在月时间尺度上, 只发现了南亚高压强度对垂直速度的影响, 而反过来的影响不存在.但南亚高压本身的产生就与该区域大气加热异常相对应, 而其中的对流加热又与垂直速度密切相关, 因此, 究竟在什么时间尺度上, 垂直速度对南亚高压的强度有显著的影响呢?
在日时间尺度上, 南亚高压区UTLS的垂直速度分布, 东部以上升运动为主, 西部以下沉运动为主(图 5a, 6a), 该模态与月尺度一致.但在南亚高压温差指数与垂直速度的相关系数分布图上, 尽管南亚高压东部地区呈显著负相关, 西部地区为显著正相关, 都通过99%信度检验(图 5b, 6b), 但日时间尺度相比月时间尺度(图 6b对比图 4b), 通过检验的负相关区向西扩展了30个经度(50°E—80°E), 侵占了原正相关区.这表明, 该区域内两者的相关性, 对时间尺度的选取比较敏感.进一步分析日时间尺度的垂直速度对南亚高压温差指数的信息流分布, 发现南亚高压的中部的相关系数敏感区内, 存在较大范围的负值且通过了90%的显著性检验(图 5c, 6c), 说明敏感区内垂直速度对南亚高压强度的可预报性强, 也就是垂直速度的变化导致了南亚高压强度的变化.结合该区两者的负相关(图 5b, 6b), 说明南亚高压中部地区在日时间尺度上, 上升运动增强(减弱), 导致南亚高压强度增强(减弱), 而该关系在月时间尺度上不存在(图 3c, 4c).在日时间尺度上, 南亚高压强度对垂直速度的影响则不明显(图 5d, 6d中没有显著的大片负值区).

|
图 5 1979—2018年6—8月200 hPa日时间尺度上的变量分布 (a)平均垂直速度(填色, 单位:10-2Pa·s-1); (b)南亚高压温差指数和垂直速度的相关系数(填色由浅及深为通过90%、95%、99%信度检验); (c)垂直速度对南亚高压温差指数的信息流(填色区表示通过90%的信度检验); (d)南亚高压温差指数对垂直速度的信息流(填色区表示通过90%的信度检验).图中黑色粗实线为200 hPa南亚高压12510 gpm特征等值线. Fig. 5 Distributions of variables on daily time scale at 200 hPa in JJA from 1979 to 2018 (a) Mean vertical velocity (shaded, unit: 10-2 Pa·s-1); (b) Correlation coefficient between temperature difference index and vertical velocity (the gradients from light to dark indicate the values pass 90%, 95% and 99% confidence levels, respectively); (c) The information flow from vertical velocity to temperature difference index (shaded areas indicate the values pass the 90% confidence level); (d) The information flow from temperature difference index to vertical velocity (shaded areas indicate the values pass 90% confidence level).Black thick solid curves are characteristic 12510 gpm of the SAH at 200 hPa. |

|
图 6 同图 5, 但为沿30°N的垂直剖面图, 图中黑色粗实线为位势高度纬向偏差(单位: gpm) Fig. 6 Same as Fig. 5, but for vertical sections along 30°N, black thick solid curves are the zonal deviation of geopotential height (unit: gpm) |
为进一步讨论南亚高压中部关键区垂直速度变化对南亚高压强度的影响, 以1979—2018年的7月份为例, 对关键区(50°E—90°E, 25°N—35°N)内平均的垂直速度距平进行分析, 选取上升运动偏强年(1986、1990、1994、1998、2003)和偏弱年(1987、2002、2011、2012)进行合成分析.南亚高压中部关键区上升运动偏强年(图 7a), 通过95%信度检验的上升运动显著区主要位于关键区的东半部(打点区域), 对应合成的12560 gpm黑色等值线相对气候平均的红色等值线, 所围面积更大且位置偏西, 说明此时南亚高压强度偏强, 位置偏西.位势高度正异常大于10 gpm(黑色虚线)的区域大小和位置也说明了该特征, 通过了95%信度水平的正异常区主要位于关键区的西北侧(蓝色实线所含区域).而在中部关键区上升运动偏弱年(图 7b), 南亚高压强度偏弱, 位置偏东, 通过95%信度检验的上升运动偏弱区大体位于关键区中部, 位势高度小于-10 gpm的负异常显著性区域仍处于关键区西北侧且较偏强年范围更广.通常, 南亚高压被认为是局地的大气加热异常(特别是其东南侧的大规模对流活动)所产生的环流异常(刘屹岷等, 1999; 彭丽霞等, 2016), 而此处日时间尺度上垂直速度影响南亚高压强度, 却发生在南亚高压中部, 可能与高原中部的浅对流活动有关(见Shi et al., 2018中的图 5b).南亚高压东南侧大规模强盛的对流活动可以理解为相对少变稳定的气候背景, 而高原中部的浅对流尽管较弱, 但可能多变, 所以导致了在日时间尺度上, 高原中部与浅对流相关的垂直速度对高原强度的影响更大.而且, 高原中部关键区异常的垂直速度, 对应位于其西北侧的异常高压(图 7a, 7b中的黑色虚线), 考虑垂直结构后, 符合“Matsuno-Gill pattern”响应的位置分布, 也证明了关键区对流加热对南亚高压强度的作用.

|
图 7 (a) 1979—2018年7月200 hPa关键区上升运动偏强年的合成:异常垂直速度(填色, 单位: 10-2 Pa·s-1, 打点区通过95%的信度检验), 12560 gpm特征等值线(黑色实线)和10 gpm异常等值线(黑色虚线, 蓝色实线包围区通过95%的信度检验).红色实线为气候12560 gpm等值线, 方框区为南亚高压中部关键区; (b)同(a), 但为关键区上升运动偏弱年的合成, 位势高度异常(黑色虚线)仅给出-10 gpm等值线 Fig. 7 (a) Composite analysis of stronger ascending motion in the key region at 200 hPa in July from 1979 to 2018: vertical velocity anomaly (shaded, unit: 10-2 Pa·s-1, stippled regions are significant at the 95% confidence level), the characteristic contour of 12560 gpm (black solid) and the anomalous contours of 10 gpm (black dashed, areas enclosed by blue solid contours indicate the values pass 95% confidence level). Red solid contour is the climatic 12560 gpm, the box represents the key area in the central of the SAH; (b) Same as (a), but for composite analysis of weaker ascending motion in the key region, the anomalous contours of -10 gpm (black dashed) are given |
可见, 在日时间尺度上, 南亚高压中部UTLS的垂直速度变化, 影响了南亚高压的强度, 上升运动增强(减弱), 导致南亚高压强度增强(减弱).由于该垂直速度通常与高原中部的浅对流活动相联系, 这体现了大气对热源强迫的响应.
4 结论与讨论本文利用欧洲中期天气预报中心(ECMWF)提供的ERA-Interim再分析资料, 建立了表征南亚高压强度的温差指数, 并利用信息流方法讨论了南亚高压强度与邻近地区垂直速度的相互关系, 表明在不同时间尺度上, 两者的因果关系是不同的.主要结论如下:
(1) 南亚高压在UTLS区具有上冷下暖的热力结构, 以125 hPa为界, 最强冷、暖中心分别在70 hPa和250 hPa, 以这两层的冷、暖温度异常累加值之差建立的温差指数, 可以准确反映南亚高压的强度.
(2) 在月时间尺度上, 南亚高压强度是邻近地区垂直速度变化的重要原因, 当南亚高压强度增强(减弱)时, 其东部地区上升运动增强(减弱), 而西部地区下沉运动增强(减弱), 该影响可以覆盖到该区UTLS的大部分.这反映了南亚高压对周边大气的动力影响.
(3) 在日时间尺度上, 南亚高压中部的垂直速度是影响南亚高压强度变化的重要原因, 当南亚高压中部地区上升运动增强(减弱), 南亚高压强度增强(减弱), 位置偏西(东).由于该垂直速度与高原中部的浅对流活动相联系, 这体现了大气对热源强迫的响应.
影响南亚高压变化的外部因子很多, 而南亚高压本身的变化也会引起UTLS的水汽和臭氧等大气成分的变化, 这些变化也会再次反馈到南亚高压(Li et al., 2017; 覃皓等, 2018), 因此南亚高压的变化是很复杂的.本文仅从邻近地区垂直速度角度, 考虑其与南亚高压强度的关系, 而该垂直速度, 可能已经受诸多外部因子影响, 不一定是一个单纯的物理量.因此, 进一步理解该问题, 后期需要设计相关的数值模拟试验, 进行深入分析.此外, 南亚高压年际变化较大, 对于南亚高压强度异常偏强年(如1984、1995年)的形成原因和机制可以在后续工作中进一步研究.另外, 一种再分析资料的垂直速度可能存在一些不确定性, 后期可以结合更多的资料进一步分析和检验.
致谢 感谢ECMWF提供气象再分析数据.
Bian J C, Yan R C, Chen H B, et al. 2011. Formation of the summertime ozone valley over the Tibetan Plateau:The Asian summer monsoon and air column variations. Advances in Atmospheric Sciences, 28(6): 1318-1325. DOI:10.1007/s00376-011-0174-9 |
Chen B, Xu X D, Yang S, et al. 2012. On the characteristics of water vapor transport from atmosphere boundary layer to stratosphere over Tibetan Plateau regions in summer. Chinese Journal of Geophysics (in Chinese), 55(2): 406-414. DOI:10.6038/j.issn.0001-5733.2012.02.005 |
Chen D, Strube C, Ern M, et al. 2019. Global analysis for periodic variations in gravity wave squared amplitudes and momentum fluxes in the middle atmosphere. Annales Geophysicae, 37(4): 487-506. DOI:10.5194/angeo-37-487-2019 |
Duan A M, Wu G X. 2005. Role of the Tibetan Plateau thermal forcing in the summer climate patterns over subtropical Asia. Climate Dynamics, 24(7-8): 793-807. DOI:10.1007/s00382-004-0488-8 |
Flohn H. 1957. Large-scale aspects of the "summer monsoon" in South and East Asia. Journal of the Meteorological Society of Japan, 35A: 180-186. DOI:10.2151/jmsj1923.35A.0_180 |
Guo D, Wang P X, Zhou X J, et al. 2012. Dynamic effects of the South Asian High on the ozone valley over the Tibetan Plateau. Acta Meteorologica Sinica, 26(2): 216-228. DOI:10.1007/s13351-012-0207-2 |
Guo D, Su Y C, Zhou X J, et al. 2017. Evaluation of the trend uncertainty in summer ozone valley over the Tibetan Plateau in three reanalysis datasets. Journal Meteorological Research, 31(2): 431-437. DOI:10.1007/s13351-017-6058-x |
Guo D, Shen P, Shi C, et al. 2020. Calculation of the vertical velocity in the Asian Summer Monsoon anticyclone region using the thermodynamic method with in situ and satellite data. Frontiers in Earth Science, 8: 96. DOI:10.3389/feart.2020.00096 |
Hu D Z, Guan Z Y, Tian W S, et al. 2018. Recent strengthening of the stratospheric Arctic vortex response to warming in the central North Pacific. Nature Communications, 9(1): 1697. DOI:10.1038/s41467-018-04138-3 |
Hu J G, Zhou B, Tao L. 2010. Comparative analysis of the relation between characteristic parameters of South Asia high and summer precipitation of China. Meteorological Monthly (in Chinese), 36(4): 51-56. |
Hu J G, Li T, Xu H M, et al. 2017. Lessened response of boreal winter stratospheric polar vortex to El Niño in recent decades. Climate Dynamics, 49(1-2): 263-278. DOI:10.1007/s00382-016-3340-z |
Li Z K, Qin H, Guo D, et al. 2017. Impact of ozone valley over the Tibetan Plateau on the South Asian high in CAM5. Advances in Meteorology: 9383495. DOI:10.1155/2017/9383495 |
Liang X S. 2008. Information flow within stochastic dynamical systems. Physical Review E, 78(3Pt1): 031113. DOI:10.1103/PhysRevE.78.031113 |
Liang X S. 2014. Unraveling the cause-effect relation between time series. Physical Review E, 90(5): 052150. DOI:10.1103/PhysRevE.90.052150 |
Liu B Q, He J H, Wang L J. 2009. Characteristics of the South Asia high establishment processes above the Indo-China Peninsula from April to May and their possible mechanism. Chinese Journal of Atmospheric Sciences (in Chinese), 33(6): 1319-1332. DOI:10.3878/j.issn.1006-9895.2009.06.1 |
Liu Y M, Wu G X, Liu H, et al. 1999. The effect of spatially nonuniform heating on the formation and variation of subtropical high Part Ⅲ. Condensation heating and South Asia high and western Pacific subtropical high. Acta Meteorologica Sinica (in Chinese), 57(5): 525-538. DOI:10.11676/qxxb1999.051 |
Mason R B, Anderson C E. 1963. The development and decay of the 100-MB. Summertime anticyclone over southern Asia.. Monthly Weather Review, 91(1): 3-12. DOI:10.1175/1520-0493(1963)091<0003:TDADOT>2.3.CO;2 |
Peng L X, Sun Z B, Chen H S, et al. 2016. Analysis on the multi-center structure of summer South Asia high and its thermal influence factor. Chinese Journal of Atmospheric Sciences (in Chinese), 40(5): 1089-1106. DOI:10.3878/j.issn.1006-9895.1601.14310 |
Qian Y F, Zhang Q, Yao Y H, et al. 2002. Seasonal variation and heat preference of the South Asia high. Advances in Atmospheric Sciences, 19(5): 821-836. DOI:10.1007/s00376-002-0047-3 |
Qin H, Guo D, Shi C H, et al. 2018. The interaction between variations of South Asia high and ozone in the adjacent regions. Chinese Journal of Atmospheric Sciences (in Chinese), 42(2): 421-434. DOI:10.3878/j.issn.1006-9895.1710.17159 |
Qu X, Huang G. 2012. An enhanced influence of tropical Indian Ocean on the South Asia high after the late 1970s. Journal of Climate, 25: 6930-6941. DOI:10.1175/JCLI-D-11-00696.1 |
Rao J, Ren R C. 2018. Varying stratospheric responses to tropical Atlantic SST forcing from early to late winter. Climate Dynamics, 51(5-6): 2079-2096. DOI:10.1007/s00382-017-3998-x |
Reiter E R, Gao D Y. 1982. Heating of the Tibet Plateau and movements of the South Asian High during spring. Monthly Weather Review, 110(11): 1694-1711. DOI:10.1175/1520-0493(1982)110<1694:HOTTPA>2.0.CO;2 |
Shi C H, Chang S J, Guo D, et al. 2018. Exploring the relationship between the cloud-top and tropopause height in boreal summer over the Tibetan Plateau and its adjacent region. Atmospheric and Oceanic Science Letters, 11(2): 173-179. DOI:10.1080/16742834.2018.1438738 |
Tao S, Chen L. 1987. A review of recent research on the East Asian summer monsoon in China.//Chang C P, Krishnamurti T N. Monsoon Meteorology. Oxford: Oxford University Press, 60-92.
|
Wang L J, Guo S H, Ge J. 2016. The timing of South-Asian high establishment and its relation to tropical Asian summer monsoon and precipitation over east-central China in summer. Journal of Tropical Meteorology, 22(2): 136-144. |
Wang L J, Dai A G, Guo S H, et al. 2017. Establishment of the South Asian high over the Indo-China Peninsula during late spring to summer. Advances in Atmospheric Sciences, 34(2): 169-180. DOI:10.1007/s00376-016-6061-7 |
Wang W G, Zuo Q J, Wang H Y, et al. 2010. The structure of O3/H2O mixing relationships in the tropopause transition layer in middle and high latitudes of the Northern Hemisphere. Chinese Journal of Geophysics (in Chinese), 53(12): 2805-2816. DOI:10.3969/j.issn.0001-5733.2010.12.003 |
Wei F Y. 2007. Modern Climate Statistical Diagnosis and Prediction Technology (in Chinese). 2nd ed. Beijing: China Meteorological Press..
|
Wu G X, Li W P, Guo H, et al. 1997. Sensible heat driven air-pump over the Tibetan Plateau and its impacts on the Asian summer monsoon.//Ye D Z. Collections on the Memory of Zhao J Z (in Chinese). Beijing: Science Press, 116-120.
|
Yang W Y, Ye D Z, Wu G X. 1992. The influence of the Tibetan Plateau on the summer thermal and circulation fields over East Asia, Ⅲ:Physical mechanisms of maintaining the stable circulation fields. Chinese Journal of Atmospheric Sciences (in Chinese), 16(4): 409-426. |
Ye D Z, Luo S W, Zhu B Z. 1957. The wind structure and heat balance in the lower troposphere over Tibetan Plateau and its surrounding. Acta Meteorologica Sinica (in Chinese), 28(2): 108-121. DOI:10.11676/qxxb1957.010 |
Ye D Z, Zhang J Q. 1974. Simulation experiment of the impact of the Tibetan Plateau heating on the East Asian summer monsoon. Scientia Sinica (in Chinese), (3): 301-320. |
Ye D Z. 1981. Some characteristics of the summer circulation over the Qinghai-Xizang (Tibet) Plateau and its neighborhood. Bulletin of the American Meteorological Society, 62(1): 14-19. DOI:10.1175/1520-0477(1981)062<0014:SCOTSC>2.0.CO;2 |
Ye D Z, Wu G X. 1998. The role of the heat source of the Tibetan Plateau in the general circulation. Meteorology and Atmospheric Physics, 67: 181-198. DOI:10.1007/BF01277509 |
Yu Y Y, Cai M, Ren R C, et al. 2018. A closer look at the relationships between meridional mass circulation pulses in the stratosphere and cold air outbreak patterns in northern hemispheric winter. Climate Dynamics, 51: 3125-3143. DOI:10.1007/s00382-018-4069-7 |
Yu Y Y, Ren R C. 2019. Understanding the variation of stratosphere-troposphere coupling during stratospheric northern annular mode events from a mass circulation perspective. Climate Dynamics, 53: 5141-5164. DOI:10.1007/s00382-019-04675-7 |
Zeng G, Bo Z K, Ni D H, et al. 2013. Comparison analysis of South Asia high intensity variation and its relation to SSTA in atmospheric multi-reanalysis data. Transactions of Atmospheric Sciences (in Chinese), 36(5): 577-585. DOI:10.3969/j.issn.1674-7097.2013.05.008 |
Zhang J K, Tian W S, Chipperfield M P, et al. 2016. Persistent shift of the Arctic polar vortex towards the Eurasian continent in recent decades. Nature Climate Change, 6(12): 1094. DOI:10.1038/NCLIMATE3136 |
Zhang J K, Tian W S, Xie F, et al. 2018. Stratospheric ozone loss over the Eurasian continent induced by the polar vortex shift. Nature Communications, 9(1): 206. DOI:10.1038/s41467-017-02565-2 |
Zhang Q, Qian Y F, Zhang X H. 2000. Interannual and interdecadal variations of the South Asia high. Chinese Journal of Atmospheric Sciences (in Chinese), 24(1): 67-78. DOI:10.3878/j.issn.1006-9895.2000.01.07 |
Zhang Q, Wu G X, Qian Y F. 2002. The bimodality of the 100 hPa South Asia high and its relationship to the climate anomaly over East Asia in summer. Journal of the Meteorological Society of Japan, 80(4): 733-744. DOI:10.2151/jmsj.80.733 |
Zhou H. 2014. Relationships between summer South Asia high and both atmospheric circulation in northern hemisphere and precipitation over China[Master's thesis] (in Chinese). Nanjing: Nanjing University of Information Science & Technology.
|
Zhou R J, Chen Y J. 2005. Ozone variations over the Tibetan and Iranian Plateaus and their relationship with the South Asia High. Journal of University of Science and Technology of China (in Chinese), 35(6): 899-908. DOI:10.3969/j.issn.0253-2778.2005.06.027 |
Zou H. 1996. Seasonal variation and trends of TOMS ozone over Tibet. Geophysical Research Letters, 23(9): 1029-1032. DOI:10.1029/96GL00767 |
陈斌, 徐祥德, 杨帅, 等. 2012. 夏季青藏高原地区近地层水汽进入平流层的特征分析. 地球物理学报, 55(2): 406-414. DOI:10.6038/j.issn.0001-5733.2012.02.005 |
胡景高, 周兵, 陶丽. 2010. 南亚高压特征参数与我国夏季降水的关系分析. 气象, 36(4): 51-56. |
刘伯奇, 何金海, 王黎娟. 2009. 4-5月南亚高压在中南半岛上空建立过程特征及其可能机制. 大气科学, 33(6): 1319-1332. DOI:10.3878/j.issn.1006-9895.2009.06.1 |
刘屹岷, 吴国雄, 刘辉, 等. 1999. 空间非均匀加热对副热带高压形成和变异的影响Ⅲ:凝结潜热加热与南亚高压及西太平洋副高. 气象学报, 57(5): 525-538. DOI:10.11676/qxxb1999.051 |
彭丽霞, 孙照勃, 陈海山, 等. 2016. 夏季南亚高压多中心特征及其热力影响因子分析. 大气科学, 40(5): 1089-1106. DOI:10.3878/j.issn.1006-9895.1601.14310 |
覃皓, 郭栋, 施春华, 等. 2018. 南亚高压与邻近地区臭氧变化的相互作用. 大气科学, 42(2): 421-434. DOI:10.3878/j.issn.1006-9895.1710.17159 |
王卫国, 左群杰, 王颢樾, 等. 2010. 北半球中高纬度对流层顶转换层中O3/H2O混合关系的结构形态. 地球物理学报, 53(12): 2805-2816. DOI:10.3969/j.issn.0001-5733.2010.12.003 |
魏凤英. 2007. 现代气候统计诊断与预测技术. 2版. 北京: 气象出版社.
|
吴国雄, 李伟平, 郭华等. 1997.青藏高原感热气泵和亚洲夏季风.//叶笃正.赵九章诞辰九十周年纪念文集.北京: 科学出版社, 116-120.
|
杨伟愚, 叶笃正, 吴国雄. 1992. 夏季青藏高原热力场和环流场的诊断分析Ⅲ:环流场稳定维持的物理机制. 大气科学, 16(4): 409-426. |
叶笃正, 罗四维, 朱抱真. 1957. 西藏高原及其附近的流场结构和对流层大气的热量平衡. 气象学报, 28(2): 108-121. |
叶笃正, 张捷迁. 1974. 青藏高原加热作用对夏季东亚大气环流影响的初步模拟实验. 中国科学, (3): 301-320. |
曾刚, 伯忠凯, 倪东鸿, 等. 2013. 多套大气再分析资料的南亚高压强度变化特征及其与海表温度异常关系的比较分析. 大气科学学报, 36(5): 577-585. DOI:10.3969/j.issn.1674-7097.2013.05.008 |
张琼, 钱永甫, 张学洪. 2000. 南亚高压的年际和年代际变化. 大气科学, 24(1): 67-78. DOI:10.3878/j.issn.1006-9895.2000.01.07 |
周航. 2014.夏季南亚高压与北半球大气环流和中国降水的关系[硕士论文].南京: 南京信息工程大学.
|
周任君, 陈月娟. 2005. 青藏高原和伊朗高原上空臭氧变化特征及其与南亚高压的关系. 中国科学技术大学学报, 35(6): 899-908. DOI:10.3969/j.issn.0253-2778.2005.06.027 |
 2020, Vol. 63


