2. 中国科学院比较行星学卓越创新中心, 合肥 230026;
3. 中国气象局国家空间天气监测预警中心, 北京 100081
2. Chinese Academy of Sciences Center for Excellence in Comparative Planetology, Hefei 230026, China;
3. Key Laboratory of Space Weather, National Center for Space Weather, China Meteorological Administration, Beijing 100081, China
2012年发射的范艾伦探测双星的主要目标是理解电子在辐射带中的加速和损失机制.由理论研究可知,辐射带电子加速的两个主要机制是径向扩散和局地加速(Reeves et al., 2013).波粒相互作用导致的局地加速能快速加速相对论电子(Thorne et al., 2013),同时也能导致辐射带电子的损失(Thorne,2010;Gu et al., 2020).为了明晰辐射带电子加速与损失过程的内在物理机制,需要辨别绝热过程和非绝热过程带来的影响.因此,通常以三个绝热不变量(μ,K,L*)构成相空间坐标系,通过将电子通量数据转化为电子相空间密度(PSD)数据来研究辐射带电子的加速和损失机制.
已有众多工作对辐射带电子的加速及损失机制进行了研究(Iles et al., 2006;Kim et al., 2010;Turner et al., 2012b;Ni et al., 2013, 2015, 2017, 2019, 2020;Cao et al., 2017;Xiang et al., 2017, 2020;Zhao et al., 2019;Fu et al., 2020).Selesnick等(1997)发现辐射带电子PSD的径向梯度与μ有关.Chen等(2005)、Turner和Li(2008)的研究发现,μ值大约在200 MeV/G,是电子PSD正梯度和负梯度的转折点.Boyd等(2014)发现不同能量(或不同μ值)的电子PSD径向梯度可以区分磁尾电子的径向扩散和局地加速效应.在利用范艾伦卫星研究电子PSD梯度随着时间的演变特性时,他们发现了“种子电子”(seed population)的存在,并分析了其在局地加速过程中扮演的角色.在损失机制方面,Turner等(2012a)的研究表明2011年1月6日电子的耗散主要是向外径向扩散的结果而不是大气沉降,而Shprits等(2016)的研究结合2013年1月17日电子通量投掷角分布的模拟和观测,发现Electromagnetic Ion Cyclotron(EMIC)波造成的电子投掷角散射是超相对论电子的主要损失机制.Zhang等(2016)比较了2014年2月27日模拟结果和电子投掷角分布,认为该事件中辐射带相对论电子损失也是由于EMIC波导致的.Xiang等(2017)的研究进一步揭示了辐射带电子的损失机制主要有三种:磁层顶阴影、大气沉降以及两者兼之.他们利用了范艾伦卫星的粒子和波动观测数据对三个典型辐射带电子快速损失事件进行了详细研究,确定磁层顶阴影效应和大气沉降的作用在电子损失中的相对贡献.
随着卫星数据和数值模型的不断更新,多卫星的同时观测为深入研究地球辐射带动态变化规律创造了有利条件(Ni et al., 2009b;Xiang et al., 2016).本文利用两颗范艾伦卫星和三颗GPS导航卫星(ns65,ns63,ns62)在2013年3月的辐射带电子通量数据,开展辐射带电子PSD径向分布的细致研究,具体分析3月17日磁暴期间辐射带电子的加速和损失过程与物理机制.
1 卫星数据和PSD计算方法 1.1 范艾伦卫星数据范艾伦双星于2012年8月发射,运行在倾角为10°的椭圆轨道,其近地点约600 km,远地点距地心5.8RE(RE为地球半径).每颗卫星的轨道周期为9 h,远短于辐射带对磁暴的响应时间(1天),为更准确地分析和研究磁暴对地球辐射带的影响提供了方便.
范艾伦双星上的高能粒子、成分分析与热等离子体(ECT,Energetic Particle,Composition,and Thermal Plasma)单元,主要功能是测量辐射带各种带电粒子的速度、方向及等离子体成分.磁化电子离子分光仪(MagEIS,The Magnetic Electron Ion Spectrometer)和相对论电子质子探测器(REPT,Relativistic Electron Proton Telescope)是ECT单元里的仪器.MagEIS仪器的能级测量范围大约在20 keV~4 MeV(后文计算PSD时只取用了 < 2 MeV能级的电子通量数据,以保证数据质量),仪器中心对应的投掷角范围为8°~172°.REPT仪器的能级测量范围大约在1.8 MeV~20 MeV,仪器中心对应的投掷角范围为5°~175°.MagEIS和REPT数据的时间测量精度大约为11 s,更多有关MagEIS和REPT的介绍详见文献(Tuszewski et al., 2004;Baker et al., 2012;Spence et al., 2013).
1.2 GPS卫星数据GPS(Global Positioning System)卫星又称为全球定位卫星.在中低轨道目前已经有超过30颗GPS卫星在运行.这些卫星分布在六个轨道面,每个轨道近乎圆形,轨道面倾角为55°,每颗卫星运行在高度约为20200 km处,周期为12 h.
GPS平台上最常用的高能粒子设备是CXD(Los Alamos National Laboratory Combined X-ray Dosimeter)仪器.自2000年起,GPS卫星上就配备了LANL CXD和BDD-IIR(Burst Detector Dosimeter for Block II-R)仪器.截至2017年,31颗运行的GPS卫星中有21颗安装了CXD仪器,2颗装备了BDD-IIR仪器.CXD仪器用两个传感器来测量电子,其中低能粒子传感器提供120 keV以上的5个电子能量通道,高能粒子传感器提供1.3 MeV以上的6个电子能量通道.因此,CXD测量电子的能量范围是120 keV~ 5 MeV,共11个能量通道.BDD-IIR仪器测量电子的能量范围是77 keV~5 MeV,共8个能量通道.更多有关GPS卫星的介绍请参照文献(Cayton et al., 1998;Morley et al., 2016).
1.3 TS04磁场模型与ONERA程序库TS04模型(Tsyganenko 04 storm time model)是关于内磁层的暴时地磁场动态模型,它是基于1996—2000年期间37次磁暴事件的磁力计数据和相应的太阳风和行星际磁场的数据统计分析模拟得到.
利用太阳风参数Bx,By,Bz,太阳风速度Vsw,太阳风动压Pdyn,AE指数,Dst指数,计算模型参数G1~G3和W1~W6 (Tsyganenko,2002;Tsyganenko and Sitnov,2005).其中太阳风参数来源于OMNIWEB网站上1 min精度的数据,OMNIWEB的数据说明详见网址https://omniweb.gsfc.nasa.gov.基于以上得到的参数,利用ONERA程序库可以计算得到TS04模型下的第二与第三绝热不变量(K,L*)和背景磁场B,其中K的值与时间和投掷角有关,而L*的值是关于时间和投掷角的二维函数,B为背景磁场,它的值与时间有关.
1.4 PSD的计算借鉴Ni等(2009a)文中利用Akebono和CRRES卫星数据计算电子PSD的方法,本文首先确定三个绝热不变量(μ,K,L*)对应的相空间坐标.μ是第一绝热不变量,其定义为:

|
(1) |
其中p⊥是粒子动量在垂直磁场方向的分量, m0是电子静质量,B是当地磁场强度.μ与电子的回旋运动有关.
第二绝热不变量J通常用K来代替,因为K只与背景磁场的强度和结构有关,与带电粒子质量和电荷数无关,更方便计算,其定义为:

|
(2) |
其中m下标表示磁镜点,Bm和B(s)分别是磁镜点和s位置的背景磁场强度,积分上下限表示在两镜像点沿场线积分.K与电子的弹跳运动有关.
第三绝热不变量Φ,是带电粒子漂移壳围绕的磁通量,通常用更直观“广义L值”,即L*(Roederer,1970)来代替,其定义为:

|
(3) |
其中k0是地球磁偶矩.在偶极子场中,L与L*的值相同,在非偶极子场中,L*更适合表征带电粒子的漂移壳信息.
确定相空间坐标后,需要利用卫星测量的电子通量数据计算电子PSD.详细的计算过程包括:
(1) 以任意一个时间点进行分析:一个时间点对应着5°~90°这18个投掷角(投掷角间隔为5°).由于L*和K是关于时间t和投掷角α的二维函数,故每个投掷角对应着一个L*和K.
(2) 给定μ值和投掷角,可以确定每个投掷角对应的能量Ek如下:

|
(4) |
其中E0=m0c2,m0为电子静质量,c为光速.B为背景磁场值.
(3) 在两个相邻有效能量通道(该能级对应的电子通量数据有效)之间利用指数拟合来得到能量Ek对应的电子通量大小:

|
(5) |
其中参数a,b确定方法如下:由指数能谱假设,联立方程:

|
(6) |
其中Ech1和Ech2是相邻的有效能量通道,J(Ech1)和J(Ech2)是相邻的有效能量通道对应的电子通量.
(4) 把能量Ek对应的电子通量转换成PSD:

|
(7) |

|
(8) |
其中J(Ek)是电子通量,单位是(sr·s·cm2·MeV)-1,f是相空间密度,单位是
(5) 对于特定的K,在5°~90°投掷角对应的模型K中,利用线性插值得到特定K对应的PSD,L*,投掷角的值.
2 2013年3月电子损失事件的观测与分析在这一部分,我们将基于范艾伦双星和GPS卫星的同步观测数据,对2013年3月地球辐射带电子通量与相空间密度的时空变化现象进行详细研究,分析3月17日磁暴事件过程中辐射带电子的加速与损失机制.
图 1显示OMNIWEB数据库中给出的2013年3月1日至31日太阳风参数和地磁指数随时间的变化信息.图 1a—e分别为太阳风速度,行星际南北向磁场分量和太阳风动压,Dst指数,AE指数,Kp指数.从图 1中可以看出动压大幅增长发生在2013年3月17日大约09 : 18 UT左右;当太阳风动压大幅增长的时候,行星际磁场出现较强的南向分量,分量最低值大约在-18 nT左右;太阳风速度从400 km·s-1增长到700 km·s-1,由Dst指数、Kp指数可以看出,这段时间的地磁活动十分剧烈.在磁暴急始阶段,Dst指数接近50 nT,之后的磁暴主相阶段,Dst指数最小值低于-100 nT,确定此处有强磁暴发生(Gonzalez et al., 1994).反映亚暴活动的AE指数最高值超过了2000 nT,说明磁暴发生的同时伴随有强烈亚暴事件.动压脉冲事件过后,太阳风动压迅速下降,太阳风速度减弱,但维持在较高水平.

|
图 1 2013年3月太阳风参数和地磁指数变化 Fig. 1 Variations of solar wind parameters and geomagnetic indices in March 2013 |
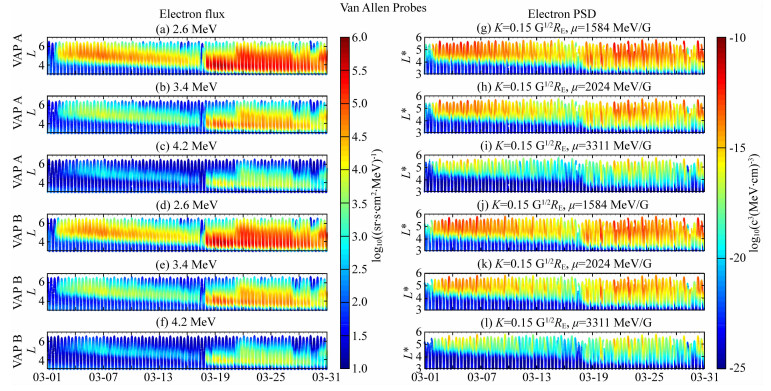
由图 1看出在2013年3月1日和3月17日分别发生了磁暴,且3月17日的磁暴强度远远超过3月1日的磁暴强度.图 2选取了2013年3月17日一次剧烈的磁暴(Dstmin=-137 nT)中的电子损失事件进行了研究,在2013年3月17日09 : 18 UT太阳风动压突然增加,太阳风动压的增加与行星际激波有关(Baker et al., 2014).图 2a—c分别展示的是2013年3月辐射带电子快速损失事件中,范艾伦A星观测到的三个能级(2.6 MeV,3.4 MeV,4.2 MeV)的电子通量随L和时间的变化情况,图 2d—f分别展示的是范艾伦B星观测到的三个能级(2.6 MeV,3.4 MeV,4.2 MeV)的电子通量随L和时间的变化情况.图 2a—f仅显示了90°局地投掷角的电子通量.从图中可以看出,在2013年3月17日~10 : 00整个外辐射带(从L=3到L>6)的相对论电子快速损失了.结合图中范艾伦A星、B星的观测结果,发现相对论电子在经历磁暴后,电子通量相对暴前有大幅上涨.图 2g—l展示的是TS04模型下利用范艾伦电子通量数据计算的PSD随L*和时间的变化情况.其中图 2g—i分别展示的是K=0.15 G1/2RE(对应着L=4时的电子投掷角为48.5°),μ=1584 MeV/G(对应着L=4时的电子能量为3.27 MeV),2024 MeV/G(对应着L=4时的电子能量为3.75 MeV),3311 MeV/G(对应着L=4时的电子能量为4.93 MeV),利用范艾伦A星通量数据计算的PSD随L*和时间的曲线.图 2j—l分别展示的是K=0.15 G1/2RE,μ=1584 MeV/G,2024 MeV/G,3311 MeV/G,利用范艾伦B星通量数据计算的PSD随L*和时间的曲线.基于范艾伦A,B星的PSD观测,发现μ越大,PSD值越小,因为μ与电子能量有关,对于能量越高的电子,其电子通量一般会越小,又因为电子能量高,由公式(7)可知对应的PSD值越小.结合范艾伦A,B双星的PSD变化趋势,发现高PSD区域逐渐向低L*扩散.在磁暴发生前,高PSD出现在较高的L*,而在磁暴发生后,高PSD几乎占领整个外辐射带(3 < L* < 6).从2013年3月2—17日这段时间可以看出,位于高L*的PSD,它的强度随时间推移逐渐减弱,说明在磁暴发生前,高L*区域的电子出现了损失.

|
图 2 范艾伦双星观测到的相对论电子通量时空变化以及对应的电子相空间密度随L*和时间的变化 Fig. 2 Variations of radiation belt relativistic electron flux versus L and time and corresponding variations of electron PSD versus L* and time based on in situ measurements from the twin Van Allen Probes |
图 3a1—a3分别反映的是K=0.15 G1/2RE,μ=1584 MeV/G,2024 MeV/G,3311 MeV/G时范艾伦A星的电子能量随时间的变化曲线.图 3b1—b3分别反映的是K=0.15 G1/2RE,μ=1584 MeV/G,2024 MeV/G,3311 MeV/G时范艾伦B星的电子能量随时间的变化曲线.图中展示了μ,K一定, 不同时刻的电子能量不同,且能量有周期性变化趋势.从能量变化图看,高μ值对应的能量曲线数据有缺失,这是由于在计算某些时刻的PSD时,高μ值计算得到的电子能量不在范艾伦卫星的有效能级范围内.图 3a4—a6,b4—b6反映的是电子投掷角随时间的变化.展示了μ,K一定的情况下,不同时刻的电子投掷角不同.同样,图 3a4—a6反映范艾伦A星的投掷角变化,图 3b4—b6反映范艾伦B星的投掷角变化.综上,可以知道,μ,K一定的情况下,电子能量和电子投掷角随着时间变化,呈现周期性变化趋势,故只研究某一个能级或某一个投掷角的电子通量变化趋势不能完整体现相空间坐标下PSD的变化趋势,因为在相空间坐标下,每一时刻计算PSD的电子通量都对应于不同能级和不同投掷角.

|
图 3 对于不同的第一、第二绝热不变量(μ,K)组合范艾伦A (红色曲线),B(蓝色曲线)星观测到的电子能量和投掷角随时间的变化 Fig. 3 Temporal variations of electron kinetic energy and pitch angle corresponding to the indicated pairs of the first and second adiabatic invariants for Van Allen Probes A (red curves) and B (blue curves) |
图 4清晰地展示了电子相空间密度在快速损失事件中的演化过程,并分析电子损失在不同K和μ值的差异性.由于范艾伦卫星数据精度高,为了更清晰地反映PSD的径向变化趋势,我们取范艾伦卫星的半轨道,对横轴上每0.1L*上的PSD作平均得到图 4a—d,i—l.图中给出了2013年3月16—18日,电子相空间密度随L*的径向剖面曲线在不同K和μ值的演化过程.图中的μ值从左到右分别为500 MeV/G(在偶极子场下L=4对应的电子能量为1.65 MeV), 1000 MeV/G(L=4对应的电子能量为2.5 MeV), 2024 MeV/G(L=4对应的电子能量为3.75 MeV)和3311 MeV/G(L=4对应的电子能量为4.92 MeV),K值为0.15 G1/2RE(L=4对应的电子赤道投掷角为48.5°).图中每条电子相空间密度曲线的开始时间以及对应的颜色列在了图 4的右侧.注意每一行的各子图纵坐标相同,每一列的各子图横坐标相同.图 4e—h,m—p分别给出了2013年3月16—18日,电子能量随L*的径向剖面曲线在不同K和μ值的演化过程,它展示了当μ,K一定时电子能量与L*成反相关.辐射带电子在磁暴事件前(即范艾伦A星2013年3月16日20 : 30前),PSD径向分布变化不大,在磁暴发生初期,不同K和μ值的电子相空间密度在高L*区域出现了PSD峰值(对应范艾伦A星3月16日20 : 30—3月17日01 : 00期间峰值,对应范艾伦B星3月16日19 : 30—3月17日00 : 00期间峰值),峰值位置大约在L*= 4.5~5之间.由文献(Green and Kivelson, 2004;Reeves et al., 2013)可知,PSD出现不断增长的峰值与电子的局地加速有关.由图 4a—d,i—l知,PSD径向梯度与μ有关:μ值越高,梯度越平缓,但峰值相较暴前越明显,说明高能电子的局部加速过程越显著.其后的磁暴发生期间,PSD峰值逐渐下降并消失,此时的PSD峰值下降是径向扩散损失造成的.又因为峰值下降的同时,高L*的PSD也在下降,说明有磁层顶阴影效应产生的电子损失.最终,消失的PSD峰值由于损失逐渐变成正梯度、单调增长的趋势(对应范艾伦A星3月17日10 : 00—14 : 30期间曲线,对应范艾伦B星3月17日09 : 00—13 : 30期间曲线),说明此时有向内的径向扩散发生.在磁暴恢复相及后期,PSD峰值在低L*重现,重现后的峰值位置相较之前的峰值位置向内移动.如果是扩散损失的话,峰值幅度应小于之前的暴时峰值,但是从图 4中发现在磁暴后(红线部分),暴后PSD峰值远超之前暴时PSD峰值.由此推断,峰值位置内移可能是等离子波的加速作用导致PSD增加.在μ值较大的情况下(图 4d和4l),3月17日期间PSD达到峰值后减小,是因为径向扩散导致的损失,而在3月18日,PSD增加且有峰值形成,这可能是等离子波对辐射带电子的局地加速效果.

|
图 4 对于不同的第一、第二绝热不变量(μ,K)组合范艾伦A,B星观测到的不同时间段内电子PSD与电子能量随L*的变化曲线(图例中标注的是每条曲线对应的起始时间) Fig. 4 Variations of electron PSD and kinetic energy versus L* corresponding to the indicated pairs of the first and second adiabatic invariants during the considered time intervals for Van Allen Probes A and B (The start time of each curve is indicated in the legend) |
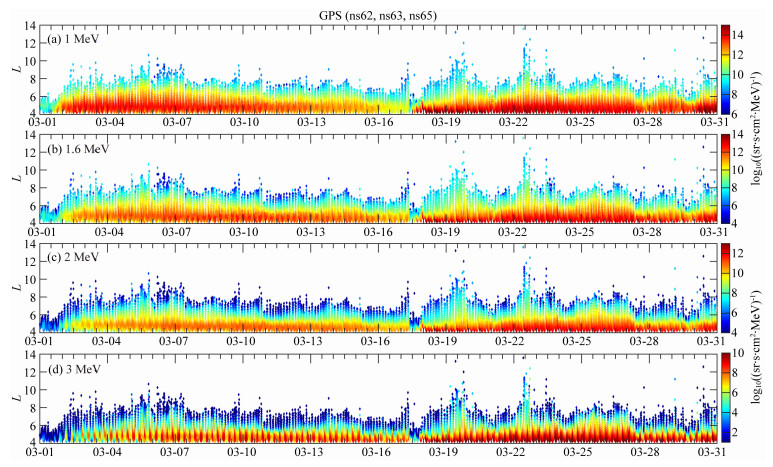
图 5显示了2013年3月1日至31日这一个月,三颗GPS卫星(ns62,ns63,ns65卫星)观测的电子通量随L和时间的变化情况.图 5从上到下的电子能级依次是:1 MeV,1.6 MeV,2 MeV,3 MeV.从图中可以看出,在2013年3月17日,外辐射带有明显的相对论电子和超相对论电子的快速损失.由图 1中3月1日期间,太阳风参数Dstmin介于-100~-50 nT,因此判断此时发生了中等磁暴.由GPS卫星通量观测,可知此处的电子通量低,在经历3月1日磁暴后发现电子通量增加,这与图 2中范艾伦A,B星的电子通量观测结果一致.结合图 2范艾伦双星和GPS卫星的观测,可以看到相对论电子和超相对论电子在经历3月17日磁暴后电子通量比暴前通量大,且在3月17日磁暴期间,多颗卫星都观测到明显的电子通量损失.

|
图 5 三颗GPS卫星(ns62,ns63,ns65)测量的辐射带相对论电子通量随L和时间的变化 Fig. 5 Variations of radiation belt relativistic electron flux measured by three GPS satellites (ns62, ns63, ns65) as a function of L-shell and time |
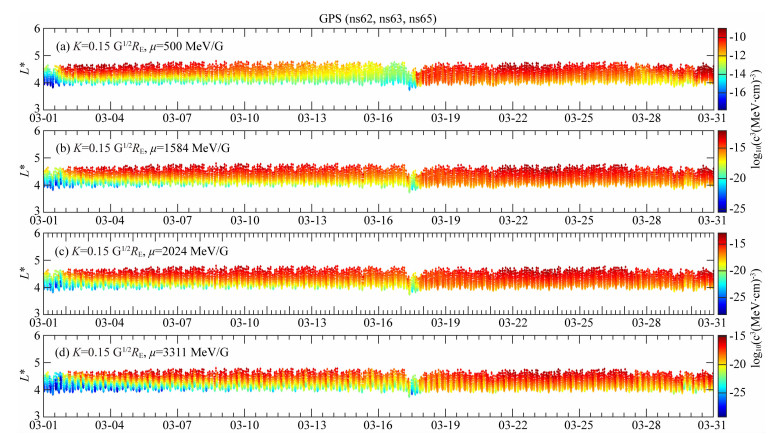
图 6显示了2013年3月1日至31日这一个月,利用TS04模型计算得到的三颗GPS卫星(ns62,ns63,ns65卫星)的PSD随L*和时间的变化情况.图 6中μ值从上到下分别为500 MeV/G, 1584 MeV/G, 2024 MeV/G和3311 MeV/G,K值为0.15 G1/2RE.图 6a中的低μ值意味着电子能量低.对于能量较低的电子,可以看出,磁暴前PSD有逐渐下降过程,而高μ值对应的电子,如图 6b—d所示,磁暴前PSD几乎不变,直到磁暴发生才有电子骤降过程.同样,与范艾伦卫星的PSD观测情况一致,磁暴前GPS卫星的高PSD值出现在相对较高的L*区域,磁暴期间PSD值出现明显骤降,而在磁暴后期及恢复相高PSD值占领整个GPS卫星观测的辐射带区域.

|
图 6 对于不同的第一、第二绝热不变量(μ,K)组合三颗GPS卫星(ns62,ns63,ns65)观测到的辐射带相对论电子PSD随L*和时间的变化 Fig. 6 Variations of radiation belt relativistic electron PSD measured by three GPS satellites (ns62, ns63, ns65) as a function of L* and time corresponding to the indicated pairs of the first and second adiabatic invariants |
本文结合范艾伦A,B双星上MagEIS和REPT仪器以及GPS三颗卫星(ns65,ns63,ns62)上CXD仪器测量的电子通量数据来研究磁暴期间外辐射带电子的通量分布和相空间密度分布,并分析2013年3月期间辐射带电子加速及损失过程对应的物理机制.由范艾伦卫星观测的电子通量分布和GPS卫星观测的电子通量分布可知,暴后通量远超暴前通量,说明3月17日磁暴是增强型磁暴(Gu et al., 2020).由于电子通量分布是按电子的能量或投掷角来划分的,不能反映真实的电子加速和损失情况,而通过绝热不变量组成的坐标系可以真实地表达电子的动态变化,其中绝热不变量与电子能量和投掷角之间满足一定的关系.当μ,K一定,不同时刻卫星的位置不同,对应的电子能量和投掷角显现出周期性变化趋势.
我们选取了2013年3月17日磁暴前、中、后不同时间段的电子相空间密度进行了细致研究.由PSD的径向分布在不同μ,K下的差异性可判断辐射带电子的加速和损失机制.由PSD径向分布可知PSD梯度与μ有关,μ越高,PSD曲线越平缓.由不断增强的PSD峰值可知有局部加速的存在,μ越高,峰值增强幅度越明显,说明高能电子的局部加速过程越显著;其后,由于太阳风动压脉冲压缩导致的磁层顶阴影效应与相关联的向外径向扩散损失导致磁暴期间的PSD峰值逐渐消失.随着峰值的完全消失,PSD径向分布呈现正梯度、单调增长的趋势,说明同时也有向内径向扩散发生.磁暴恢复相及暴后,PSD峰值在低L*区域又逐渐形成,因为暴后径向PSD峰值相比之前的峰值幅值高,说明等离子体波对辐射带电子的局地加速在其中起着重要作用.
综上所述,本文利用多颗卫星对磁暴期间辐射带电子PSD时空特性的观测,为判断辐射带电子加速和损失机制提供了重要依据.随着后续更多卫星数据的积累和完善,同时分析辐射带电子动量与电子PSD的时空动态变化规律,有望获得对辐射带电子动力学更精细的理解与认知.
致谢 感谢范艾伦卫星科研组提供数据.范艾伦卫星电子通量数据来源于(https://www.rbsp-ect.lanl.gov/data_pub/),GPS卫星数据来源于(https: //www.ngdc.noaa.gov/stp/space-weather/satellite-data/satellite-systems/gps/data/),地磁活动指数来自NASA OMNIWEB(https://omniweb.gsfc.nasa.gov).
Baker D N, Kanekal S G, Hoxie V C, et al. 2012. The Relativistic Electron-Proton Telescope (REPT) instrument on board the Radiation Belt Storm Probes (RBSP) spacecraft:Characterization of Earth's radiation belt high-energy particle populations. Space Science Reviews, 179(1-4): 337-381. |
Baker D N, Jaynes A N, Hoxie V C, et al. 2014. An impenetrable barrier to ultrarelativistic electrons in the Van Allen radiation belts. Nature, 515(7528): 186-190. DOI:10.1038/nature13956 |
Boyd A J, Spence H E, Claudepierre S G, et al. 2014. Quantifying the radiation belt seed population in the March 17, 2013 electron acceleration event. Geophysical Research Letters, 41(7): 2275-2281. DOI:10.1002/2014GL059626 |
Cao X, Ni B B, Summers D, et al. 2017. Bounce resonance scattering of radiation belt electrons by H+ band EMIC waves. Journal of Geophysical Research:Space Physics, 122(2): 1702-1713. DOI:10.1002/2016JA023607 |
Cayton T E, Drake D M, Spencer K M, et al. 1998. Description of the BDD-IIR: Electron and proton sensors on the GPS. Technical Report, LA-UR-98-1162, Los Alamos National Laboratory, doi: 10.2172/674727.
|
Chen Y, Friedel R H W, Reeves G D, et al. 2005. Multisatellite determination of the relativistic electron phase space density at geosynchronous orbit:Methodology and results during geomagnetically quiet times. Journal of Geophysical Research, 110(A10): A10210. DOI:10.1029/2004JA010895 |
Fu S, Yi J, Ni B B, et al. 2020. Combined scattering of radiation belt electrons by low-frequency hiss:Cyclotron, Landau, and bounce resonance. Geophysical Research Letters, 47(5): e2020GL086963. |
Gonzalez W D, Joselyn J A, Kamide Y, et al. 1994. What is a geomagnetic storm. Journal of Geophysical Research:Space Physics, 99(A4): 5771-5792. DOI:10.1029/93JA02867 |
Green J C, Kivelson M G. 2004. Relativistic electrons in the outer radiation belt:Differentiating between acceleration mechanisms. Journal of Geophysical Research, 109(A3): A03213. DOI:10.1029/2003JA010153 |
Gu X D, Xia S, Fu S, et al. 2020. Dynamic responses of radiation belt electron fluxes to magnetic storms and their correlations with magnetospheric plasma wave activities. The Astrophysical Journal, 891: 127. DOI:10.3847/1538-4357/ab71fc |
Iles R H A, Meredith N P, Fazakerley A N, et al. 2006. Phase space density analysis of the outer radiation belt energetic electron dynamics. Journal of Geophysical Research, 111(A3): A03204. DOI:10.1029/2005JA011206 |
Kim H J, Zesta E, Kim K C, et al. 2010. Estimation of radial gradients of phase space density from POLAR observations during a quiet period prior to a sudden solar wind dynamic pressure enhancement. Journal of Geophysical Research, 115(A12): A12249. DOI:10.1029/2010JA015722 |
Morley S K, Sullivan J P, Henderson M G, et al. 2016. The Global Positioning System constellation as a space weather monitor:Comparison of electron measurements with Van Allen Probes data. Space Weather, 14(2): 76-92. DOI:10.1002/2015SW001339 |
Ni B B, Shprits Y, Nagai T, et al. 2009a. Reanalyses of the radiation belt electron phase space density using nearly equatorial CRRES and polar-orbiting Akebono satellite observations. Journal of Geophysical Research, 114(A5): A05208. DOI:10.1029/2008JA013933 |
Ni B B, Shprits Y, Thorne R M, et al. 2009b. Reanalysis of relativistic radiation belt electron phase space density using multisatellite observations:Sensitivity to empirical magnetic field models. Journal of Geophysical Research:Space Physics, 114(A12): A12208. DOI:10.1029/2009JA014438 |
Ni B B, Shprits Y Y, Friedel R H W, et al. 2013. Responses of Earth's radiation belts to solar wind dynamic pressure variations in 2002 analyzed using multi-satellite data and Kalman filtering. Journal of Geophysical Research:Space Physics, 118(7): 4400-4414. DOI:10.1002/jgra.50437 |
Ni B B, Cao X, Zou Z Y, et al. 2015. Resonant scattering of outer zone relativistic electrons by multiband EMIC waves and resultant electron loss time scales. Journal of Geophysical Research:Space Physics, 120(9): 7357-7373. DOI:10.1002/2015JA021466 |
Ni B B, Hua M, Zhou R, et al. 2017. Competition between outer zone electron scattering by plasmaspheric hiss and magnetosonic waves. Geophysical Research Letters, 44(8): 3465-3474. DOI:10.1002/2017GL072989 |
Ni B B, Huang H, Zhang W, et al. 2019. Parametric sensitivity of the formation of reversed electron energy spectrum caused by plasmaspheric hiss. Geophysical Research Letters, 46(8): 4134-4143. DOI:10.1029/2019GL082032 |
Ni B B, Yan L, Fu S, et al. 2020. Distinct formation and evolution characteristics of outer radiation belt electron butterfly pitch angle distributions observed by Van Allen Probes. Geophysical Research Letters, 47(4): e2019GL086487. |
Reeves G D, Spence H E, Henderson M G, et al. 2013. Electron acceleration in the heart of the Van Allen radiation belts. Science, 341(6149): 991-994. DOI:10.1126/science.1237743 |
Roederer J G. 1970. Dynamics of Geomagnetically Trapped Radiation. New York: Springer-Verlag. doi: 10.1007/978-3-642-49300-3.
|
Selesnick R S, Blake J B, Kolasinski W A, et al. 1997. A quiescent state of 3 to 8 MeV radiation belt electrons. Geophysical Research Letters, 24(11): 1343-1346. DOI:10.1029/97GL51407 |
Shprits Y Y, Drozdov A Y, Spasojevic M, et al. 2016. Wave-induced loss of ultra-relativistic electrons in the Van Allen radiation belts. Nature Communications, 7: 12883. DOI:10.1038/ncomms12883 |
Spence H E, Reeves G D, Baker D N, et al. 2013. Science goals and overview of the radiation belt storm probes (RBSP) energetic particle, composition, and thermal plasma (ECT) Suite on NASA's Van Allen probes mission. Space Science Reviews, 179(1): 311-336. DOI:10.1007/s11214-013-0007-5 |
Thorne R M. 2010. Radiation belt dynamics:The importance of wave-particle interactions. Geophysical Research Letters, 37(22): L22107. DOI:10.1029/2010GL044990 |
Thorne R M, Li W, Ni B, et al. 2013. Evolution and slow decay of an unusual narrow ring of relativistic electrons near L~3.2 following the September 2012 magnetic storm. Geophysical Research Letters, 40(14): 3507-3511. DOI:10.1002/grl.50627 |
Tsyganenko N A. 2002. A model of the near magnetosphere with a dawn-dusk asymmetry 2.Parameterization and fitting to observations. Journal of Geophysical Research: Space Physics, 107(A8): SMP 10-1-SMP 10-17, doi: 10.1029/2001JA000220.
|
Tsyganenko N A, Sitnov M I. 2005. Modeling the dynamics of the inner magnetosphere during strong geomagnetic storms. Journal of Geophysical Research:Space Physics, 110(A3): A03208. DOI:10.1029/2004JA010798 |
Turner D L, Li X L. 2008. Radial gradients of phase space density of the outer radiation belt electrons prior to sudden solar wind pressure enhancements. Geophysical Research Letters, 35(18): L18101. DOI:10.1029/2008GL034866 |
Turner D L, Angelopoulos V, Shprits Y, et al. 2012a. Radial distributions of equatorial phase space density for outer radiation belt electrons. Geophysical Research Letters, 39(9): L09101. DOI:10.1029/2012GL051722 |
Turner D L, Morley S K, Miyoshi Y, et al. 2012b. Outer radiation belt flux dropouts: Current understanding and unresolved questions.//Summers D, Mann I R, Baker D N, et al eds. Dynamics of the Earth's Radiation Belts and Inner Magnetosphere. Washington, DC: Geophysical Monograph Series, 199, doi: 10.1029/2012GM001310.
|
Tuszewski M, Cayton T E, Ingraham J C, et al. 2004. Bremsstrahlung effects in energetic particle detectors. Space Weather, 2(10): S10S01. DOI:10.1029/2003SW000057 |
Xiang Z, Ni B B, Zhou C, et al. 2016. Multi-satellite simultaneous observations of magnetopause and atmospheric losses of radiation belt electrons during an intense solar wind dynamic pressure pulse. Annales Geophysicae, 34: 493-509. DOI:10.5194/angeo-34-493-2016 |
Xiang Z, Tu W C, Li X L, et al. 2017. Understanding the mechanisms of radiation belt dropouts observed by Van Allen Probes. Journal of Geophysical Research:Space Physics, 122(10): 9858-9879. DOI:10.1002/2017JA024487 |
Xiang Z, Li X, Temerin M, et al. 2020. On energetic electron dynamics during geomagnetic quiet times in Earth's inner radiation belt due to atmospheric collisional loss and CRAND as a source. Journal of Geophysical Research:Space Physics, 125(2): e2019JA027678. |
Zhang X J, Li W, Ma Q, et al. 2016. Direct evidence for EMIC wave scattering of relativistic electrons in space. Journal of Geophysical Research:Space Physics, 121(7): 6620-6631. DOI:10.1002/2016JA022521 |
Zhao H, Ni B B, Li X, et al. 2019. Plasmaspheric hiss waves generate a reversed energy spectrum of radiation belt electrons. Nature Physics, 15: 367-372. DOI:10.1038/s41567-018-0391-6 |
 2020, Vol. 63


