 2020, Vol. 63


岩石从深部剥露到地表的过程是研究诸多地质问题所必需的关键信息之一,比如造山带等地质体演化(Reiners and Brandon, 2006)、石油天然气形成与破坏(Qiu et al., 2011)、断层等构造边界活动历史(Wang et al., 2012; Tian et al., 2013)、矿床的保存与破坏(王健平等, 2008)、地貌演化(Tian et al., 2014; Yang et al., 2017)等.对于剥蚀历史的恢复,现今比较有效的方法包括古温标(如镜质体反射率、伊利石结晶度等)(Dow, 1977; 胡圣标等, 1999)、岩石物理参数(声波时差等)(Magara, 1976; 袁玉松等, 2008)、地层厚度横向对比(袁玉松等, 2008)和低温热年代计(如裂变径迹、U-Th-He等)(Gleadow et al., 2002; Ehlers and Farley, 2003; Rahn et al., 2004)等.前三种方法仅能用于限制总剥蚀量,而低温热年代计可通过记录岩石的温度历史限定剥蚀过程.
裂变径迹和U-Th-He等低温热年代计的封闭温度较低(70~300℃),适用于研究岩石在地壳浅部的剥露过程(Gleadow et al., 2002; Ehlers and Farley, 2003; Kohn et al., 2005; Reiners and Brandon, 2006),主要原理是利用对温度敏感的矿物(常规使用的多为磷灰石和锆石)裂变径迹和U-Th-He数据,结合相关热年代计的正演模型,通过数值模拟软件(常用的包括HeFTy(Ketcham, 2005)与QTQt(Gallagher, 2012))限定岩石剥露过程所伴随的冷却过程(即温度历史),进而使用冷却速率(℃/Ma)除以地温梯度(℃/km)获得岩石的剥露速率,并进一步计算剥蚀量.以前的诸多研究往往假设一个恒定的地温梯度(多使用现今值).这一假设与地热学理论和实践相悖:地壳的温度场会被各种地质过程所影响(Stuwe, 2002; Ehlers, 2005; 张健和许鹤华, 2015).
地壳的温度分布主要受控于热传导和热平流,热传导控制构造稳定区的温度场,而热平流在构造活动区不可忽略,因为剥蚀和沉积作用会引起物质和热量的重新分布(Stuwe, 2002; Ehlers, 2005).比如,剥蚀会带走地表物质,使地下温度相对较高的物质向上运移,增大地温梯度.因此,精确量化岩石剥露过程必须考虑热平流所导致的地温场变化.前人的研究虽然考虑到了这些因素,但仅能根据热年代学数据计算岩石的平均剥露速率(Brandon et al., 1998; Ehlers, 2005; Willett and Brandon, 2013),未能考虑剥露的阶段性;区域模拟的方法(Fox et al., 2014)需要大量数据且无法利用裂变径迹的长度数据;三维模拟的方法(Braun et al., 2012)需要大量数据和计算资源,且没有编入最新的裂变径迹退火和氦气扩散模型.
本文试图建立一种定量计算岩石剥露历史的新方法.该方法在热年代学数据所限制的热历史基础上,考虑了岩石剥露对地温场的影响.热历史输入参数是通过前文所介绍的热历史模拟软件HeFTy和QTQt所限定的,因此本方法间接使用了包括裂变径迹长度在内的各种热年代学数据和最完善的热年代学模型,输出具有阶段性变化的剥蚀速率演变历史.最后,本文选取低温热年代学和热历史研究较为深入的龙门山和四川盆地使用新方法量化了这些地区的剥蚀过程和剥蚀量.
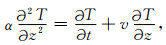
1 正演模型剥蚀与沉积作用对地温的影响可以通过瞬时平流-扩散偏微分方程进行描述.对于均质体,假设没有放射性产热,一维瞬时热平流-扩散方程可以表示为(Jaeger and Carslaw, 1959)
|
(1) |
α是热扩散率,T是温度,t是时间,z是深度,v是物质相对于地球表面的运动速度.在方程1中,等号左边描述热传导,等号右侧分别是瞬时热传递和沉积/剥蚀导致的热平流.
本文使用Crank-Nicolson时间积分的方法(Crank and Nicolson, 1947)求解方程(1),上、下边界条件分别为:地表温度(z=0)Ts=0;最大深度(z=L,这里使用50 km)的温度TL:

|
(2) |
其中G0为初始地温梯度,该参数与地表温度Ts及下边界深度L均可根据实际地质应用修改.
假设岩石经历如图 1a所示的剥露历史,给定上边界(地表温度)T=0 ℃、初始地温梯度20 ℃/km、下边界深度L=50 km与热扩散速率α=30 km2/Ma的条件下,根据方程1,求解获得各个时间点的温度-深度剖面和地温梯度(图 1b);同时根据剥露速率,可以追踪岩石从深部剥露到地表的过程,进而标定目标样品在各个时间的温度剖面上的位置(图 1b);连接各个时间的温度-深度便可获得目标样品的温度历史(图 1c).

|
图 1 剥蚀历史正演模拟输入和输出结果 (a)假设的岩石剥露历史; (b)根据方程(2)—(3)计算获得的岩石不同时间点的温度-深度剖面,投图的时间间隔为1 Ma(计算中使用的为0.01 Ma),该图中的“+”符表示不同时间点岩石所处的深度和温度,连接这些点便可获得岩石的温度历史(图 1c中的实线);(c)岩石的温度(实线)和地温梯度历史(虚线).其中地温梯度历史是深度小于3 km的平均值. Fig. 1 The inputs and outputs of forward modeling (a) An assumed rock exhumation history; (b) The temperature-depth profiles at different times, which were calculated by equation (2)—(3). The "+" symbol marks the depth at different times; (c) Rock temperature (solid line) and geothermal gradient history (dash line). The geothermal gradient is an average value for depths less than 3 km. |
图 1b显示随着剥蚀的持续,任何深度的温度都高于上一阶段的温度,这是因为随着岩石的剥露,地下温度相对较高的物质会向上运移,使得同一深度的温度增加.剥蚀还会导致地温梯度的变化,剥蚀速率越高,剥蚀持续时间越长,现今地温梯度相对于初始地温梯度变化越大.如图 1c所示,以0.3 km/Ma的速率,剥蚀持续10 Ma后,地温梯度从20 ℃/km增加到约24 ℃/km;持续以0.6 km/Ma的速率剥蚀10 Ma,地温梯度增加到约30 ℃/km.
2 反演模拟反演计算的目的是获得最佳拟合温度历史和现今地温梯度的剥蚀历史参数,主要包括两步:采样与模型评价.本文对剥蚀历史和初始地温梯度的采样使用的是一种遗传性的随机采样方法(马尔可夫链蒙托卡洛(MCMC)算法)(Goodman and Weare, 2010),该算法相较于随机搜索(蒙托卡洛)算法,效率更高,便于参数的优化(Goodman and Weare, 2010; 尹彬和胡祥云, 2016).本文选用阶段性模型描述剥蚀历史(图 2c),这主要是由于输入的热历史(见下文“应用实例”部分)往往具有阶段性.剥蚀历史的表示使用一个n×2的时间-剥蚀速率数组,n为描述剥蚀历史的阶段数目(可以任意设置).每个阶段的时间跨度随机生成,为了防止出现不合理的短暂的剥蚀速率跳跃,每个时间间隔的宽度设置为大于3倍的Δt.剥蚀历史离散化后(时间间隔Δt=0.5 Ma),连同初始地温梯度(图 2b)带入正演模型方程(2)—(3),便可计算获得冷却历史(图 2a).

|
图 2 剥蚀历史反演模拟输入与输出结果 (a)热历史输入数据(黑线)与模拟结果的对比图;(b)初始地温梯度参数与预测的及输入的(绿色横线及灰色阴影区)现今地温梯度对比图,初始地温梯度参数后验概率分布(浅蓝色).绿色五角星代表最佳初始地温梯度模型;(c)反演得到的剥蚀历史图.(a)与(c)图中的绿线代表最佳热历史及其对应的剥蚀历史参数,蓝色粗线代表后验平均热历史与剥蚀历史,浅蓝色细线为其75%的置信区间.(1)、(2)、(3)使用的剥蚀阶段数目分别为2、3和6. Fig. 2 The inputs and outputs of inversion modeling (a) Comparison between input (black line) and predicted thermal histories; (b) Comparison between the initial and the predicted and observed (horizontal green line and gray shaded area) current geothermal gradients, and the posterior distribution of the initial geothermal gradient (light blue curve). The green pentagram represents the best-fit initial geothermal gradient; (c) The denudation history diagram. In panels a and c, the green lines represent the best-fit thermal history and denudation histories, the blue lines are the expected thermal and denudation histories, and the light blue lines are the 75% confidence intervals. In panels (1)、(2)、(3) denudation stages are set as 2, 3 and 6, respectively. |
目标函数使用的是卡方(χ2)残差方程,分为两部分:方程(3)用于对比温度历史的残差φtT,方程(4)用于对比地温梯度的残差φG.方程(5)为总残差φ,该值越大,模型对数据的拟合越差;反之亦然.
|
(3) |

|
(4) |

|
(5) |
其中Ti, mod和Ti, inp分别为计算与输入的温度;N为对温度历史离散化的数目;Gmod和Ginp分别为计算与输入的地温梯度,这里假设温度和地温梯度的误差为10%,应用中可根据根据实际观测结果设置.
使用方程(6)量化模型对输入数据的拟合度log(L):

|
(6) |
模型评价的目的是计算模拟参数的后验分布,并得到其期望模型、置信区间、最大似然解等.相关计算借鉴了前人反演计算所使用的贝叶斯方法(Braun et al., 2012; Gallagher, 2012; 尹彬和胡祥云, 2016).可简要概括为:模型β对输入数据γ[γ=(t-T, G)]的后验概率[p(β|γ)],与其对应模型的似然函数[p(γ|β)]与先验概率p(β)的乘积成正比,即方程(7):

|
(7) |
其中,C为归一化系数;p(β|γ)使用方程(6)中的L来量化,即其自然对数与模型的总残差呈反比;p(β)假设为均匀分布.
3 反演模拟可靠性分析为了验证反演模拟的可靠性,我们将正演模型得到的热历史和现今地温梯度(假设其误差为10%)(图 1c)作为输入参数,利用前述反演方法,计算其剥蚀历史.下文介绍的反演计算结果为使用了不同阶段数目(分别为2、3、6个阶段)的剥蚀历史.
如图 2-1所示,剥蚀阶段数目为2(基于输入的温度历史确定)模拟得到的最佳拟合热历史与输入的热历史非常吻合(图 2-1a),所对应的最佳拟合剥蚀历史(20~10 Ma剥蚀速率为0.32 mm·a-1;10~0 Ma为0.61 mm·a-1)与正演模型中输入的剥蚀历史(图 1a)几乎相同;平均模型与正演使用的剥蚀历史也非常一致(图 1a).
为了测试剥蚀阶段数目对模拟结果的可能影响,本文计算了不同剥蚀阶段数目的模拟结果.图 2-2和2-3展示了剥蚀阶段数目分别设置为3和6的模拟结果.如图所示,反演计算得到的最佳拟合热历史与输入的热历史仍然基本吻合,只是在转折时间段(10 Ma左右)剥蚀速率渐变;平均模型可以较好地匹配转折时间段(10 Ma左右)之前或之后的慢速和快速剥蚀,但夸大了在转折时间段的差异,然而如果考虑模型的不确定性(75%的置信区间),平均模型也可以很好地拟合真实结果(图 1a).
上述模拟实验表明,前文阐述的剥蚀历史反演方法具有较高的可靠性.值得注意的是,模型越复杂(主要取决于剥蚀阶段的数目),获得稳定反演结果所需要的模拟的循环次数越多:当剥蚀阶段数目小于4时,循环次数需要1万次;阶段数目更多时,一般需要5~20万次.对于日常办公计算机,反演模拟可在3~5 min内完成.
4 参数敏感性分析在方程(2)—(3)中,除了剥露速率,另一个影响地温的参数是热扩散率,因此我们测试了反演模型对该参数的敏感性.我们假设了三种热历史,冷却速率分别为5 ℃/Ma、7.5 ℃/Ma和15 ℃/Ma(图 3a),并将热扩散率的变化范围设置为10 km2/Ma到40 km2/Ma(变化率300%),现今地温梯度设置为30±3 ℃.

|
图 3 反演模拟结果(总剥蚀量)对热扩散率的敏感性测试 (a)假设的三种冷却速率的热历史;(b)热扩散率与剥蚀量关系图,其中,圆、五角、三角符号分别是不同热扩散率条件下的反演计算结果,线条为二次多项式拟合曲线. Fig. 3 Sensitivity test of inversion modeling to thermal diffusivity (a) Three assumed thermal histories with different cooling rates; (b) Relationships between thermal diffusivity and total denudation. The circle, pentagon and triangle symbols mark respectively the modeled total denudation using different thermal diffusivity values. The line are quadratic polynomial fitting curves. |
结果如图 3b所示,同一冷却速率下,反演计算获得的总剥蚀量与热扩散率均呈现非线性的反相关关系;相对于热扩散率300%的变化,剥蚀量的变化范围均在30%左右,说明热扩散率的影响相对较小;另外,在常见岩石热扩散率20~35 km2/Ma范围内(Kanamori et al., 1968),相对应的总剥蚀量的变化均小于10%.因此,我们认为反演模拟结果对热扩散率参数的敏感性不强.
5 与传统方法的对比上述表明,剥蚀作用使地温梯度有增大的趋势(图 1c),因此传统方法, 即剥蚀量=总冷却温差(℃)/现今地温梯度(℃/km),会低估剥蚀总量:定性来说,冷却速率较慢时,相对应的剥蚀速率也较慢,对地温梯度的改变较小,传统方法与本文方法计算的剥蚀量应当差别较小;反之亦然.为了定量验证这一推测,本文设置了一些人工实验,使用的冷却速率范围为1~20 ℃/Ma,现今地温梯度范围为20~40 ℃/km;反演计算这些参数对应的剥蚀量以及相对与传统方法的差异,即100×(反演结果—传统方法计算结果)/传统方法计算结果.
如图 4所示,对于任何现今地温梯度,冷却速率越高,不同方法计算剥蚀量的差异越大:快速冷却(>10 ℃/Ma, 如喜马拉雅、龙门山等活动造山带)得到的剥蚀量差异>30%,这说明快速冷却情况下,深部岩石快速剥露,剥蚀对地温场的扰动较大.对比不同的现今地温梯度曲线,梯度越高,同一冷却速率所对应的剥蚀量差异越小.

|
图 4 冷却速率与剥蚀量差异关系图 圆、五角、三角符号分别为不同冷却速率下,传统方法与本文方法计算得到的总剥蚀量差异,实线为二次多项式拟合曲线.与图 3相同,输入的热历史温度起点为300 ℃,终点为0 ℃. Fig. 4 Relationship between cooling rate and the relative difference in total denudation calculated using convectional and our new methods The circle, pentagon and triangle symbols mark the calculated results. The lines are quadratic polynomial fitting curves. The input thermal history is set to start at 300 ℃ and end at 0 ℃. |
考虑到地温梯度与热年代学的观测与测试误差(一般都在6%左右),以及热年代学反演的热历史的误差(高达10%以上),追求特别高的剥蚀量精度是不现实的.假设剥蚀量计算可以接受的误差为10~15%,图 4可定量说明必须考虑剥露过程对剥蚀量计算产生较大影响的阈值.如图所示,对于现今地温场较低的地区(如四川盆地、塔里木盆地等稳定块体),即便是较为慢速的冷却(2~3 ℃/Ma),两类方法计算的剥蚀量差异也高达近15%;对于现今地温梯度较高的地区(如喜马拉雅、龙门山等活动造山带),当冷却速率达到5~10 ℃/Ma时,剥蚀量差异变得明显(>10%),如果冷却速率低于该值,两类方法计算的结果差异不明显.
除了总剥蚀量,剥蚀过程也是重要的研究对象之一.下面用一个匀速冷却的例子来说明本文所提出的方法与传统方法的不同.传统的计算方法是:剥蚀速率=冷却速率(℃/Ma)/现今地温梯度(℃/km).因此,对于匀速冷却,传统方法计算的结果是匀速剥蚀.但根据上文阐述,剥蚀作用对地温场的扰动会导致地温梯度增大,因此定性地来说匀速冷却的样品其剥蚀速率应该是递减的.图 5展示了一个定量模拟实例,模型假设以6 ℃/Ma的速率从200±20 ℃匀速冷却至20±5 ℃,现今地温梯度为30±3 ℃/km;反演计算结果显示剥蚀速率从约0.3 km/Ma逐级减小到0.2 km/Ma.基于此,我们认为当样品的温度历史是匀速冷却时,其剥蚀速率是逐渐变小的.

|
图 5 剥蚀历史反演模拟输入与输出结果 (a)输入的线性冷却热历史数据与模拟结果的对比图;(b)初始地温梯度参数与预测的及输入的现今地温梯度对比图,初始地温梯度参数后验概率分布;(c)反演得到的剥蚀历史图.图例与图 2相同. Fig. 5 Inputs and outputs of inversion modeling of the denudation history (a) Comparison of thermal history inputs and predictions; (b) Plots of initial and predicted modern (t=0) geothermal gradients, and the posterior distribution of the initial geothermal gradient; (c) The denudation history diagram. The legend is the same as the Fig. 2. |
下文以青藏高原东缘龙门山—四川盆地为例(图 6),阐述本文提出方法的有效性以及与传统方法的对比.数十年的地质研究显示,龙门山在晚新生代构造活化,并经历了快速的地壳抬升和地表剥蚀(Kirby et al., 2002; Wang et al., 2012; Tian et al., 2013; Cook et al., 2013);其邻区四川盆地除西南角之外,很可能也遭受了区域剥蚀,但相比于龙门山,其剥蚀速率较慢(Richardson et al., 2008; Shen et al., 2009; Tian et al., 2012; Deng et al., 2013; Shi et al., 2016; Yang et al., 2017).本文选用研究程度相对较高的龙门山南端、四川盆地中部和东部三个地区的热历史作为实例,反演计算对应的剥蚀历史.

|
图 6 青藏高原东缘及四川盆地的地质简图(改自四川省区域地质志,1991) 红色五角、正方形和圆形符号标注了用于本文分析的热年代学数据位置及来源. Fig. 6 Generalized geological map of the eastern margin of Tibet Plateau and the Sichuan Basin, modified after SBGMR (1991) The red symbols (pentagons, squares and circles) indicate the locations and sources of thermochronology data used in this work. |
龙门山南部的宝兴杂岩在新生代以来剥露速率较快(Tian et al., 2013; Cook et al., 2013).前人在宝兴杂岩地区展开大量的低温热年代学研究,使用的热年代计包括锆石与磷灰石裂变径迹和锆石U-Th-He(Cook et al., 2013; Tian et al., 2013).笔者基于Cook等(2013)报道的KC05样品(包括锆石裂变径迹、锆石与磷灰石U-Th-He)以及近乎相同的点位Tian等(2013)报道的BX29样品(包括锆石U-Th-He、磷灰石裂变径迹)数据,使用QTQt软件(Gallagher, 2012)模拟获得了宝兴杂岩的温度历史,结果显示~15 Ma以来,样品从250±20 ℃快速冷却到20±5 ℃(地表温度).
诸多研究显示四川盆地自晚白垩世以来遭受了区域剥蚀,并存在显著的时空差异(Richardson et al., 2008; Shen et al., 2009; Tian et al., 2012; Deng et al., 2013; Shi et al., 2016; Yang et al., 2017; Tian et al., 2018).在四川盆地中部地区,Deng等(2013)根据4个侏罗系砂岩样品(图 6)的磷灰石裂变径迹数据模拟得到的热历史为:约80~40 Ma,样品从90±10 ℃持续缓慢冷却到75±5 ℃;~40 Ma以来,加速冷却到地表(20±5 ℃).
在川东地区,Yang等(2017)根据16个上三叠统-上侏罗统砂岩样品(图 6)的磷灰石裂变径迹数据模拟得到的热历史为:80~40 Ma,样品从110± 10 ℃持续缓慢冷却到90±10 ℃;约40 Ma以来,加速冷却到近地表温度(20±5 ℃).
本文使用上述三个地区的热历史作为输入参数,利用本文开发的方法,模拟了对应的剥蚀历史.除了热历史外,另外一个输入参数是地温梯度:四川盆地中部的地温梯度为22±2 ℃/km(徐明等, 2011);川东地区为20±2 ℃/km(徐明等, 2011);龙门山南段没有实际测量的地温梯度数据,考虑其构造活动强烈,地温梯度假设为35±3 ℃/km.
如图 7所示,宝兴杂岩地区剥蚀历史的反演计算为:15 Ma开始快速剥蚀,速率约为0.95 km/Ma;约12 Ma剥蚀速率降低到0.51 km/Ma;7 Ma速率略有降低为0.43 km/Ma;总剥蚀量为8.2 km.这可能说明在龙门山中新世构造活化初期,抬升与剥蚀速率较快,后续略有降低;或者是不同时期气候背景略有差异的结果.四川盆地中部反演计算得到的最佳剥蚀历史为:80~60 Ma剥蚀缓慢,速率0.02 km/Ma;约60 Ma剥蚀速率略有下降;自约46 Ma以来剥蚀加速近3倍,达到0.06 km/Ma,总剥蚀量为3.4 km.川东地区反演计算得到的最佳剥蚀历史为:约80~62 Ma剥蚀速率0.02 km/Ma;62 Ma开始剥蚀速率略微上升到0.04 km/Ma,~43 Ma以来剥蚀加速到0.09 km/Ma;总剥蚀量4.9 km.由此可见,四川盆地中部和东部的剥蚀量相差~1.5 km.

|
图 7 剥蚀历史反演模拟输入与输出结果 (a)热历史输入数据与模拟结果的对比图;(b)初始地温梯度参数与预测的及输入的现今地温梯度对比图,初始地温梯度参数后验概率分布;(c)反演得到的剥蚀历史图.第1~3行分别为四川盆地中部、东部地区和宝兴杂岩.图例与图 2相同. Fig. 7 Inputs and outputs of inversion modeling of the denudation history (a) Comparison of thermal history inputs and predictions; (b) Plots of initial and predicted modern (t=0) geothermal gradients, and the posterior distribution of the initial geothermal gradient. (c) The denudation history diagram. Row 1~3 are for the central and eastern Sichuan Basin, and the Baoxing massif, respectively.The legend is the same as the Fig. 2. |
曾道富(1988)根据地层厚度的分析,认为晚白垩世以来四川盆地内部的剥蚀量约1.5~2 km,盆地边缘地区剥蚀地层较厚,约3 km.与本文得到的结果相比,地层分析方法得到的总剥蚀量相对较小,这可能与现存地层之上是否有上白垩统地层发育有关,如果发育了更多的上白垩统地层,且已经被完全剥蚀,那么基于现存地层的计算就低估了剥蚀量.邓宾等(2009)通过收集了四川盆地的镜质体反射率数据,并计算认为川东地区剥蚀量较高,达到3~5 km,川中地区剥蚀量略小2.4~3.6 km,这与本文计算的结果比较一致.
如上文所述,四川盆地东部的剥蚀量大于中部和西侧,这可能与长江水系的调整和溯源侵蚀有关(Richardson et al., 2008;Zheng et al., 2013);另外,该地区所发育的隔挡、隔槽式褶皱可能吸收了一期晚新生代的缩短,加剧了这个地区的剥蚀(Tian et al., 2018).龙门山晚新生代剥蚀量很大,这与该地区构造活跃有关(Xu et al., 2009; Wang et al., 2012),相关的讨论已经超出了本文的主题.
综上所述,前文的分析显示考虑热平流的反演模拟所得到的剥蚀量会大于传统方法的计算结果,且冷却速率越高,与传统方法的差异越大.龙门山南部、四川盆地中部和东部的模拟结果也验证了这一认识(表 1):现今地温梯度较低的四川盆地中部和中部,以1~2 ℃/Ma较为慢速冷却,两类方法计算的剥蚀量差异小于10%;现今地温梯度较高的龙门山南部,以15 ℃/Ma快速冷却,两类方法计算的剥蚀量差异高达24%(表 1).同时,对于匀速冷却的热历史(龙门山南部),其剥蚀速率是逐渐减小的,这也与前文的分析一致.
|
|
表 1 龙门山南段与四川盆地中、东部两类方法剥蚀量计算结果对比 Table 1 The total denudation of the southern Longmen Shan and the Sichuan Basin, calculated using the conventional and our new methods |
本文开发了一种基于热年代学数据所限制的热历史,考虑剥蚀过程伴随的垂向热平流,反演计算岩石剥露历史的方法.通过参数敏感性分析、人工实验和实例研究,得到了以下几点认识:
(1) 传统计算方法低估了总剥蚀量,样品冷却速率越高,低估量越高.
(2) 冷却速率较低时,传统方法与本文计算的剥蚀量差异较小;对于现今地温梯度小于20 ℃、冷却速率大于2~3 ℃/Ma的地区,或现今地温梯度大于30 ℃、冷却速率大于5~10 ℃/Ma的地区,需要考虑热平流对剥蚀量计算的影响.
(3) 由于剥蚀对地温场的扰动,匀速冷却的样品,其剥蚀速率是逐渐减小的.
(4) 龙门山南部宝兴杂岩地区,15 Ma以来抬升剥蚀显著,总剥蚀量约8.2 km;四川盆地经历了差异剥蚀,中部与东部的剥蚀量差异~1.5 km.
致谢 感谢三位审稿专家提出的建设性修改意见;感谢中国科学院地质与地球物理研究所胡杰博士、中山大学博士生刘一珉、田野、秦咏辉等在本文写作中提供的帮助.
Brandon M T, Roden-Tice M K, Garver J I. 1998. Late Cenozoic exhumation of the Cascadia accretionary wedge in the Olympic Mountains, northwest Washington State. GSA Bulletin, 110(8): 985-1009. DOI:10.1130/0016-7606(1998)110〈0985:LCEOTC〉2.3.CO;2 |
Braun J, Van Der Beek P, Valla P, et al. 2012. Quantifying rates of landscape evolution and tectonic processes by thermochronology and numerical modeling of crustal heat transport using PECUBE. Tectonophysics, 524-525: 1-28. DOI:10.1016/j.tecto.2011.12.035 |
Cook K L, Royden L H, Burchfiel B C, et al. 2013. Constraints on Cenozoic tectonics in the southwestern Longmen Shan from low-temperature thermochronology. Lithosphere, 5(4): 393-406. DOI:10.1130/L263.1 |
Crank J, Nicolson P A. 1947. A practical method for numerical evaluation of solutions of partial differential equations of the heat-conduction type. Mathematical Proceedings of the Cambridge Philosophical Society, 43(1): 50-67. DOI:10.1017/S0305004100023197 |
Deng B, Liu S G, Liu S, et al. 2009. Restoration of exhumation thickness and its significance in Sichuan basin, China. Journal of Chengdu University of Technology (Science & Technology Edition) (in Chinese), 36(6): 675-686. |
Deng B, Liu S G, Li Z W, et al. 2013. Differential exhumation at eastern margin of the Tibetan Plateau, from apatite fission-track thermochronology. Tectonophysics, 591: 98-115. DOI:10.1016/j.tecto.2012.11.012 |
Dow W G. 1977. Kerogen studies and geological interpretations. Journal of Geochemical Exploration, 7: 79-99. DOI:10.1016/0375-6742(77)90078-4 |
Ehlers T A. 2005. Crustal thermal processes and the interpretation of thermochronometer data. Reviews in Mineralogy and Geochemistry, 58(1): 315-350. DOI:10.2138/rmg.2005.58.12 |
Ehlers T A, Farley K A. 2003. Apatite (U-Th)/He thermochronometry:methods and applications to problems in tectonic and surface processes. Earth and Planetary Science Letters, 206(1-2): 1-14. DOI:10.1016/S0012-821X(02)01069-5 |
Fox M, Herman F, Willett S, et al. 2014. A linear inversion method to infer exhumation rates in space and time from thermochronometric data. Earth Surface Dynamics, 2(1): 47-65. DOI:10.5194/esurf-2-47-2014 |
Gallagher K. 2012. Transdimensional inverse thermal history modeling for quantitative thermochronology. Journal of Geophysical Research:Solid Earth, 117(B2): B02408. DOI:10.1029/2011JB008825 |
Gleadow A J W, Belton D X, Kohn B P, et al. 2002. Fission track dating of phosphate minerals and the thermochronology of apatite. Reviews in Mineralogy and Geochemistry, 48(1): 579-630. DOI:10.2138/rmg.2002.48.16 |
Goodman J, Weare J. 2010. Ensemble samplers with affine invariance. Communications in Applied Mathematics and Computational Science, 5(1): 65-80. DOI:10.2140/camcos.2010.5.65 |
Hu S B, Wang J C, Zhang R Y. 1999. Estimation of the amount of uplift and erosion across an unconformity using vitrinite reflectance data. Petroleum Exploration and Development (in Chinese), 26(4): 42-46. |
Jaeger J C, Carslaw H S. 1959. Conduction of Heat in Solids. 2nd ed. Oxford: Clarendon Press.
|
Kanamori H, Fujii N, Mizutani H. 1968. Thermal diffusivity measurement of rock-forming minerals from 300° to 1100°K. Journal of Geophysical Research, 73(2): 595-605. DOI:10.1029/JB073i002p00595 |
Ketcham R A. 2005. Forward and inverse modeling of low-temperature thermochronometry data. Reviews in Mineralogy and Geochemistry, 58(1): 275-314. DOI:10.2138/rmg.2005.58.11 |
Kirby E, Reiners P W, Krol M A, et al. 2002. Late Cenozoic evolution of the eastern margin of the Tibetan Plateau:Inferences from 40Ar/39Ar and (U-Th)/He thermochronology. Tectonics, 21(1): 1001. DOI:10.1029/2000TC001246 |
Kohn B P, Gleadow A J W, Brown R W, et al. 2005. Visualizing thermotectonic and denudation histories using apatite fission track thermochronology. Reviews in Mineralogy and Geochemistry, 58(1): 527-565. DOI:10.2138/rmg.2005.58.20 |
Magara K. 1976. Thickness of removed sedimentary rocks, paleopore pressure, and paleotemperature, southwestern part of Western Canada Basin. AAPG Bulletin, 60(4): 554-565. DOI:10.1306/83D92401-16C7-11D7-8645000102C1865D |
Qiu N S, Jiang G, Mei Q H, et al. 2011. The Paleozoic tectonothermal evolution of the Bachu Uplift of the Tarim Basin, NW China:constraints from (U-Th)/He ages, apatite fission track and vitrinite reflectance data. Journal of Asian Earth Sciences, 41(6): 551-563. DOI:10.1016/j.jseaes.2011.02.008 |
Rahn M K, Brandon M T, Batt G E, et al. 2004. A zero-damage model for fission-track annealing in zircon. American Mineralogist, 89(4): 473-484. DOI:10.2138/am-2004-0401 |
Reiners P W, Brandon M T. 2006. Using thermochronology to understand orogenic erosion. Annual Review of Earth and Planetary Sciences, 34: 419-466. DOI:10.1146/annurev.earth.34.031405.125202 |
Richardson N J, Densmore A L, Seward D, et al. 2008. Extraordinary denudation in the Sichuan Basin:Insights from low-temperature thermochronology adjacent to the eastern margin of the Tibetan Plateau. Journal of Geophysical Research:Solid Earth, 113(B4): B04409. DOI:10.1029/2006JB004739 |
SBGMR (Sichuan Bureau of Geology and Mineral Resources). 1991. Regional Geology of Sichuan Province (in Chinese). Beijing: Geological Publishing House: 1-728.
|
Shen C B, Mei L F, Xu S H. 2009. Fission track dating of Mesozoic sandstones and its tectonic significance in the Eastern Sichuan Basin, China. Radiation Measurements, 44(9-10): 945-949. DOI:10.1016/j.radmeas.2009.10.001 |
Shi H C, Shi X B, Glasmacher U A, et al. 2016. The evolution of eastern Sichuan basin, Yangtze block since Cretaceous:constraints from low temperature thermochronology. Journal of Asian Earth Sciences, 116: 208-221. DOI:10.1016/j.jseaes.2015.11.008 |
Stuwe K. 2002. Geodynamics of the Lithosphere. Berlin Heidelberg: Springer.
|
Tian Y T, Kohn B P, Zhu C Q, et al. 2012. Post-orogenic evolution of the Mesozoic Micang Shan foreland basin system, central China. Basin Research, 24(1): 70-90. DOI:10.1111/j.1365-2117.2011.00516.x |
Tian Y T, Kohn B P, Gleadow A J W, et al. 2013. Constructing the Longmen Shan eastern Tibetan Plateau margin:Insights from low-temperature thermochronology. Tectonics, 32(3): 576-592. DOI:10.1002/tect.20043 |
Tian Y T, Kohn B P, Gleadow A J W, et al. 2014. A thermochronological perspective on the morphotectonic evolution of the southeastern Tibetan Plateau. Journal of Geophysical Research:Solid Earth, 119(1): 676-698. DOI:10.1002/2013jb010429 |
Tian Y T, Kohn B P, Qiu N S, et al. 2018. Eocene to Miocene Out-of-Sequence Deformation in the Eastern Tibetan Plateau:Insights From Shortening Structures in the Sichuan Basin. Journal of Geophysical Research:Solid Earth, 123(2): 1840-1855. DOI:10.1002/2017JB015049 |
Wang E, Kirby E, Furlong K P, et al. 2012. Two-phase growth of high topography in eastern Tibet during the Cenozoic. Nature Geoscience, 5(9): 640-645. DOI:10.1038/ngeo1538 |
Wang J P, Zhai Y S, Liu J J, et al. 2008. A new approach to post-ore change and preservation of ore deposits:Fission track analysis. Advances in Earth Science (in Chinese), 23(4): 421-427. |
Willett S D, Brandon M T. 2013. Some analytical methods for converting thermochronometric age to erosion rate. Geochemistry Geophysics Geosystems, 14(1): 209-222. DOI:10.1029/2012GC004279 |
Xu M, Zhu C Q, Tian Y T, et al. 2011. Borehole temperature logging and characteristics of subsurface temperature in Sichuan Basin. Chinese Journal of Geophysics (in Chinese), 54(4): 1052-1060. DOI:10.3969/j.issn.0001-5733.2011.04.020 |
Xu X W, Wen X Z, Yu G H, et al. 2009. Coseismic reverse-and oblique-slip surface faulting generated by the 2008 MW7.9 Wenchuan earthquake, China. Geology, 37(6): 515-518. DOI:10.1130/G25462A.1 |
Yang Z, Shen C B, Ratschbacher L, et al. 2017. Sichuan Basin and beyond:Eastward foreland growth of the Tibetan Plateau from an integration of Late Cretaceous-Cenozoic fission track and (U-Th)/He ages of the eastern Tibetan Plateau, Qinling, and Daba Shan. Journal of Geophysical Research:Solid Earth, 122(6): 4712-4740. DOI:10.1002/2016JB013751 |
Yin B, Hu X Y. 2016. Overview of nonlinear inversion using Bayesian method. Progress in Geophysics (in Chinese), 31(3): 1027-1032. DOI:10.6038/pg20160313 |
Yuan Y S, Zheng H R, Tu W. 2008. Methods of eroded strata thickness restoration in sedimentary basin. Petroleum Geology and Experiment (in Chinese), 30(6): 636-642. |
Zeng D F. 1988. A preliminary study on the restoration for the various denuded sequences of Sichuan Basin. Experimental Pbtrolbum Gbqlology (in Chinese), 10(2): 43-50. DOI:10.11781/sysydz198802134 |
Zhang J, Xu H H. 2015. Earth internal heat and heat transfer.//Wang J Y ed. Geothermics and Its Applications (in Chinese). Beijing: Science Press, 19-63.
|
Zheng H B, Clift P D, Wang P, et al. 2013. Pre-Miocene birth of the Yangtze River. Proceedings of the National Academy of Sciences of the United States of America, 110(19): 7556-7561. DOI:10.1073/pnas.1216241110 |
邓宾, 刘树根, 刘顺, 等. 2009. 四川盆地地表剥蚀量恢复及其意义. 成都理工大学学报(自然科学版), 36(6): 675-686. DOI:10.3969/j.issn.1671-9727.2009.06.013 |
胡圣标, 汪集晠, 张容燕. 1999. 利用镜质体反射率数据估算地层剥蚀厚度. 石油勘探与开发, 26(4): 42-46. DOI:10.3321/j.issn:1000-0747.1999.04.011 |
四川省地质矿产局. 1991. 四川省区域地质志. 北京: 地质出版社: 1-728.
|
王建平, 翟裕生, 刘家军, 等. 2008. 矿床变化与保存研究的裂变径迹新途径. 地球科学进展, 23(4): 421-427. DOI:10.3321/j.issn:1001-8166.2008.04.012 |
徐明, 朱传庆, 田云涛, 等. 2011. 四川盆地钻孔温度测量及现今地热特征. 地球物理学报, 54(4): 1052-1060. DOI:10.3969/j.issn.0001-5733.2011.04.020 |
尹彬, 胡祥云. 2016. 非线性反演的贝叶斯方法研究综述. 地球物理学进展, 31(3): 1027-1032. DOI:10.6038/pg20160313 |
袁玉松, 郑和荣, 涂伟. 2008. 沉积盆地剥蚀量恢复方法. 石油实验地质, 30(6): 636-642. DOI:10.3969/j.issn.1001-6112.2008.06.019 |
曾道富. 1988. 关于恢复四川盆地各地质时期地层剥蚀量的初探. 石油实验地质, 10(2): 43-50. DOI:10.11781/sysydz198802134 |
张健, 许鹤华. 2015.地球内热与热传递.//汪集晹.地热学及其应用.北京: 科学出版社, 19-63.
|