 2020, Vol. 63


2. 中国科学院南海生态环境工程创新研究院, 广州 510301;
3. 南方海洋科学与工程广东省实验室, 广州 510301;
4. 中山大学地球科学与工程学院, 广州 510275;
5. 中国科学院大学, 北京 100049
2. Innovation Academy of South China Sea Ecology and Environmental Engineering, Chinese Academy of Sciences, Guangzhou 510301, China;
3. Southern Marine Science and Engineering Guangdong Laboratory(Guangzhou), Guangzhou 510301, China;
4. School of Earth Science and Engineering, Sun Yat-Sen University, Guangzhou 510275, China;
5. University of Chinese Academy of Sciences, Beijing 100049, China
地幔热导率作为表征地幔岩石或矿物导热能力的参数,对地幔热传输过程有着显著的影响(Van Den Berg et al., 2001;Hofmeister, 1999, 2014;Jaupart and Mareschal, 2015),这种影响往往伴随着深部地幔和浅部岩石圈热状态的变化(Van Den Berg et al., 2002;Dubuffet et al., 1999;Dubuffet and Yuen, 2000;黄少鹏,1992;赵平等,2015).因而,当地幔热导率的数值或空间分布改变时,地球内部的热状态和热过程会产生明显的变化.这种变化会进一步引起相应动力学过程如岩石圈变形、地幔对流等的改变(Gueydan et al., 2008;Liao and Gerya, 2014;Afonso and Ranalli, 2004;Manatschal et al., 2015;Dubuffet and Yuen, 2000).
前人对地幔热导率的大小和空间分布展开了大量的理论(Clark,1957;Hofmeister, 1999, 2005, 2014;Grose and Afonso, 2019)和实验研究(Shankland et al., 1979;Clauser and Huenges, 1995;Goncharov et al,2008; Hofmeister et al., 2014),并给出了多种热导率随温压或深度变化的物理模型(图 1).例如,Clark(1957)通过对透明介质中热辐射传播和吸收的理论研究,提出地幔矿物中辐射热导率与温度三次方的倒数成正比;Shankland等(1979)在此基础上,通过测定橄榄石在不同温度下的光学吸收谱,得到了其辐射热导率随温度的分布规律;Clauser和Huenges(1995)通过统计前人在不同温压下测定的岩石热导率,给出了特定岩石种类热导率随温压变化的经验公式;Hofmeister(1999)则基于实验得到的声子寿命和红外反射数据,提出了地幔热导率随温压变化的新理论模型;在此基础上,Hofmeister等人通过纳入颗粒大小对热辐射的影响(Hofmeister,2005)和声子-光子的相互作用(Hofmeister et al., 2014),并忽略热辐射的衍射效应(Hofmeister,2014),进一步完善或修正了晶格热导率和辐射热导率的表达式;Grose和Afonso(2019)则在辐射扩散理论(Rosseland,1936)的基础上,充分考虑了地幔介质中矿物大小和分布的不均一性对热辐射传播的影响,提出了计算上地幔辐射热导率的有效介质理论.

|
图 1 多种热导率模型 黑色曲线表示辐射热导率模型(krad),粉色曲线表示晶格热导率模型(klat), 深蓝色曲线表示全热导率模型.红色点划线表示计算各热导率模型所基于的温度(T)分布.Clark(1957)模型中室温下介质的光吸收系数(ε0)取10 cm-1;Hofmeister(2005)模型中矿物颗粒直径取0.5 cm;Shankland等(1979)模型则是基于实验获取的离散数据点,经线性插值得到.粉色曲线代表的晶格热导率包含了晶格声子(Lattice phonons)和声子极化激元(Bulk phonon-polarity)两部分的贡献.LAB为岩石圈与软流圈界面. Fig. 1 Various thermal conductivity models The black curves represent radiative thermal conductivity (krad), the pink curve represents lattice thermal conductivity (klat) while the dark blue ones represent the total conductivity of rocks or minerals. The red dot-dot-dashed line denotes the temperature distribution (T) on which calculations for various models are based. In the model of Clark (1957), we take a value of 10 cm-1 for the optical absorption coefficients (ε0) at room temperature; in the model of Hofmeister (2005), a value of 0.5cm is taken for the diameter of mineral grains; with respect to the model of Shankland et al.(1979), linear interpolation is applied here for their scattered value obtained through experiments. The lattice thermal conductivity represented by the pink curve, actually contains two parts, one being with the contribution of lattice phonons and the other with the contribution of bulk phonon-polarity. LAB:lithosphere and asthenosphere boundary. |
由于不同研究在理论基础、实验方法以及研究的传热机制上存在一定差异,不同地幔热导率模型在数值和随深度分布的规律上往往呈现出明显的不同(图 1),这种差异导致在动力学数值模拟研究中,应用不同的模型可能会引起模拟结果较为显著的变化.事实上,前人在动力学数值模拟研究中,对地幔热导率的选取往往存在一定差异.例如,Gerya(2013)选取了Clauser和Huenges(1995)的经验公式,Van Den Berg等(2001)选用了Hofmeister(1999)的理论公式,而Brune等(2014)则采用了与部分理论模型(如Hofmeister,1999)数值上相近的恒定热导率.然而对于这种差异可能带来的影响,前人往往鲜有提及.另外,对于部分最新的理论热导率模型,如Hofmeister(2014)及Grose和Afonso(2019),目前仍鲜有应用.对于这些模型在今后动力学模拟中应用时,是否会较大地改变原有的模拟结果,目前也仍不明确.
为此,本文以岩石圈张裂为例,利用热-力学耦合的数值模拟方法,研究了不同地幔热导率模型下的岩石圈张裂过程,对比了不同模型下演化特征的差异,并进一步分析了地幔热导率大小对张裂过程中地幔热传输、岩石圈变形和物质熔融的影响机制.最后,基于不同热导率模型的理论基础,本文对不同热导率模型在数值上的差异进行了简要分析,并讨论了地幔热导率的选取对不同热-力学过程的影响差异,以期为后续动力学数值模拟工作提供一定的参考.
1 数值模型 1.1 控制方程本文采用热-力学耦合的数值模型I2DELVIS(Gerya and Yuen, 2007)来探讨地幔热导率对岩石圈张裂过程的影响.该模型已被成功用于大陆裂解及海底扩张等过程的模拟研究(Liao et al., 2013;Gerya,2013;Liao and Gerya, 2014,2015).I2DELVIS模型基于有限差分算法及欧拉网格和拉格朗日点相结合的方法(marker-in-cell)(Gerya and Yuen, 2003),对物质守恒、动量和能量方程进行求解,从而实现岩石圈的变形过程:

|
(1) |
|
(2) |
|
(3) |
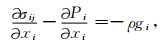
其中v代表速度,σ代表偏应力张量,ρ表示物质的密度,g为重力加速度,Cp代表热容,T为温度,k为热导率,Hr表示放射性生热率,Hs=σij
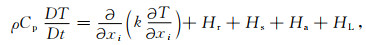
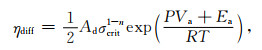
本文的模型中,岩石的变形行为遵循黏塑性流动法则.黏性流动主要通过岩石的扩散蠕变和位错蠕变完成,二者的黏度ηdiff和ηdisl由式(4)和(5)计算得到
|
(4) |
|
(5) |
其中Ad是指数前常数,n为应力指数或应变速率指数,Va表示活化体积,Ea代表活化能,R是气体常数(8.314 J·K-1·mol-1),σcrit=104Pa是扩散蠕变向位错蠕变过渡的临界应力(Turcotte and Schubert, 2014),
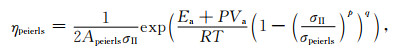
在足够高的应力(σII>200 MPa)和低温(T < 1100 ℃)下,Peierls蠕变取代位错蠕变成为岩石主要的变形机制(Katayama and Karato, 2008).Peierls蠕变黏度可以表达为
|
(6) |
其中σII表示应力第二不变量,APeierls=6.3×10⁻⁵Pa-2·s-1,σpeierls=9.1×10⁹Pa,p=1,q=2.
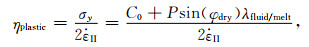
随着应力的增加,一旦应力达到屈服条件(σII≥σy),岩石就会发生塑性变形,其有效黏度由摩尔-库伦屈服准则计算得到
|
(7) |
其中C0是内聚力即压力为0时岩石的剩余强度,φdry代表干燥状态下岩石圈的内摩擦系数,λfluid/melt=0.001,表示孔隙流体/熔体系数,用以降低含流体/熔体岩石的屈服强度(σy)(Li et al., 2015).考虑到塑性材料的应变软化特征,模型中加入了岩石的应变软化过程即在应变区间0.5~1.5之间,内聚力(C0-C1)和内摩擦系数(ф0-ф1)随着应变的增加线性降低.
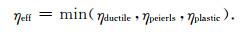
基于以上不同变形机制下的黏度计算方法,岩石的等效黏度由三种黏度中的最小者确定(Gerya,2010;Li et al., 2015),即
|
(8) |
模型中的岩浆相关过程包括岩石熔融和岩浆析出都采用了简化的实现方式(Gerya,2013).对于熔融过程,干地幔的熔融比例(M)是基于Karz等(2003)构建的参数化熔融模型计算得到的,具体计算方法及岩石的干湿固相线见Liao等(2015).
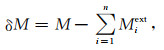
当熔融量达到一定比例,熔融物开始析出并发生运移.在模型中,设定了熔融析出的上限和下限,Mmax=4%和Mmin=2%(Li et al., 2015).当熔融量与先前析出量之和的差值(式9)超过上限时(δM>Mmax)熔体开始析出,析出的熔体量为M-Mmin.当温度继续升高,δM再次超过Mmax时,就会发生又一次析出:
|
(9) |
Miext表示先前每一时间步长的熔体析出量.这一过程中析出的熔融物通过新增加拉格朗日物质点来追踪.本文的模型中仅考虑软流圈熔融物质的析出,忽略地壳等熔融物质的析出.
1.4 初始模型和边界条件由于本文的主要研究对象为上地幔热导率且部分热导率模型的计算深度存在一定限制(Grose and Afonso, 2019),因而本文将模型空间尺度设为500 km×300 km(图 2).为了更精确地表达张裂过程,模型采用了非均匀的交错网格,在模型的中部对网格进行了加密,分辨率最高可以达到0.5 km×0.3 km,向两侧逐渐减小至2 km×1 km.模型的内部设置了约240万个随机分布的拉格朗日物质点.在圈层结构上,模型的最上部设置有厚度为20 km的黏性空气层(黏度为1018Pa·s),使地壳表面可以近似为自由表面(Schmeling et al., 2008; Crameri et al., 2012),以自由地产生地形变化.岩石圈层中,本文选取100 km作为初始岩石圈厚度,其中上地壳厚20 km,下地壳厚15 km,而岩石圈地幔厚65 km.在岩石圈的物质组成方面,分别选取湿石英、长英质麻粒岩和干橄榄岩作为上地壳、下地壳和地幔的岩石组分,具体物性参数见表 1.

|
图 2 初始模型设置 (a)物质组成、边界条件及温度分布.物质组成由不同的颜色表示:1空气,2水,3沉积物,4上地壳,5下地壳,6岩石圈地幔,7软流圈,8熔融下地壳,9熔融软流圈,10玄武岩.模型中部设置了一个5 km×5 km的软弱点以促进应变集中,四个边界均为切向自由滑动.温度单位为摄氏度(℃); (b)岩石圈流变分层结构和温度剖面.流变结构由10-16s-1应变速率下韧性变形(位错蠕变)所需应力和塑性屈服应力相对大小确定(Burov,2011),Δσmax表示最大差异应力. Fig. 2 Initial model configuration (a) Rock composition, boundary condition and temperature distribution. The composition is represented by different colors:1 air; 2 water; 3 sediments; 4 upper crust; 5 lower crust; 6 lithospheric mantle; 7 asthenosphere; 8 molten lower crust; 9 molten mantle; 10 basalt. A week seed with size of 5 km×5 km is placed in the center part of the model to localize the initial deformation. All boundaries are tangential free slip. The unit of temperature is Celsius degree. (b) The initial rheological layered structure and temperature profile. The stress envelope is determined by the minimum value between ductile yield stress (dislocation creep) and plastic yield stress under a constant strain rate of 10-16s-1(Burov, 2011).Δσmax represents maximum differential stress. |
|
|
表 1 物性参数[1] Table 1 Physical parameters[1] |
模型采用线性温度场,由地壳表面温度、莫霍面和岩石圈底界温度控制,其中地壳表面温度设为0 ℃,莫霍面设为600 ℃,而岩石圈底界设为1300 ℃.软流圈地幔则采用0.5 ℃·km-1绝热地温梯度.模型的顶底界均为恒定的温度边界,顶部取0 ℃,底部温度依据岩石圈底界温度和绝热地温梯度计算得到,两侧为绝热边界.为保证黏性空气层内较低的温度变化,其热导率设为200 W·m-1·K-1.
对于边界速度的设定,四个边界均为加载恒定速度的自由滑动边界(Liao et al., 2013),两侧边界加载0.5 cm·yr-1的伸展速率,顶底边界速度则基于模型整体的物质守恒及黏性空气层的物质守恒计算得到(Liao and Gerya, 2014).
1.5 热导率模型基于前述,本文选取了5种地幔热导率模型(表 2).依据平均数值由小到大的顺序,本文将热导率模型依次命名为K1—K5.K1模型选取自Clauser和Huenges(1995)的统计结果;K2基于Hofmeister(1999)的理论模型,包含晶格热导率(klat)和辐射热导率(krad)两部分;K3模型假设地幔热导率为常数3.3 W·m-1·K-1,这种简化模型也常应用于动力学数值模拟中,如Brune等(2014);K4模型与K2模型类似,都包括晶格热导率和辐射热导率,其晶格热导率与K2模型相同,而辐射热导率表达式选取自Hofmeister(2014),该辐射热导率模型仅考虑平行于温度梯度方向的辐射分量,而忽略辐射的衍射效应,同时纳入了近红外低吸收频段的辐射;K5模型则基于Grose和Afonso(2019)的有效介质理论,对该模型中的辐射热导率部分,本文选用单一矿物橄榄石在颗粒大小为2mm时热导率随温度变化的曲线(Grose and Afonso, 2019),并对其采用最小二乘拟合进行简化(表 2).
|
|
表 2 地幔热导率计算公式和参数 Table 2 The expression of mantle thermal conductivity and related parameters |


基于初始模型温度和静岩压力的空间分布(图 3b),本文给出了5个模型热导率随深度的分布曲线(图 3a).从值的相对大小来看,K5模型明显高于K1—K4模型,差值最大可达到4 W·m-1·K-1,而K2—K4模型较为接近,差值最高不超过0.5 W·m-1·K-1.

|
图 3 热导率(a)和温度、压力(b)随深度的变化曲线 Moho:莫霍面;LAB:岩石圈与软流圈界面. Fig. 3 Distribution of thermal conductivity (a), temperature and presssure (b) with depth Moho: crust and mantle boundary; LAB: lithosphere and asthenosphere boundary. |
为排除地壳热导率对结果带来的影响,本文对其取定值2.5 W·m-1·K-1(Brune et al., 2014;胡圣标和黄少鹏,2015;Bittner and Schmeling, 1995).
2 结果为了更好地对比不同热导率模型对岩石圈变形和热量输送的影响,本文选取了不同模型在张裂阶段发生相同伸展量(因边界移动速率相同,等同于伸展时长)的结果,以及破裂时刻的结果进行比对.为方便描述,本文将位于模型中部230~270 km的区域称为岩石圈高应变区域,而其他区域为低应变区域.依据热导率值的相对大小,本文在结果的描述中,将模型分为两组进行比对,K1和K5模型为一组,K2-K4模型为另一组,以突出不同热导率差值下,模型结果的对比差异.
2.1 K1和K5模型K1和K5模型在张裂早期(t=4.5 Myr)展现出相似的变形样式(图 4b、h),表现为岩石圈地幔纯剪切变形和地壳的脆性断裂,但不同的是K1模型的应变更为集中,岩石圈地幔的减薄更为强烈.随着进一步的伸展,二者的岩石圈地幔先于地壳破裂,所不同的是,K1模型破裂的时间更早,同时在相对快速的减薄下软流圈产生了部分熔融,而K5模型的减薄速率要明显低于K1模型,这也导致其岩石圈地幔的破裂时间滞后,且软流圈并未出现熔融,但其应变的分布相对K1模型更为均匀(图 4j、f).这一点从二者在t=~10 Myr时刻,x=150 km和x=250 km处地壳拉张因子的计算结果也可以看出(表 3).事实上,受到地幔高传导热的影响,K5模型的地壳变形逐渐由初期的脆性变形转变为后期的韧性变形(图 4j、l).在岩石圈破裂阶段,K5模型的破裂时间点(24.3 Myr)明显滞后于K1模型(11.3 Myr),且仍没有软流圈的熔融和析出过程,而K1模型的软流圈熔融范围不断扩大且有大量的玄武岩析出(图 4f),但由于其应变更为集中,形成的陆缘宽度(~65 km)要明显小于K5模型的(~150 km).值得注意的是,K5模型的下地壳熔融量显著高于K1模型的,且广泛分布于伸展区域,其熔融态从张裂初期一直延续至破裂阶段,这可能是由于高热导率地幔的持续热输送保持了熔融需要的温度条件.

|
图 4 K1和K5模型的演化结果 (a、c、e、g、i、k)表征不同时刻的地表热流(q0)、莫霍面热流(qm)和岩石圈底界热流(qlab)的横向分布;(b、d、f、h、j、l)表示物质和温度场的演化,其中图f和l为岩石圈破裂时刻的结果;(m、n、o)是x=250 km处热导率随深度的分布.以地壳厚度25 km作为陆缘宽度的起算点,发生破裂时K1模型的陆缘宽度为~65 km,K5模型的陆缘宽度为~150 km. Fig. 4 Evolution results of K1 and K5 model (a, c, e, g, i, k) show the horizontal distribution of heat flow at crust surface (q0), Moho (qm) and LAB (qlab); (b, d, f, h, j, l) show the evolution of composition and temperature, among which (f) and (l) are the results at the time of lithosphere breakup; (m, n, o) present the distribution of thermal conductivity with depth at x=250 km. We take the position where the crustal thickness is 25 km as a start point for continental margin, then the width of continental margin in K1 is ~65 km, and that in K5 is ~150 km. |
|
|
表 3 不同热导率模型下的张裂演化特征 Table 3 Features of various conductivity models during rifting |
在热量传输方面,张裂初期(图 4a、g)尽管二者的地表热流(q0)较为接近(75~100 mW·m-2),但在莫霍面热流(qm)和岩石圈底界热流(qlab)表现出明显的差异.对于qlab,在整个的伸展区域内,K5模型的值(~30 mW·m-2)始终高于K1模型的(~10 mW·m-2);而对于qm,不同区域表现出了不同的相对大小特征.在低应变的区域,K5模型的qm更高,在~50 mW·m-2,K1模型则为~30 mW·m-2;而在高应变区域,K1模型的qm表现出相对高值,最高达到~90 mW·m-2,K5模型则为~80 mW·m-2(图 4a、g).随着进一步的伸展直至破裂,K5模型的q0和qm在整个伸展区域内持续增加,且在低应变区域始终保持对K1模型的相对高值(图 4i、e),而K1模型的qm仅在高应变区域不断增加,同时也保持着对K5模型的相对高值.
2.2 K2、K3和K4模型与K1和K5模型存在明显的差异不同,由于热导率差异较小(最大0.45 W·m-1·K-1)(图 5s),无论是从减薄程度、熔融起始的时间、破裂时刻抑或是形成的陆缘宽度(表 3),K2-K4模型在张裂阶段均表现出十分相近的特征(图 5).但三者仍存在一定的差异,例如在破裂阶段(图 5f、l、r),K2和K4模型的破裂时间(13.6 Myr和13.7 Myr)略早于K3(15.4 Myr),且陆缘宽度(75 km和85 km)略低于K3(90 km).与K1和K5模型相比,三者变形样式和演化过程更接近K1模型,这可能是由于热导率更为接近,但事实上,三者更多地表现出介于K1和K5模型的特征(表 3).在热量传输方面,整个张裂过程中,三者的热流特征十分接近(图 5c、i、o).对于低应变区域,三者q0的范围分布在在75~80 mW·m-2,且在张裂过程中略有增加,而qm和qlab则较为稳定,分别为~35 mW·m-2和~25 mW·m-2,均表现出介于K1和K5模型的特征;而对于高应变区域,对比5个模型在t=~11 Myr时刻的热流特征(图 4e、i和图 5c、i、o)可以发现,K2—K4模型的各项热流值(~200 mW·m-2)仍介于K1(>200 mW·m-2)和K5(~100-200 mW·m-2)模型之间.

|
图 5 K2、K3和K4模型演化结果 (a、c、e、g、i、k、m、o、q)表征不同时刻的地表热流(q0)、莫霍面热流(qm)和岩石圈底界热流(qlab)的横向分布;(b、d、f、h、j、l、n、p、r)表示物质和温度场的演化,其中(f、l、r)为岩石圈破裂时刻的结果;(s、t、u)是x=250 km处热导率随深度的分布;破裂时刻K2模型的陆缘宽度为~75 km,K3模型的陆缘宽度为~90 km,而K4模型的陆缘宽度为~85 km. Fig. 5 Evolution results of K2, K3 and K4 model (a, c, e, g, i, k, m, o, q) show the horizontal distribution of heat flow at crust surface (q0), Moho (qm) and LAB (qlab); (b, d, f, h, j, l, n, p, r) show the evolution of composition and temperature, among which fig. (f, l, r) are the results at the time of lithosphere breakup; (s, t, u) present the distribution of thermal conductivity with depth at x=250 km. The width of continental margin in K2 is ~75 km, that in K3 is ~90 km, while in K4 the width is ~85 km. |
上地幔热传输方式主要有热传导和热对流两种(张健和许鹤华,2015;Turcotte和Schubert,2014).图 4、5中不同模型之间以及同一模型不同区域之间的qm表现出了不同的相对大小特征,表明不同热导率模型对地幔热传输过程有重要的影响.图 6展示了K1—K5模型在低应变区(图 6a)和高应变区域(图 6b)内,qm、莫霍面温度(Tm)及ΔTm(相同时刻下高低应变区域莫霍面的温度差)随时间的演化曲线.在低应变区(图 6a),热导率、qm和Tm存在良好的对应关系,即K5、K2—K4和K1模型的Tm和qm随热导率值的降低依次递减,这表明在伸展量相近(表 3)、生热率和初始地温场相同的情况下,热传导作用主导了区域内的地幔热传输过程,并显著影响了岩石圈的热状态.事实上,这也是K2—K4模型在Tm和qm的演化特征上均十分接近(图 6a)的原因.

|
图 6 低(a)、高应变区域(b)不同热导率模型Moho温度和热流的演化特征 单个符号表示莫霍面热流值,q1—q5分别对应K1—K5模型,曲线表征莫霍面温度(Tm,图a)或同一时刻高低应变区莫霍面温度差(ΔTm,图b)的演化,Tm1-Tm5和ΔTm1-ΔTm5对应于K1—K5模型. Fig. 6 The evolution of temperature and heat flow of Moho in regions of low strain rate (a) and high strain rate (b) of different models The symbols denote the value of Moho heat flow, q1—q5 correspond to K1—K5 model respectively, and different curves represent the evolution of Moho temperature (Tm, fig.a) or Moho temperature difference (ΔTm, fig.b), Tm1-Tm5 or ΔTm1-ΔTm5 correspond to K1—K5 model. ΔTm in (b) denotes the difference of Moho temperature at the same moment between regions of low strain rate and high strain rate. |
对于高应变区域,不同模型的温度增量显著高于低应变区域,且K1模型的ΔTm整体高于K2—K4模型,尤其显著高于K5模型,这表明区域内热对流的增温效应逐渐增强,且逐渐占据主导.这事实上与低热导率模型在张裂期的快速减薄及地幔快速上涌的过程相吻合.热对流的增强也导致区域内K1模型的qm逐渐超过K2—K5模型(图 6b).尽管如此,高热导率模型的莫霍面绝对温度仍高于低热导率模型(图 6a、b温度值相加),这源于高热导率模型的高传导热增温.事实上,由于低热导率模型的快速减薄(如K1),其地壳热阻显著降低,这导致即使qm相对较高,其Tm仍为低值(Bullard,1939).
3.2 热导率对岩石圈变形的影响地幔热导率对岩石圈变形的影响主要通过对温度场的控制实现.张裂阶段,高热导率模型升温显著,尤其是莫霍面温度(图 6a),这使得伸展区域内壳幔解耦增强(Gueydan et al., 2008)(图 7b),岩石圈强度整体下降,从而岩石圈的应变分布更为均匀而不易集中(图 7b),且减薄速率显著降低(图 7b);而低热导率模型正好相反,相对冷而强硬的岩石圈使其应变更易集中(图 7a),减薄更为迅速,在局部热对流增温的影响下,更进一步加速了减薄的过程.这实际上也解释了不同模型在岩石圈破裂时间和形成的陆缘宽度上出现明显差异的原因,即缓慢而相对均匀的减薄往往导致破裂时间较晚,形成的陆缘较宽;而快速集中的应变过程往往导致破裂较早,形成的陆缘较窄.

|
图 7 K1和K5模型在7.3 Myr时刻的应变速率分布 (a) K1模型;(b) K5模型. Fig. 7 The distribution of strain rate of K1 and K5 model at the time of 7.3 Myr (a) K1 model; (b) K5 model. |
值得提及的是,K5模型的结果显示,高热导率地幔导致Moho温度持续上升,并发生下地壳部分熔融.部分熔融导致下地壳强度持续降低,促进了地壳与地幔的解耦(图 7b),从而延长了张裂时间并增加了大陆边缘的宽度.事实上,当关闭模型中下地壳的熔融功能后,大陆边缘宽度仍可达到~120 km,这表明高地幔热导率仍有利于形成宽的大陆边缘.
3.3 热导率对熔融过程的影响从模型计算结果来看,热导率对熔融过程的影响主要体现在熔融起始时间、熔融量和析出量的差异.对比不同模型的熔融特征可以发现,高热导率模型的下地壳熔融作用显著,但软流圈熔融较弱,且熔融起始的时间晚于低热导率模型;而低热导率模型的软流圈熔融作用显著,熔融起始时间往往早于高热导率模型,但下地壳的熔融作用较弱.为更清晰地对比不同模型地幔的熔融程度,我们按下列公式计算了各模型在破裂时刻地幔的熔融量和析出量:
|
(10) |
|
(11) |
其中Smelt和Emelt分别代表熔融量和析出量,单位为km2,Xmelt和Xext分别代表网格点的熔融比例(%)和析出比例(%),dx和dy分别代表最靠近该网格点的横向网格间距和纵向网格间距,num1和num2分别代表熔融区域和析出区域的网格节点数量.结果表明,破裂时刻K1模型的熔融量和析出量显著高于K2—K4模型(表 3),其熔融和析出的范围及比例也明显大于K2—K4模型(图 8).

|
图 8 破裂时刻K1和K2模型的熔融和析出比例及范围 (a) K1模型,具体位置见图 4f;(b) K2模型,具体位置见图 5f. Fig. 8 The ratio of melt and melt extraction and the area of melting and melt extracting at the time of lithosphere breakup in K1 and K2 model (a) K1 model, see Fig. 4f for its position; (b) K2 model, see Fig. 5f for its position. |
前人的研究认为岩石圈在高热状态下,较低的伸展量就可以发生熔融(Brown and White, 1995).对于K5模型,在地幔高热导率的影响下,随着地壳温度不断升高,张裂初期下地壳即发生熔融,熔融厚度可达2~3 km(图 4j).但由于岩石圈减薄速率低且张裂时间较长,导致减压缓慢,地幔热散失增大(Brown and White, 1995),其软流圈并未发生明显的熔融;K1模型则相反,在地幔低传导热的影响下,其地壳温度没有明显增加,呈现出相对较冷的状态,因而仅有少量熔融.但由于岩石圈的快速减薄,其软流圈在地幔未破裂时就发生了减压熔融,比K2—K4模型早约2~7 Myr,且熔融作用强烈,熔融量和析出量远高于K2—K4模型.
3.4 热导率模型的理论基础差异及其影响上述的五个模型中,K2、K4和K5模型均由晶格热导率和辐射热导率两部分构成(表 1).对三者进行相应的解构可以发现,K5模型的晶格热导率和辐射热导率均高于K2和K4模型(图 9).对于晶格热导率,K5模型的高值源于其在晶格声子散射的基础上,还考虑了红外频段声子激化激元的扩散对热传导的贡献(图 9)(Hofmeister et al., 2014),而K2和K4模型仅考虑了声子的散射过程(Hofmeister,1999).

|
图 9 K2、K4和K5模型晶格热导率和辐射热导率构成 K5的晶格热导率由晶格声子(klp)和声子极化激元(kbpp)两部分贡献组成,前者由ρCp FT-G计算得到,后者由ρCp HT计算得到(Hofmeister et al., 2014).其中T表示温度,F、G和H均为拟合系数,并无实际物理意义,F=2267,G=1.202,H=0.00027. Fig. 9 Lattice and radiative thermal conductivity of K2, K4 and K5 model The lattice conductivity of K5 model is composed of two parts, one with the contribution of lattice phonons (klp) which is calculated by ρCp FT-G, the other with the contribution of bulk phonon-polaritons (kbpp) which is calculated by ρCp HT. T represents temperature, while F, G and H are fitting coefficients with no specific physical meaning. F =2267, G =1.2020, and H=0.00027. |
对于辐射热导率,K2模型主要基于普朗克黑体辐射理论,K4模型则在此基础上,结合了基尔霍夫定律和平均自由气体理论(Hofmeister,2014),不仅考虑了矿物颗粒大小对辐射的散射效应,还考虑了辐射衍射引入的误差及近红外低吸收频段的辐射(Hofmeister,2014).K5模型则基于Rosseland(1936)的辐射扩散方程,其辐射吸收系数通过对非吸收频段和吸收频段的吸收系数进行平均得到(Grose and Afonso, 2019).对于这种计算方式,部分学者认为并不合理(Hofmeister,2014;Hofmeister and Branlund, 2015),这是由于不同频段内辐射吸收差异可能会很大(Shankland et al., 1979;Hofmeister,2005;Pitman et al., 2013),如近红外频段内无水硅酸盐和氧化物的吸收系数几乎为0(Hofmeister,2014),这使得频段内热辐射的平均自由程显著增大,从而导致辐射热导率值增大,但Hofmeister等(2005)认为当吸收系数近于0时,辐射热导率应当为0,这是由于光子并没有被介质吸收,因而对介质的热传输并没有贡献.由此在计算K4模型时,Hofmeister(2014)仅对有效频段进行了计算.这也是K5模型的辐射热导率高于K4模型的主要原因.另外,Grose and Afonso等(2019)认为K4模型仅考虑平行于地温梯度的辐射并由此去掉经典热辐射理论公式(如Clark,1957)中的折射相关系数(n2)并不合理,他们认为介质中的热辐射强度与n2呈正相关.这也使得K5模型的热导率值相对K4进一步增大.而对于K1模型,其基于对不同温压下实验室测定的岩石热导率的统计,样品测定的温度范围在0~1300 ℃,压力范围在0~500 MPa,对于超出范围的部分通过外推得到.由于不同样品在矿物组成、孔隙度和裂缝发育方面存在一定的差异,某一岩类如超基性岩的经验公式与真实的结果会存在一定的偏差.
基于以上分析,正是热导率模型间理论基础的差异,导致了不同模型在数值和空间分布规律上的不同.这种差异使得不同模型的选取可能会对动力学模拟结果造成显著的影响.对于本文研究的岩石圈张裂过程,地幔热导率通过对岩石圈温度场或热状态的影响,改变了岩石圈的强度和流变性质,从而引起了岩石圈变形方式和运动学特征的变化,进而影响了地幔熔融的起始时间和量的大小.而具体来看,地幔热导率对于岩石圈变形和熔融过程的影响程度并不相同.对于前者,当热导率差值在2.0 W·m-1·K-1以上时,如K4和K5模型,岩石圈变形的差异才较为明显;而对于后者,当热导率的差值在1.0 W·m-1·K-1之上时,如K1和K2模型,熔融量的差异就已经十分显著.这表明对于不同的热-力学过程,热导率差异引起的变化是不同的.另外,值得注意的是,尽管K3模型为定值模型,但其与K2、K4模型的演化特征十分接近,这表明模拟的结果受热导率随温压变化的影响较小,即对于动力学模拟,其结果可能更多地受到热导率数值的影响.
4 结论本文利用动力学数值模拟的方法,对比了不同地幔热导率模型下对岩石圈变形和熔融特征的差异,分析了热导率对岩石圈变形及熔融过程的影响机制,并讨论了不同热导率模型理论基础的差异及其对动力学模拟的影响,主要取得了以下几点认识:
(1) 热导率对地幔热传输过程有显著的影响.岩石圈减薄速率较低时,高热导率模型的地幔热传输效率更高,主要以热传导的方式实现,而在减薄速率较高时,低热导率模型的传输效率更高,主要以热对流的形式实现.
(2) 热导率对岩石圈变形过程有明显的控制作用.高热导率下,岩石圈强度整体降低,壳幔解耦增强,应变更为均匀,形成的陆缘更为宽阔;而低热导率下,岩石圈强度整体强硬,局部降低显著,应变更为集中且岩石圈减薄迅速,形成的陆缘往往较窄.
(3) 热导率对壳幔熔融作用亦有显著的影响.高热导率下的地壳呈较热的状态,其下地壳熔融强烈,但由于较强的散热效应和慢速减压过程,软流圈熔融较弱且起始时间较晚;低热导率下的地壳呈较冷的状态,其下地壳熔融程度低,但由于弱的散热效应和快速减压过程,其软流圈熔融较强且起始时间较早.
(4) 基于不同的理论基础,不同热导率模型在数值和空间分布的规律上呈现出较为明显的差别,这种差别尤其是数值上的差异对动力学模拟的结果有着较为显著的影响,但对于不同的热-力学过程,影响程度并不相同,对熔融过程的影响程度高于岩石圈变形过程.
Afonso J C, Ranalli G. 2004. Crustal and mantle strengths in continental lithosphere:is the jelly sandwich model obsolete?. Tectonophysics, 394(3-4): 221-232. DOI:10.1016/j.tecto.2004.08.006 |
Bittner D, Schmeling H. 1995. Numerical modelling of melting processes and induced diapirism in the lower crust. Geophysical Journal International, 123(1): 59-70. DOI:10.1111/j.1365-246X.1995.tb06661.x |
Brown J W, White R S. 1995. Effect of finite extension rate on melt generation at rifted continental margins. Journal of Geophysical Research:Solid Earth, 100(B9): 18011-18029. DOI:10.1029/94JB01478 |
Brune S, Heine C, Pérez-Gussinyé M, et al. 2014. Rift migration explains continental margin asymmetry and crustal hyper-extension. Nature Communications, 5: 4014. DOI:10.1038/ncomms5014 |
Bullard E C. 1939. Heat flow in South Africa. Proceedings of Royal Society A Mathematical, Physical and Engineering Sciences, 173(955): 474-502. |
Burov E B. 2011. Rheology and strength of the lithosphere. Marine and Petroleum Geology, 28(8): 1402-1443. DOI:10.1016/j.marpetgeo.2011.05.008 |
Clark S P. 1957. Absorption spectra of some silicates in the visible and near infrared. American Mineralogist, 42: 732-742. |
Clauser C, Huenges E. 1995. Thermal conductivity of rocks and minerals.//Ahrens T J ed. Rock Physics & Phase Relations. Washington DC: American Geophysical Union, 105-126. https://www.researchgate.net/publication/237302572_Thermal_Conductivity_of_Rocks_and_Minerals
|
Crameri F, Schmeling H, Golabek G J, et al. 2012. A comparison of numerical surface topography calculations in geodynamic modelling:an evaluation of the 'sticky air' method. Geophysical Journal International, 189(1): 38-54. DOI:10.1111/j.1365-246X.2012.05388.x |
Dubuffet F, Yuen D A, Rabinowicz M. 1999. Effects of a realistic mantle thermal conductivity on the patterns of 3-D convection. Earth and Planetary Science Letters, 171(3): 401-409. DOI:10.1016/S0012-821X(99)00165-X |
Dubuffet F, Yuen D A. 2000. A thick pipe-like heat-transfer mechanism in the mantle:Nonlinear coupling between 3-D convection and variable thermal conductivity. Geophysical Research Letters, 27(1): 17-20. DOI:10.1029/1999GL008338 |
Gerya T V, Yuen D A. 2003. Characteristics-based marker-in-cell method with conservative finite-differences schemes for modeling geological flows with strongly variable transport properties. Physics of the Earth and Planetary Interiors, 140(4): 293-318. DOI:10.1016/j.pepi.2003.09.006 |
Gerya T V, Yuen D A. 2007. Robust characteristics method for modelling multiphase visco-elasto-plastic thermo-mechanical problems. Physics of the Earth and Planetary Interiors, 163(1-4): 83-105. DOI:10.1016/j.pepi.2007.04.015 |
Gerya T V. 2010. Introduction to Numerical Geodynamic Modelling. New York: Cambridge University Press.
|
Gerya T V. 2013. Three-dimensional thermomechanical modeling of oceanic spreading initiation and evolution. Physics of the Earth and Planetary Interiors, 214: 35-52. DOI:10.1016/j.pepi.2012.10.007 |
Goncharov A F, Haugen B D, Struzhkin V V, et al. 2008. Radiative conductivity in the Earth's lower mantle. Nature, 456(7219): 231-234. DOI:10.1038/nature07412 |
Grose C J, Afonso J C. 2019. New constraints on the thermal conductivity of the upper mantle from numerical models of radiation transport. Geochemistry Geophysics Geosystems, 20(5): 2378-2394. |
Gueydan F, Morency C, Brun J P. 2009. Continental rifting as a function of lithosphere mantle strength. Tectonophysics, 460(1-4): 83-93. |
Hofmeister A M. 1999. Mantle values of thermal conductivity and the geotherm from phonon lifetimes. Science, 283(5408): 1699-1706. DOI:10.1126/science.283.5408.1699 |
Hofmeister A M. 2005. Dependence of diffusive radiative transfer on grain-size, temperature, and Fe-content:Implications for mantle processes. Journal of Geodynamics, 40(1): 51-72. DOI:10.1016/j.jog.2005.06.001 |
Hofmeister A M. 2014. Thermodynamic and optical thickness corrections to diffusive radiative transfer formulations with application to planetary interiors. Geophysical Research Letters, 41(9): 3074-3080. DOI:10.1002/2014GL059833 |
Hofmeister A M, Dong J J, Branlund J M. 2014. Thermal diffusivity of electrical insulators at high temperatures:Evidence for diffusion of bulk phonon-polaritons at infrared frequencies augmenting phonon heat conduction. Journal of Applied Physics, 115(16): 163517. DOI:10.1063/1.4873295 |
Hofmeister A M, Branlund J M. 2015. Thermal conductivity of the earth. Treatise on Geophysics, 2: 583-608. |
Hu S B, Huang S P. 2015. Terrestrial heat flow in the continental area of China.//Wang J Y ed. Geothermics and Its Application (in Chinese). Beijing: Science Press, 64-122.
|
Huang S P. 1992. Variations of heat flow and crustal thickness in the Continental area of China. Acta Geophysica Sinica (in Chinese), 35(4): 441-450. |
Jaupart C, Mareschal J C. 2015. heat flow and thermal structure of the lithosphere.//Schubert G ed. Treatise on Geophysics, 6. Netherland: Elsevier, 583-608.
|
Katayama I, Karato S. 2008. Low-temperature, high-stress deformation of olivine under water-saturated conditions. Physics of the Earth Planetary Interior, 168(3-4): 125-133. DOI:10.1016/j.pepi.2008.05.019 |
Katz R F, Spiegelman M, Langmuir C H. 2003. A new parameterization of hydrous mantle melting. Geochemistry, Geophysic, Geosystems, 4(9): 1073. DOI:10.1029/2002GC000433 |
Li Z H, Liu M Q, Gerya T. 2015. Material transportation and fluid-melt activity in the subduction channel:numerical modeling. Science China Earth Sciences, 58(8): 1251-1268. DOI:10.1007/s11430-015-5123-5 |
Liao J, Gerya T, Wang Q. 2013. Layered structure of the lithospheric mantle changes dynamics of craton extension. Geophysical Research Letters, 40(22): 5861-5866. DOI:10.1002/2013GL058081 |
Liao J, Gerya T. 2014. Influence of lithospheric mantle stratification on craton extension:Insight from two-dimensional thermo-mechanical modeling. Tectonophysics, 631: 50-64. DOI:10.1016/j.tecto.2014.01.020 |
Liao J, Gerya T. 2015. From continental rifting to seafloor spreading:Insight from 3D thermo-mechanical modeling. Gondwana Research, 28(4): 1329-1343. DOI:10.1016/j.gr.2014.11.004 |
Manatschal G, Lavier L, Chenin P. 2015. The role of inheritance in structuring hyperextended rift systems:Some considerations based on observations and numerical modeling. Gondwana Research, 27(1): 140-164. DOI:10.1016/j.gr.2014.08.006 |
Pitman K M, Hofmeister A M, Speck A K. 2013. Revisiting astronomical crystalline forsterite in the UV to near-IR. Earth, Planets and Space, 65(1): 129-138. |
Ranalli G. 1995. Rheology of the Earth. London: Chapman and Hall.
|
Rosseland S. 1936. Theoretical Astrophysics. Atomic Theory and the Analysis of Stellar Atmospheres and Envelopes. Oxford: Clarendon Press.
|
Schmeling H, Babeyko A Y, Enns A, et al. 2008. A benchmarkcomparison of spontaneous subduction models-Towards a free surface. Physics of the Earth and Planetary Interiors, 171(1-4): 198-223. DOI:10.1016/j.pepi.2008.06.028 |
Shankland T J, Nitsan U, Duba A G. 1979. Optical absorption and radiative heat transport in olivine at high temperature. Journal of Geophysical Research:Solid Earth, 84(B4): 1603-1610. DOI:10.1029/JB084iB04p01603 |
Turcotte D, Schubert G. 2014. Geodynamics. Cambridge: Cambridge University Press.
|
Van Den Berg A P, Yuen D A, Steinbach V. 2001. The effects of variable thermal conductivity on mantle heat-transfer. Geophysical Research Letters, 28(5): 875-878. DOI:10.1029/2000GL011903 |
Van Den Berg A P, Yuen D A, Allwardt J R. 2002. Non-linear effects from variable thermal conductivity and mantle internal heating:implications for massive melting and secular cooling of the mantle. Physics of the Earth and Planetary Interiors, 129(3-4): 359-375. DOI:10.1016/S0031-9201(01)00304-1 |
Zhang J, Xu H H. 2015. The Earth's internal heat and heat transfer.//Wang J Y ed. Geothermics and Its Application (in Chinese). Beijing: Science Press, 19-63.
|
Zhao P, He L J, Liu S W, et al. 2015. Thermal structure of the lithosphere.//Wang J Y ed. Geothermics and Its Application (in Chinese). Beijing: Science Press, 186-253.
|
胡圣标, 黄少鹏. 2015.中国陆地大陆热流.//汪集暘.地热学及其应用.北京: 科学出版社: 64-122.
|
黄少鹏. 1992. 我国大陆地区大地热流与地壳厚度的变化. 地球物理学报, 35(4): 441-450. DOI:10.3321/j.issn:0001-5733.1992.04.006 |
张健, 许鹤华. 2015.地球内热与热传递.//汪集暘.地热学及其应用.北京: 科学出版社: 19-63.
|
赵平, 何丽娟, 刘绍文, 等. 2015.岩石圈热结构.//汪集暘.地热学及其应用.北京: 科学出版社, 186-253.
|