 2020, Vol. 63


2. 山东省地震局, 济南 250102;
3. 中国科学技术大学地球和空间科学学院, 合肥 230026
2. Shandong Earthquake Agency, Jinan 250102, China;
3. School of Earth and Space Sciences, University of Science and Technology of China, Hefei 230026, China
应力降是断层面上剪应力在地震前后的差值,是表征震源过程的一个基本参数(Huang et al., 2016).应力降通常通过地震的震源谱估算(Goebel et al., 2015).震源谱是震源时间函数在频率域内的体现,其中包含了地震破裂和停止等物理过程的信息.根据震源谱的幅值和形状可以计算出应力降、地震矩、辐射能量等参数,对于了解震源过程的物理性质至关重要,同时这也是地震危险性评估中必不可少的关键参数(Baltay et al., 2017; Trugman and Shearer, 2017).
对于中小地震而言,应力降的计算很大程度上取决于震源谱中拐角频率识别的准确性.这就要求必须有效地去除地震观测谱中传播路径上的衰减效应和台站效应,分离得到真实的震源谱.如果分离不彻底,将会导致估算的应力降存在较大的误差(Wu et al., 2018).目前已经发展了多种方法用于从地震观测谱中估算应力降(Huang et al., 2016),其中最常用的有多台多震源联合反演法和经验格林函数法.
多台多震源联合反演法是根据单段或三段几何衰减模型,估算传播路径上的非弹性衰减系数(品质因子Q)和台站场地响应,然后从观测谱中扣除这些因素的影响而获得震源谱(Boatwright et al., 1991; Atkinson and Mereu, 1992; Moya et al., 2000; 周仕勇等,2001; 刘杰等, 2003; 华卫等, 2009; 赵翠萍等, 2011; Zhu and Chen, 2012; 郑建常等, 2016; Cramer, 2017; Sumy et al., 2017;Wang et al., 2017).经验格林函数(Empirical Green′s Function, EGF)法是将目标地震附近震级至少相差1的小地震信号作为经验格林函数,与其进行反卷积以去除衰减效应(Mueller, 1985;Hough, 1997; Prieto et al., 2006; Abercrombie, 2013; Huang et al., 2016; Ross and Ben-Zion, 2016).
以上提及的多台多震源联合反演法和经验格林函数法计算量大、效率低,并且容易受到随机噪声的干扰,因而仅适合研究少量信噪比较高的地震事件.近年来诱发地震和震群等群发性小地震事件受到越来越多的关注,理解这些地震的震源特性对于认识群发地震事件的机理具有重要意义(Fischer and Hainzl, 2017; Huang et al., 2017).为解决大规模中小地震应用中的计算效率和稳定性问题,Warren和Shearer(2002)提出一种广义叠加反演方法.该方法通过叠加观测谱增强信号的共同特征,降低随机噪声的影响;也可以在不知道地震台站附近的场地响应、仪器响应以及传播路径上衰减系数的情况下,利用迭代反演得到震源谱.Shearer等(2006)进一步发展了这种方法,利用不同分组的震源谱与理论谱拟合得到的经验格林函数进一步校正了分离出的震源项,并计算了南加州60000次1.5~3.1级地震的震源参数.随后该方法被广泛应用于分析全球中强地震的相似性或某地区群发地震事件的发震机理(Allmann and Shearer, 2009; Goebel et al., 2015; Denolle and Shearer, 2016; Trugman et al., 2017).
通常广义叠加反演方法都是基于恒定应力降模型的假设(Aki, 1967),这样会使得计算的震源参数更倾向于自相似的结论.尽管这种自相似的观点在很多其他研究中也得到了证实(Aki, 1967; Choy and Boatwright, 1995; Ide and Beroza, 2001; Prieto et al., 2004; Allmann and Shearer, 2009; Abercrombie et al., 2017),但另外一些研究中也发现了应力降随地震矩增加而增大的证据(Mayeda and Walter, 1996; Izutani and Kanamori, 2001; Mori et al., 2003; Lin et al., 2016; Trugman and Shearer, 2017).关于自相似性的问题至今仍无定论,这种争论也对我们理解地震破裂过程中的尺度关系会有很大帮助(Kanamori and Rivera, 2004; Cocco et al., 2016).因此需要在反演过程中也考虑非恒定应力降模型以全面地描述震源的性质.Trugman和Shearer(2017)提出了更为一般化的应力降模型,该模型不事先假定震源的自相似性,而是对自相似和非自相似模型均进行迭代拟合,从而获得拟合残差最小的最优模型.
本文将广义叠加反演和一般化的应力降模型相结合,估算了山东长岛震群ML≥1.0地震的应力降,通过分析应力降的尺度关系和时空变化特征,以期更好地理解震群的发展过程及其机理.文章中我们首先介绍了方法的基本原理和数据处理流程;随后简述了长岛震群的发展过程;然后利用广义叠加反演方法处理并得到了长岛震群1431个ML≥1.0地震的应力降;最后分析了应力降的总体趋势和变化特征,并讨论了长岛震群应力降的物理意义.
1 计算方法和处理流程本文所用的广义叠加反演方法的具体流程分为以下四步:(1)震源项分离:将观测谱分离为震源项、路径项和台站项;(2)统一经验格林函数(EGF)求取:将分离的震源项按事件震级分组叠加以提高信噪比突出共同项.利用最小二乘法求取一个统一的经验格林函数(EGF)使得所有分组的均值震源谱与理论震源谱的综合残差最小;(3)震源谱校正:利用获得的EGF对每个事件的震源项进行校正,以去除共同路径上的衰减效应(如近源衰减等)的影响,得到每个事件的真实震源谱; (4)应力降估算:利用得到的震源谱估算每个事件震源谱的拐角频率和应力降等参数.
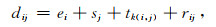
1.1 震源项分离台站j记录到地震i的位移谱可以表示为震源项、台站项和路径项的卷积,在频率域取对数后,观测谱dij可以表示为:
|
(1) |
其中ei为震源项,包含震源谱和近源衰减;sj是台站项,包括场地响应、仪器响应和近台站端的衰减;tk(i, j)是路径项,包括传播路径上的几何衰减和非弹性衰减;rij是该路径上的残差.通常可以将tk(i, j)简化成震相走时的函数,并以1 s为间隔离散化为不同的区间,以覆盖所有的传播路径(Shearer et al., 2006).
由于一个地震会被多个台站记录到,在不同台站的记录中震源项相同而路径项和台站项是不同的.对于不同台站记录的观测谱进行叠加,记录中不同的部分(路径项和台站项)可能会相互抵消,相同部分(震源项)会被加强.因而多台站叠加的观测谱可以作为震源项的近似.同理同一台站对多个地震的观测谱叠加可以作为台站项的近似(图 1).实际操作中可以通过多次迭代更加精确地分离不同项,具体迭代过程如下(如Yang et al., 2009):

|
图 1 观测谱分离原理示意图,其中包括震源项(Source term)、路径项(Path term)和台站项(Station term) 五角星代表地震(i=1, 2, 3, …, m),三角形为地震台站(j=1, 2, 3, …, n),在地震和台站之间的连线代表传播路径. Fig. 1 Schematic diagram of principle of separation of observed spectrum, including source term, path term and station term The star represents earthquake (i=1, 2, 3, …, m), triangles are seismic station (j=1, 2, 3, …, n), and lines between earthquake and station indicate propagation path. |
(1) 首先将台站j记录到的所有地震的观测谱平均值作为台站j的台站项初始值:

|
(2) |
其中m为被台站j记录到的地震总数.并设定震源项ei1、路径项tk(i, j)1和残差项rij1的初始值为0.
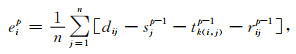
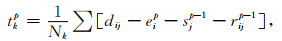
(2) 第p次迭代过程中(p=2, 3, …),震源项、路径项和台站项分别为
|
(3) |
|
(4) |

|
(5) |
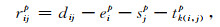
其中n是记录到第i次地震的台站总数,tk(i, j)p-1中的k为路径ij的走时对应的分组,Nk是第k组走时内的地震事件总数.将式(3)(5)代入式(1),得到第p次迭代过程中的残差项为:
|
(6) |
我们控制残差rijp的均值在[-1, 1]之间.如果超过这个范围,则删除对应的观测谱dij.如果地震事件i的台站观测谱少于4个,则该地震事件将被舍去.
(3) 计算震源项、台站项和路径项绝对偏差的和: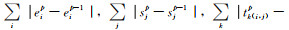

上述迭代过程往往在2~3次迭代后就能收敛.这样就从观测谱中分离出了震源项、台站项和路径项.
1.2 经验格林函数(EGF)求取1.1节的分离方法是利用多台站和多震源之间观测谱的差异,通过叠加、迭代等过程实现不同成分谱的分离.这种过程对于相同部分是无法分离的,因此得到的震源项中包含了相同的近源衰减甚至场地响应和仪器响应等.为了得到准确的震源谱,有必要对分离的震源项进行进一步的修正(Trugman and Shearer, 2017).这个修正过程是通过叠加震源谱与理论谱拟合的方式实现的(Shearer et al., 2006).该方法假设震级相近地震的平均震源谱符合特定的理论震源模型,修正的过程就是寻找一个统一的修正函数(经验格林函数, EGF)使得所有的平均震源谱与理论震源谱的差别最小.
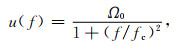
假设震源为Brune圆盘破裂模型(Brune, 1970),其位移谱具有如下形式:
|
(7) |
其中f是频率,fc为拐角频率,Ω0为与地震矩成正比的低频幅值(Kanamori and Rivera, 2004).方程(7)中存在拐角频率fc和低频幅值Ω0两个未知参数,其中低频幅值Ω0是远低于拐角频率时在低频平坦段的幅值(Prieto et al., 2004),继而可以利用经验关系求得地震矩(Kanamori and Rivera, 2004).拐角频率fc与应力降和地震矩存在如下关系(Brune, 1970):

|
(8) |
其中β为剪切波速度(通常取3.5 km·s-1),M0为地震矩,Δσ为应力降,k是常数(对于S波,k=0.37)(Brune, 1970).
在地震矩M0确定的情况下,拐角频率fc仅与应力降Δσ有关.根据震源谱估算应力降就是寻找应力降Δσ使得公式(7),(8)得到的理论震源谱最接近观测震源谱.在以往的研究中,通常会假定应力降Δσ为常数值(与Ω0无关),通过网格搜索得到最理想的应力降值使得叠加谱和理论谱的残差最小(Shearer et al., 2006).但这种基于恒定应力降的假设,往往会使得震源参数更倾向于自相似的结论.因此本文利用更为一般化的应力降模型(Trugman and Shearer, 2017),如下:

|
(9) |
其中ε=[ε0, ε1, ε2, …, εn]是表示应力降和地震矩的n阶模型参数,0阶模型对应着恒应力降模型.由于过于复杂的模型并不会显著提高拟合效果(Trugman and Shearer, 2017),本文仅对自相似模型(0阶)和非自相似模型(1阶)的理论谱与叠加震源谱的拟合情况进行对比.所用网格搜索算法的具体步骤如下:
(1) 首先将由1.1节中分离的震源项按震级分档叠加求均值作为该档震级的观测震源谱;
(2) 分别在[-3, 2]和[0, 1]范围内对ε0和ε1以0.01为步长执行以下(3)—(5)步,其中ε0的搜索范围对应着ε1=0时的应力降值为10-4~102MPa之间;
(3) 根据每档地震的地震矩,利用公式(7)—(9)计算每档地震的理论震源谱;
(4) 计算每档观测震源谱与理论震源谱的差值,并对各组差值加权(以每档地震数为权重)平均得到经验格林函数(EGF);
(5) 对各档震源谱进行EGF校正,并计算校正谱与理论震源谱以1/logf为权重的加权残差,权重的选取是为防止高频部分的随机波动对拟合的干扰(Trugman and Shearer, 2017);
(6) 选取搜索空间中残差最小时的最佳经验格林函数EGF、ε0和ε1,用于随后的单个事件震源谱校正和应力降估计.
1.3 震源谱的校正和应力降的估算虽然1.2节网格搜索算法中每档应力降值可能不一样,但EGF校正对各档是通用的(Shearer et al., 2006).利用1.2节中得到的最佳经验格林函数(EGF),进一步校正1.1节中分离出的每个地震的震源项,得到真实震源谱.采用非线性最小二乘法对每个地震的震源谱和理论谱进行拟合,得到低频幅值Ω0和拐角频率fc,并利用渐近正态分布法进一步估计参数的95%置信区间,再由式(8)计算得到应力降.
2 数据和处理 2.1 研究区域2017年2月14日开始,山东长岛地区发生持续地震活动,截止到2017年9月,共记录到地震2500多次,其中ML≥1.0地震1855次,最大地震为3月3日ML4.5地震.此次震群位于NWW向的张家口—蓬莱断裂的东端,区内断裂错综复杂,主要由NWW向的蓬莱—威海断裂和NE向的小断裂组成(图 2).研究区域内断层多数以正断兼走滑为主,部分具有逆冲性质(郑建常等, 2018).震群150 km范围内共有16个地震固定台站,所有台站均为三分量宽频带地震仪,采样率为100 Hz.我们从山东数字地震台网获得了1816个ML≥1.0的地震事件(图 2)波形和震相报告.

|
图 2 长岛震群及台站分布图 图中黑色三角形为地震台站,红色圆为山东地震台网定位的长岛震群地震位置,灰色线为断层分布,黄色五角星为图 3中的示例地震(2017-02-14 17:31:24 ML2.8地震),左上角的小图中的红色方框为本文所研究的区域. Fig. 2 Distribution of Chang Island earthquake swarm and seismic stations The black triangles are the seismic stations, the red circles are Chang Island earthquake swarm located by Shandong Seismic Network, the gray lines are the faults, the yellow star is the example earthquake in Fig. 3 (2017-02-14 17:31:24 ML2.8), and the red box in the small map of the upper left corner is the study area in this paper. |

|
图 3 广义叠加反演方法计算示例,按1.1节流程经叠加迭代后从观测谱(黑色线)中分离出震源项(红色线)、台站项(橙色线)、路径项(蓝绿色线)、残差项(灰色线);利用1.2节流程得到的EGF校正后得到真实震源谱(紫色线),与理论谱(蓝色线)拟合得到拐角频率(绿色线)和95%置信区间(黑色点线).图中是2017-02-14 17:31:24 ML2.8地震,纵坐标是取对数后的相对幅值,图中不同颜色的标注对应相应颜色的线 Fig. 3 A calculation example of generalized superposition inversion method. Source term (red line), station term (orange line), path term (blue-green line) and residual term (grey line) are separated from observed spectrum (black line) by superposition iteration according to 1.1 section. The true source spectrum (purple line) is obtained through EGF correction by 1.2 section procedure. The corner frequency (green line) and 95% confidence interval (black dot line) are obtained by fitting theoretical spectrum (blue line) to the true source spectrum (purple line). The figure shows the example of the earthquake 2017-02-14 17:31:24 ML2.8. The ordinate is the relative logarithm magnitude. The marks of different color in the figure correspond to corresponding color lines. |
首先我们将所有台站记录去趋势和去均值后,旋转到ZRT坐标系.由于S波通常具有比P波更高的信噪比(Ross and Ben-Zion, 2016),本文中我们利用S波观测谱反演震源参数.选取S波到时后10 s(为了便于快速傅里叶变换,取1024个点)的窗长计算S波谱,同时取P波到时前10 s窗口的信号计算噪声谱(用于信噪比的计算).对选取的观测数据利用凯塞(Kaiser)窗进行加窗处理,这样能同时保证数据的幅值精度和频率精度(郑建常等,2016).然后利用快速傅里叶变换得到观测谱.由于所用地震仪均是三分量速度记录,我们将速度谱转换为位移谱,并将各分向的位移谱进行矢量合成得到总位移谱(陈学忠和李艳娥, 2007).我们只保留了在2~20 Hz(位于所有仪器的平坦响应范围内)区间内信噪比大于5的台站谱,并保证每个地震至少被4个台站记录到.最后本文共计算了1816个地震的10904个台站位移谱.
首先,选取2~45 Hz的台站位移谱,按照1.1节的处理流程经过3次迭代之后得到了1431个事件震源项、16个台站项和42个路径项.图 3是2017-02-14 17:31:24 ML2.8地震(图 2)分离后的结果,可以看到观测谱是分离出的震源项、台站项、路径项和残差项的叠加.分离出的震源项与观测谱相比在低频端更加平缓,在高频段扣除台站、路径项后幅值明显增加.台站项在高频段衰减很大,影响了观测谱在高频段的形态,表明近地表衰减是比较强的.路径项较为平缓,由于研究范围较小,传播路径的影响不大或者被台站项及震源项吸收.残差项在均值附近波动,特别是高频段波动较大,也反映出在高频段分离的误差较大.分离出的震源项、台站项、路径项和残差项的形态与其他学者利用该方法得到的结果一致(Yang et al., 2009).
然后以震级0.2为间隔将长岛震群1431个震源项进行分组求均值.在实际计算中发现,尽管叠加后的波谱形态更为稳定,但低频部分仍会出现随机不规则的波动(图 3).为减小低频波动对结果的影响,我们利用稳健的加权线性最小二乘法对波谱曲线做平滑处理,在不改变其他频段波谱形状的基础上实现低频部分的平滑.为了保证叠加波谱曲线的稳定性,我们舍去少于20个事件的震级区间,最终保留了ML1.0~2.4之间8个分组平均谱(图 5a)用于计算经验格林函数.

|
图 5 长岛震群经EGF校正前和校正后的叠加观测谱示例图 (a)在EGF校正前以震级0.2为间隔分组叠加的观测谱;(b)和(c)中经EGF校正后的震源谱用黑线表示,每组对应的理论震源谱用蓝色虚线表示,纵坐标均取对数.其中(b)假设震源为自相似的恒定应力降模型.自相似模型在低震级和高震级组中的高频部分拟合不太好;(c)假设震源为应力降随地震矩线性增加的模型,该模型比自相似模型的拟合更好一些. Fig. 5 Example of superposition observed spectra of Chang Island swarm before and after EGF correction (a) Observed spectra with magnitude 0.2 as interval group before EGF correction, the black lines in (b) and (c) are source spectra after EGF correction, and theoretical source spectrum corresponding to each group are represented by blue dashed lines, and ordinates are logarithmic. (b) It is assumed that the source is a self-similar constant stress drop model. The high frequency part of the self-similar model is not well fitted in the low and high magnitude groups; (c) It is assumed that the source is a model of stress drop increasing linearly with seismic moment, the model fits better than the self-similar model. |
同时以ML1.6震级档的震源项为例测试了叠加求均值方法的稳定性,按相对对数幅值分为20个区间,计算每个频率点上震源项在每个区间的概率.根据每个频率点上最大概率所在幅值区间、震源项的均值和中值,分别得到了最大概率曲线(图 4中紫线)、均值线(图 4中红线)和中值线(图 4中蓝绿线).可以看到均值线与最大概率曲线更为接近一些,尤其是在高频部分,基本与最大概率曲线一致.同时均值线相较于其他两条线也更加平滑,均值反映的是所有区间上的共同表现,将差异变小,突出了共同点.同时按照1.2节所说,经验格林函数校正也是为了消除共同路径效应,而且我们的额外测试表明利用均值和中值的计算结果差别可以忽略,因此我们采取了均值的叠加策略.

|
图 4 震源谱叠加策略图,以ML1.6震级区间的震源谱为例,将纵坐标[-1, 1]之间分为20个区间,计算每个频率点上的震源谱在每个区间的概率 色标代表概率值,图中黑色线代表震源谱在每个频率点的上下边界线,紫色线为最大概率曲线,蓝绿色线为震源谱的中值线,红色是震源谱的均值线用于代表ML1.6震级档的震源项. Fig. 4 Strategic of source spectrum superposition. Taking the source spectrum of ML1.6 magnitude interval as an example, the ordinate [-1, 1] are divided into 20 intervals, and the probability of source spectrum in each interval at each frequency point is calculated The color mark represents the probability. The black line represents the upper and lower boundary lines of the source spectrum at each frequency point. The purple line is the maximum probability curve, the blue-green line is the median line of the source spectrum, and the red line is the mean line of the source spectrum used to represent the source term of the ML1.6 magnitude range. |
按照1.2节的计算步骤,我们得到了自相似模型(图 5b)和非自相似模型(图 5c)假设下的经验格林函数.可以看到使用简单恒定应力降模型的理论谱与经EGF校正后的均值谱在ML1.4~2.0之间4个组内拟合较好,但在较小震级(ML1.0、ML1.2)和较大震级(ML2.2、ML2.4)分组中的拟合不是很好(图 5b),而非自相似模型的拟合在所有震级档都明显优于恒定应力降模型(图 5c).
最后我们利用获得的最佳EGF进一步校正每个地震的震源项后得到真实震源谱(如图 3),再利用1.3节提到的非线性最小二乘法与理论谱进行拟合,得到每个地震的低频幅值Ω0和拐角频率fc,并利用基于参数估计的渐进正态分布方法得到拐角频率fc的拟合误差,将拐角频率fc代入公式(8)估算得到了1431个ML≥1.0地震的应力降.
3 结果下面将介绍长岛震群应力降的显著特征,重点分析应力降的总体趋势和时空变化特征.
长岛震群应力降的变化范围很大,在0.009~3.04 MPa之间,超过2个量级.由于地震应力降值是正值,绝大多数地震的应力降集中在低值区域.为了更好地分析震群应力降的统计特征,我们对应力降的对数进行分析.应力降的对数值在均值附近的地震数量最多,大多数地震主要集中在0.03~3 MPa之间,超出这个范围的地震事件较少,应力降对数的频度呈正态分布(图 6a).这种超过2个量级的差异性在大规模地震事件研究中是常见的,且一般都成对数正态分布(Abercrombie, 1995; Baltay et al., 2011).长岛震群应力降中值为0.3 MPa,远低于全球3~4 MPa的应力降中值(Abercrombie, 1995; Allmann and Shearer, 2009)以及中国大陆主要活动区的应力降(0.1~20 MPa)(赵翠萍等, 2011).

|
图 6 应力降统计直方图(a)和震级-时间图(b) (a)中红色实线为正态分布曲线; (b)中色标代表应力降的高低,红色代表高应力降. Fig. 6 Statistical histogram of stress drop (a) and magnitude-time diagram (b) The red solid line in (a) is the normal distribution curve, the color mark in (b) represents the stress drop value, and the red represents the high stress drop. |
长岛震群的地震活动自2017年2月14日开始后,频度逐渐上升,在最大地震(3月3日ML4.5)发生后的一个月,地震活动最为密集,频度也达到最高值(图 6b).震群主要分为两个活跃时段,3—5月为第一活跃时段,6月为第二活跃时段,在震群发展过程中同等大小的事件往往显示出大体相当的应力降,仅有部分小震级高应力降的事件,其中在第二活跃时段更为明显.除此之外,我们并没有观察到应力降随时间演化的明显规律(图 6b).
在分析应力降的空间变化时,震群事件的精确定位是至关重要的.我们利用基于波形互相关的双差定位法对震群进行了重新定位.由于6月初长岛台(CHD)搬迁等原因,为保证结果的可靠性,我们仅定位了2017年2月至5月的地震事件.将第一活跃时段(2—5月)事件的应力降投影到震群的分布图上,可以看到震群总体呈NWW向分布,多数地震集中于震群中部,高于1 MPa的高应力降事件主要位于震群的西北端和震群中部靠近蓬莱—威海断裂的部分(图 7a),从应力降等值线图上可以看到应力降高值的分布区域也与之相符(图 7b).

|
图 7 应力降的空间分布(a)和等值线图(b) 图中红色线为最近的蓬莱—威海断裂,震群主要位于断裂的南边,色标代表应力降的高低,红色代表高应力降. Fig. 7 The spatial distribution (a) and contour map (b) of stress drop value The red line is the nearest Penglai-Weihai fault. The earthquake swarm is mainly located in the south of the fault. The color mark represents stress drop value and the red represents the high stress drop. |
广义叠加反演方法的关键性优势在于:利用一种经验性的、完全非参数化的框架将震源项从观测谱中分离出来,而不需要去评估仪器响应或传播路径上的衰减效应(Shearer et al., 2017).由于小震事件很难估计辐射模式,通常在中小地震震源参数研究中也不会讨论震源辐射效应的影响.但是在该方法中,观测谱的叠加可以使辐射效应趋于平均,弱化震源辐射效应的影响.该方法可以从观测谱中分离出震源项、台站项和路径项(图 3),并且通过EGF校正可以进一步校正共同路径效应(如:近源衰减、场地和仪器响应).
该方法的另一个优势是:不需要事先假设自相似的恒定应力降模型,而是利用更为一般化的应力降模型(式(9))拟合得到最佳应力降(Trugman and Shearer, 2017).根据拟合残差判断自相似模型(ε1=0)和非自相似模型(ε1>0)哪个更合适研究区域,使得到的结果和分析更加客观.在长岛震群的实际应用中,可以发现非自相似模型(ε1>0)的拟合效果明显要优于自相似模型(ε1=0)(图 5b,5c).也有很多学者通过改变高频衰减系数或在震源谱中引入截止频率,使震源参数的估计更加准确(Kumar et al., 2013; 郑建常等, 2016; Vandana et al., 2017),但这使模型更加复杂的同时也引入了参数的不确定性.
为检验结果的可靠性,我们利用另外两种不同方法分别计算了长岛震群21次ML≥2.5地震的应力降.这两种方法分别是基于Brune模型的多台站联合反演方法(Zhu and Chen, 2012)和基于高频截止模型(增加了截止频率的Brune模型)的多台站联合反演方法(郑建常等, 2016).这三种方法都是基于Brune模型,S波的速度都设定为恒定值3.5 km·s-1.图 8展示了三种方法的结果对比,可以看到三种方法得到的大部分地震的应力降值接近,仅有个别地震的差值超过了1 MPa.其中基于Brune模型的联合反演方法和广义叠加反演方法得到的结果更为接近,而基于高频截止模型的联合反演方法与另外两种方法差异较大,尤其是0.5 MPa以上和0.2 MPa以内的地震事件,可能与高频截止模型和经典Brune模型的差异有关.通过对比,表明广义叠加反演方法与其他针对少量地震的反演方法得到的结果基本一致,但该方法的计算效率更高,更适合大量地震的反演计算.

|
图 8 不同方法得到的应力降结果对比 横轴代表广义叠加反演方法得到的21次地震应力降值,左侧蓝色纵坐标代表基于Brune模型的多台联合反演方法得到的应力降值,右侧纵坐标代表基于高频截止模型的多台联合反演方法得到的应力降值.其中蓝色方块表示本文方法和基于Brune模型的对比,黑色圆表示本文方法和基于高频截止模型(High-cut)的对比结果,红色线表示1:1的比例关系. Fig. 8 Comparison of stress drop results obtained by different methods The horizontal ordinate represents 21 seismic stress drop values obtained by generalized superposition inversion method, the left blue ordinate indicates the stress drop values obtained by multiple joint inversion methods based on Brune model, and the right ordinate indicates the stress drop values obtained by multiple joint inversion methods based on high frequency cut-off model. The blue squares are the comparison between the method and Brune model, the black circles are the comparison between the method and the high-cut model, and the red line represents the ratio of 1:1. |
尽管该方法在计算大规模地震事件时存在一定的优势.但该方法要求要计算的事件集有较为合理的震级分布,尽可能多的覆盖不同的震级.因为震源项的叠加需要在相对较小的尺度上(几十公里)对不同震级的事件进行叠加(Shearer et al., 2006),例如长岛震群这种小尺度且震级分布较广(ML1.0~4.5)的震群事件.但是如果所有事件都大小相当或研究少量事件时,该方法可能达不到预期效果.如果要将该方法应用到大范围的区域,则需要提取多个EGF进行校正.可以在每个相同构造区提取一个EGF进行校正,以排除不同区域衰减系数不同造成的差异.或者按照最邻近事件距离的方法,每个地震选取邻近200~500个地震进行EGF的提取和校正(Shearer et al., 2006; Yang et al., 2009).
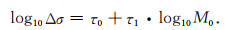
4.2 长岛震群应力降的非自相似性图 8是长岛震群的拐角频率、应力降与地震矩之间的尺度关系.可以看到拐角频率、应力降随地震矩的变化特征与自相似性存在一定的偏差,拐角频率随地震矩的增大而减小(图 9a),而应力降随地震矩的增大而增大(图 9b).为了更精确地量化这一趋势,以0.4(log10M0)为间隔分组,将长岛震群的地震事件共分为9组,计算每组内的拐角频率或应力降的中值,然后利用事件数加权的稳健回归函数以如下线性形式来确定最佳拟合参数τ0和τ1.

|
图 9 拐角频率(a)、应力降(b)与地震矩的尺度关系 黑点代表每个地震事件的震源参数,以0.4(log10M0)为间隔分组,将地震事件分为9个组,计算每组内地震事件的拐角频率或应力降的中值,蓝色实线为利用稳健回归方法拟合的直线,右上角标注的是拟合直线斜率和误差. Fig. 9 Scale relationship between corner frequency (a), stress drop (b) and seismic moment Black dots indicate source parameters of each earthquake event. Seismic events are grouped into nine groups at intervals of 0.4 (log10M0). The median corner frequency and stress drop of each group are calculated. The blue solid line is a fitted line by robust regression method. The slope and error of fitted straight line are marked in the upper right corner. |
|
(10) |
结果显示,应力降与地震矩的拟合参数τ1=0.21(±0.03),τ1>0,表明长岛震群的应力降和地震矩成正相关,从图 9b中也能发现这种趋势.由2.2节中图 5可见,非自相似性模型更适合长岛震群应力降的计算,由式(9)可知应力降与低频幅值成线性关系.由于地震矩与低频幅值成正比(Kanamori and Rivera, 2004),也可推导出应力降与地震矩成线性关系,可见按震级分档的应力降拟合结果与单一事件应力降的计算结果在趋势上也是一致的.同理,拐角频率与地震矩的拟合参数τ1=-0.25(±0.02),拐角频率和地震矩成负相关,也与变化趋势一致.
同时2.2节中提到的利用基于参数估计的渐进正态分布方法得到拐角频率fc的拟合误差,并将这种残差代入公式(8)得到应力降的误差.从拐角频率和应力降的误差统计来看(图 10),大多数事件的拐角频率误差集中在0.5~1.5 Hz之间,这些误差对于图 9a中地震矩和拐角频率的关系影响很小;而应力降的误差主要集中在0.05~0.4 MPa之间,其中大于100个地震事件数的误差在0.2 MPa以内,因此对应力降与地震矩整体正相关的变化趋势并不会造成影响.

|
图 10 拐角频率和应力降误差统计 横坐标表示拐角频率(a)和应力降(b)的误差,纵坐标表示地震事件的个数. Fig. 10 Error statistics of corner frequency and stress drop The horizontal ordinate represents the error of corner frequency (a) and stress drop (b), and the ordinate represents the number of earthquake events. |
由于长岛震群的应力降与地震矩成正相关(图 9b),震级高的事件应力降值往往较大.为了排除震级的影响,考察震源区应力降的相对变化,我们有必要对应力降进行震级校正,首先将图 9b中拟合直线按经验关系换算成应力降与震级的关系(Kanamori and Rivera, 2004),其中拟合直线为相应震级的正常应力降水平,高于该值的为正值,反之为负值.图 11是震级校正后的应力降差值经网格插值平滑后的分布图,可以看到应力降相对变化为正的区域主要集中在震群的端部,尤其是西北端,同时断裂附近也出现了高正值区域.而地震相对密集的震群中部(图 7),应力降变化为负值,且幅度较小.这种高应力降变化的区域位于震群的端部或断裂附近的现象,与在高滑移区域应力降低,而在断层尖端附近应力增加的认识是一致的(Goebel et al., 2015).从震群事件到断裂的距离和应力降中值的关系来看,除了距离断层较近位置的个别点(0.1 km、0.4 km)应力降中值较大之外,其他位置的应力降中值基本保持不变,并没有明显的变化趋势(图 12a).我们进一步考察了应力降中值随深度的变化(图 12b),可以看到长岛震群的震源深度主要集中在8~12 km,其中在9、10 km处的应力降中值略高于其他深度,差值在0.1 MPa左右.这种震源深度上的变化也会对应力降空间变化产生一定的影响.由于所研究的长岛震群分布在10 km×5 km的小范围内,因此可以断定这种空间上的不均匀分布应该是由于震源特性的差异,而不是衰减系数空间变化的结果(Trugman and Shearer, 2017).

|
图 11 经震级校正后的应力降差值的空间分布图 色标代表应力降差值的大小,白色代表正常应力降水平(图 9b中拟合蓝线),红色代表高于正常水平的值,红色实线代表蓬莱—威海断裂. Fig. 11 The spatial distribution of stress drop difference value through magnitude correction The color mark represents the stress drop difference values by magnitude correction, the white represents the normal stress drop level (fitted blue line in Fig. 9b), the red represents the value higher than the normal level, and the red solid line represents the Penglai-Weihai fault. |

|
图 12 应力降与震群事件到已知断层的距离(a)、震源深度(b)的关系,已知断层为图 10中的蓬莱—威海断裂 图中黑点表示每个地震事件的应力降值,蓝色方块为距离0.1 km (a)、深度1 km (b)范围内地震事件的应力降中值. Fig. 12 The relationship between the stress drop and the distance from the swarm event to the known fault (a) and the focal depth (b). The known fault is the Penglai-Weihai fault in Fig. 10 The black dots represent the stress drop of each earthquake. The blue squares are the median stress drop of the earthquake event in the range of 0.1 km (a) and 1 km (b) of the depth. |
长岛震群应力降的范围是0.009~3.04 MPa,中值为0.3 MPa.中国大陆的中小地震主要集中在南北地震带、天山地震带、华北和华南地区,多为构造地震,在对这些中小地震震源参数的研究中发现,应力降在0.1~20 MPa之间,中值大于1 MPa(赵翠萍等,2011).与之相比,长岛震群具有更低的应力降值.同时中国大陆中小地震的震源深度变化也很大,因此并不能将这种应力降的差距完全归因于震源深度的不同所致,这或许表明这些事件的成核或破裂过程有所不同.
同时长岛震群应力降偏离了自相似性理论,与地震矩成正相关,随地震矩的增大而增大(图 9b).其他一些对震群或序列震源参数的研究中也发现了这种非相似性(Duputel et al., 2013; Lengliné et al., 2014; Lin et al., 2016; Agurto-Detzel et al., 2017).其中在与流体相关的震群应力降的研究中发现,流体的注入会极大地改变应力降,使得在很小范围内地震的应力降可以差数十倍(华卫等,2010;Agurto-Detzel et al., 2017;Wu et al., 2018).
采油井或水库注水诱发地震的研究中,地震事件的震源深度往往位于较浅的沉积层(华卫等, 2010; Sumy et al., 2017),废水处理诱发的地震最深则可以到达花岗岩基底(Kroll et al., 2013; Agurto-Detzel et al., 2017).而长岛震群地震事件主要位于11 km左右,研究区位于渤海油田的东侧(信延芳等, 2015;林年添等,2018),蓬莱—张北—集宁玄武岩带的东端,是新生代火山活动较为频繁的地区(杜国云, 1995;Xia et al., 2016;Li et al., 2017),这样的构造条件有利于深部流体活动.
长岛震群的应力降值很低,而且空间变化差异大,这与前人发现的流体活动区内震群应力降的特征类似(Agurto-Detzel et al., 2017; Wu et al., 2018).结合区域构造条件,我们推测长岛震群这种低应力的状态可能与流体活动有关,地下流体在长岛震群的活动中起到一定的作用.当然,仅靠低应力降或非相似性这些依据并不足以区分诱发事件和构造事件(Clerc et al., 2016).更多研究(比如小地震时空迁移、孔隙压力变化、速度结构反演、波速变化等)将有助于我们认识震群的发生机理,这也是我们今后研究的重点.
5 结论本文采用广义叠加反演方法估算应力降,通过分阶段叠加从观测谱中分离出震源项,并利用分震级叠加均值谱与理论谱的拟合得到经验格林函数(EGF),进一步校正震源项,得到真实震源谱.该方法最大优势在于不需要知道台站的仪器响应、场地响应和传播路径上的衰减效应,而且并不需要事先假定自相似的恒定应力降模型.在长岛震群的实际应用中,发现非自相似模型能得到更好的拟合效果.该方法计算效率高,既可以对小尺度且震级分布较为合理的大量地震进行研究,又可以对大范围大规模的地震进行快速计算.
利用该方法反演了长岛震群1431个地震的应力降,研究发现:
(1) 应力降变化范围很大(0.009~3.04 MPa),超过了2个量级.中值为0.3 MPa,与全球和中国大陆中小地震相比,应力降明显较低.应力降和拐角频率与地震矩(震级)的相关性较好,其中应力降随地震矩增大而增大,偏离了自相似理论.
(2) 应力降的空间分布不均匀,差异较大.高应力降事件主要集中在震群的端部(NW端)和靠近断层的部分.但应力降中值与到断层距离的依赖性不强,仅在个别位置偏高.长岛震群主要集中在8~12 km,其中在9、10 km处的应力降中值略高于其他深度.应力降随时间的演化规律并不明显.
(3) 长岛震群与流体入侵的震群特征相似,结合区域构造条件,推测地下流体在长岛震群的活动中起到一定的作用.但仅凭应力降的特征并不足以确定是否与流体入侵有关,还需结合其他依据做详细的论证.
致谢 感谢两位审稿专家提出的宝贵意见和建议!文中数据由山东省地震台网中心提供,图件是由GMT和MATLAB软件绘制,在此表示感谢.
Abercrombie R E. 1995. Earthquake source scaling relationships from -1 to 5 ML using seismograms recorded at 2.5-km depth. Journal of Geophysics Research:Solid Earth, 100(B12): 24015-24036. DOI:10.1029/95JB02397 |
Abercrombie R E. 2013. Comparison of direct and coda wave stress drop measurements for the Wells, Nevada, earthquake sequence. Journal of Geophysical Research:Solid Earth, 118(4): 1458-1470. DOI:10.1029/2012JB009638 |
Abercrombie R E, Bannister S, Ristau J, et al. 2017. Variability of earthquake stress drop in a subduction setting, the Hikurangi Margin, New Zealand. Geophysical Journal International, 208(1): 306-320. DOI:10.1093/gji/ggw393 |
Agurto-Detzel H, Bianchi M, Prieto G A, et al. 2017. Earthquake source properties of a shallow induced seismic sequence in SE Brazil. Journal of Geophysics Research:Solid Earth, 122(4): 2784-2797. DOI:10.1002/2016JB013623 |
Aki K. 1967. Scaling law of seismic spectrum. Journal of Geophysical Research, 72(4): 1217-1231. DOI:10.1029/JZ072i004p01217 |
Allmann B P, Shearer P M. 2009. Global variations of stress drop for moderate to large earthquakes. Journal of Geophysics Research:Solid Earth, 114(B1): B01310. DOI:10.1029/2008JB005821 |
Atkinson G M, Mereu R F. 1992. The shape of ground motion attenuation curves in southeastern Canada. Bulletin of the Seismological Society of America, 82(5): 2014-2031. |
Baltay A S, Hanks T C, Abrahamson N A. 2017. Uncertainty, variability, and earthquake physics in ground-motion prediction equations. Bulletin of the Seismological Society of America, 107(4): 1-19. |
Baltay A, Ide S, Prieto G, et al. 2011. Variability in earthquake stress drop and apparent stress. Geophysical Research Letters, 38(6): L06303. DOI:10.1029/2011GL046698 |
Boatwright J, Fletcher J B, Fumal T E. 1991. A general inversion scheme for source, site, and propagation characteristics using multiply recorded sets of moderate-sized earthquakes. Bulletin of the Seismological Society of America, 81(5): 1754-1782. |
Brune J N. 1970. Tectonic stress and the spectra of seismic shear waves from earthquakes. Journal of Geophysics Research, 75(26): 4997-5009. DOI:10.1029/JB075i026p04997 |
Chen X Z, Li Y E. 2007. Temporal changes in apparent stresses of small earthquakes around the epicentral area prier to the July 4, 2006 Wenan, Hebei earthquake (MS=5.1). Earthquake Research in China (in Chinese), 23(4): 327-336. |
Choy G L, Boatwright J L. 1995. Global patterns of radiated seismic energy and apparent stress. Journal of Geophysics Research:Solid Earth, 100(B9): 18205-18228. DOI:10.1029/95JB01969 |
Clerc F, Harrington R M, Liu Y J, et al. 2016. Stress drop estimates and hypocenter relocations of induced seismicity near Crooked Lake, Alberta. Geophysical Research Letters, 43(13): 6942-6951. DOI:10.1002/2016GL069800 |
Cocco M, Tinti E, Cirella A. 2016. On the scale dependence of earthquake stress drop. Journal of Seismology, 20(4): 1151-1170. DOI:10.1007/s10950-016-9594-4 |
Cramer C H. 2017. Brune stress parameter estimates for the 2016 MW5.8 pawnee and other oklahoma earthquakes. Seismological Research Letters, 88(4): 1005-1016. DOI:10.1785/0220160224 |
Denolle M A, Shearer P M. 2016. New perspectives on self-similarity for shallow thrust earthquakes. Journal of Geophysics Research:Solid Earth, 121(9): 6533-6565. DOI:10.1002/2016JB013105 |
Du G Y. 1995. Geologi characters on Weihai-Penglai faults and regional division of neotectonics in Jiaodong. Yantai Teachers University Journal (Natural Science) (in Chinese), 11(2): 60-64. |
Duputel Z, Tsai V C, Rivera L, et al. 2013. Using centroid time-delays to characterize source durations and identify earthquakes with unique characteristics. Earth and Planetary Science Letters, 374: 92-100. DOI:10.1016/j.epsl.2013.05.024 |
Fischer T, Hainzl S. 2017. Effective stress drop of earthquake clusters. Bulletin of the Seismological Society of America, 107(5): 2247-2257. DOI:10.1785/0120170035 |
Goebel T H W, Hauksson E, Shearer P M, et al. 2015. Stress-drop heterogeneity within tectonically complex regions:a case study of San Gorgonio Pass, southern California. Geophysical Journal International, 202(1): 514-528. DOI:10.1093/gji/ggv160 |
Hough S E. 1997. Empirical Green's function analysis:Taking the next step. Journal of Geophysical Research:Solid Earth, 102(B3): 5369-5384. DOI:10.1029/96JB03488 |
Hua W, Chen Z L, Zheng S H. 2009. A study on segmentation characteristics of aftershock source parameters of Wenchuan M8.0 earthquake in 2008. Chinese Journal of Geophysics (in Chinese), 52(2): 365-371. |
Hua W, Chen Z L, Zheng S H, et al. 2010. A study on characteristics of source parameters in Three Gorges Reservoir area. Seismology and Geology (in Chinese), 32(4): 533-542. |
Huang Y H, Beroza G C, Ellsworth W L. 2016. Stress drop estimates of potentially induced earthquakes in the Guy-Greenbrier sequence. Journal of Geophysics Research:Solid Earth, 121(9): 6597-6607. DOI:10.1002/2016JB013067 |
Huang Y H, Ellsworth W L, Beroza G C. 2017. Stress drops of induced and tectonic earthquakes in the central United States are indistinguishable. Science Advances, 3(8): e1700772. |
Ide S, Beroza G C. 2001. Does apparent stress vary with earthquake size?. Geophysical Research Letters, 28(17): 3349-3352. DOI:10.1029/2001GL013106 |
Izutani Y, Kanamori H. 2001. Scale-dependence of seismic energy-to-moment ratio for strike-slip earthquakes in Japan. Geophysical Research Letters, 28(20): 4007-4010. DOI:10.1029/2001GL013402 |
Kanamori H, Rivera L. 2004. Static and dynamic scaling relations for earthquakes and their implications for rupture speed and stress drop. Bulletin of the Seismological Society of America, 94(1): 314-319. DOI:10.1785/0120030159 |
Kroll K A, Cochran E S, Richards-Dinger K B, et al. 2013. Aftershocks of the 2010 MW7.2 El Mayor-Cucapah earthquake reveal complex faulting in the Yuha Desert, California. Journal of Geophysical Research:Solid Earth, 118(12): 6146-6164. DOI:10.1002/2013JB010529 |
Kumar A, Kumar A, Gupta S C, et al. 2013. Seismicity and source parameters of local earthquakes in Bilaspur region of Himachal Lesser Himalaya. Arabian Journal of Geosciences, 7(6): 2257-2267. |
Lengliné O, Lamourette L, Vivin L, et al. 2014. Fluid-induced earthquakes with variable stress drop. Journal of Geophysical Research:Solid Earth, 119(12): 8900-8913. DOI:10.1002/2014JB011282 |
Li J, Jin A W, Hou G T. 2017. Timing and implications for the late Mesozoic geodynamic settings of eastern North China Craton:Evidences from K-Ar dating age and sedimentary-structural characteristics records of Lingshan Island, Shandong Province. Journal of Earth System Science, 126(8): 117. DOI:10.1007/s12040-017-0901-4 |
Lin N T, Zhang D, Zhang K, et al. 2018. Predicting distribution of hydrocarbon reservoirs with seismic data based on learning of the small-sample convolution neural network. Chinese Journal of Geophysics (in Chinese), 61(10): 4110-4125. DOI:10.6038/cjg2018J0775 |
Lin Y Y, Ma K F, Kanamori H, et al. 2016. Evidence for non-self-similarity of microearthquakes recorded at a Taiwan borehole seismometer array. Geophysical Journal International, 206(2): 757-773. DOI:10.1093/gji/ggw172 |
Liu J, Zheng S H, Huang Y L. 2003. The inversion of non-elasticity coefficient, source parameters, site response using genetic algorithms. Acta Seismologica Sinica (in Chinese), 25(2): 211-218. |
Mayeda K, Walter W R. 1996. Moment, energy, stress drop, and source spectra of western United States earthquakes from regional coda envelopes. Journal of Geophysics Research:Solid Earth, 101(B5): 11195-11208. DOI:10.1029/96JB00112 |
Mori J, Abercrombie R E, Kanamori H. 2003. Stress drops and radiated energies of aftershocks of the 1994 Northridge, California, earthquake. Journal of Geophysical Research:Solid Earth, 108(B11): 2545. DOI:10.1029/2001JB000474 |
Moya A, Aguirre J, Irikura K. 2000. Inversion of source parameters and site effects from strong ground motion records using genetic algorithms. Bulletin of the Seismological Society of America, 90(4): 977-992. DOI:10.1785/0119990007 |
Mueller C S. 1985. Source pulse enhancement by deconvolution of an empirical Green's function. Geophysical Research Letters, 12(1): 33-36. DOI:10.1029/GL012i001p00033 |
Prieto G A, Shearer P M, Vernon F L, et al. 2004. Earthquake source scaling and self-similarity estimation from stacking P and S spectra. Journal of Geophysical Research:Solid Earth, 109(B8): B08310. DOI:10.1029/2004JB003084 |
Prieto G A, Parker R L, Vernon F L, et al. 2006. Uncertainties in earthquake source spectrum estimation using empirical Green functions.//Abercrombie R, McGarr A, Di Toro G, et al. eds. Earthquakes: Radiated Energy and the Physics of Faulting. Washington DC: American Geophysical Union Geophysical Monograph Series, 69-74. https://www.researchgate.net/publication/241782976_Uncertainties_in_Earthquake_Source_Spectrum_Estimation_Using_Empirical_Green_Functions
|
Ross Z E, Ben-Zion Y. 2016. Toward reliable automated estimates of earthquake source properties from body wave spectra. Journal of Geophysics Research:Solid Earth, 121(6): 4390-4407. DOI:10.1002/2016JB013003 |
Shearer P M, Prieto G A, Hauksson E. 2006. Comprehensive analysis of earthquake source spectra in southern California. Journal of Geophysical Research:Solid Earth, 111(B6): B06303. DOI:10.1029/2005JB003979 |
Sumy D F, Neighbors C J, Cochran E S, et al. 2017. Low stress drops observed for aftershocks of the 2011 MW5.7 Prague, Oklahoma, earthquake. Journal of Geophysics Research:Solid Earth, 122(5): 3813-3834. DOI:10.1002/2016JB013153 |
Trugman D T, Shearer P M. 2017. Application of an improved spectral decomposition method to examine earthquake source scaling in Southern California. Journal of Geophysics Research:Solid Earth, 122(4): 2890-2910. DOI:10.1002/2017JB013971 |
Trugman D T, Dougherty S L, Cochran E S, et al. 2017. Source spectral properties of small to moderate earthquakes in southern Kansas. Journal of Geophysics Research:Solid Earth, 122(10): 8021-8034. DOI:10.1002/2017JB014649 |
Vandana, Kumar A, Gupta S C, et al. 2017. Source parameters and high frequency characteristics of local events (0.5 ≤ ML ≤ 2.9) around bilaspur region of the himachal Himalaya. Pure and Applied Geophysics, 174(4): 1643-1658. DOI:10.1007/s00024-017-1493-2 |
Wang D Y, Huang J P, Kong X, et al. 2017. Improving the resolution of seismic traces based on the secondary time-frequency spectrum. Applied Geophysics, 14(2): 236-246. DOI:10.1007/s11770-017-0616-y |
Warren L M, Shearer P M. 2002. Mapping lateral variations in upper mantle attenuation by stacking P and PP spectra. Journal of Geophysical Research:Solid Earth, 107(B12): ESE 6-1-ESE 6-11. DOI:10.1029/2001JB001195 |
Wu Q M, Chapman M, Chen X W. 2018. Stress-drop variations of induced earthquakes in Oklahoma. Bulletin of the Seismological Society of America, 108(3A): 1107-1123. DOI:10.1785/0120170335 |
Xia Z M, Liu J L, Ni J L, et al. 2016. Structure, evolution and regional tectonic implications of the Queshan metamorphic core complex in eastern Jiaodong Peninsula of China. Science China Earth Sciences, 59(5): 997-1013. DOI:10.1007/s11430-015-5259-3 |
Xin Y F, Guo X W, Wen Z H, et al. 2015. Cenozoic shallow tectonic migration and the deep dynamic mechanism in the Bohai Sea. Progress in Geophysics (in Chinese), 30(4): 1535-1543. DOI:10.6038/pg20150407 |
Yang W Z, Peng Z G, Ben-Zion Y. 2009. Variations of strain-drops of aftershocks of the 1999 İzmit and Düzce earthquakes around the Karadere-Düzce branch of the North Anatolian Fault. Geophysical Journal International, 177(1): 235-246. DOI:10.1111/j.1365-246X.2009.04108.x |
Zhao C P, Chen Z L, Hua W, et al. 2011. Study on source parameters of small to moderate earthquakes in the main seismic active regions, China mainland. Chinese Journal of Geophysics (in Chinese), 54(6): 1478-1489. DOI:10.3969/j.issn.0001-5733.2011.06.007 |
Zheng J C, Wang P, Xu C P, et al. 2016. Robust inversion of seismic-source spectral parameters for the 2013-2015 Rushan swarm. Chinese Journal of Geophysics (in Chinese), 59(11): 4100-4112. DOI:10.6038/cjg20161114 |
Zheng J C, Xu C P, Li D M, et al. 2018. Recent change of stress field in North China derived from station composite focal mechanisms. Recent Developments in World Seismology (in Chinese), (4): 48-57. |
Zhou S Y, Xu Z H, Chen X F. 2001. Analysis on the source characteristics of the 1997 Jiashi swarm, western China. Chinese Journal of Geophysics (in Chinese), 44(5): 654-662. |
Zhu X Y, Chen Y T. 2012. An Inversion of Lg-wave attenuation and site response in the North China region. Bulletin of the Seismological Society of America, 102(6): 2600-2610. DOI:10.1785/0120110294 |
陈学忠, 李艳娥. 2007. 2006年7月4日河北文安MS5.1地震前震中周围地区小震视应力随时间的变化. 中国地震, 23(4): 327-336. DOI:10.3969/j.issn.1001-4683.2007.04.001 |
杜国云. 1995. 威海-蓬莱断裂带地质特征与胶东新构造运动区划. 烟台师范学院学报(自然科学版), 11(2): 60-64. |
华卫, 陈章立, 郑斯华. 2009. 2008年汶川8.0级地震序列震源参数分段特征的研究. 地球物理学报, 52(2): 365-371. |
华卫, 陈章立, 郑斯华, 等. 2010. 三峡水库地区震源参数特征研究. 地震地质, 32(4): 533-542. DOI:10.3969/j.issn.0253-4967.2010.04.001 |
林年添, 张栋, 张凯, 等. 2018. 地震油气储层的小样本卷积神经网络学习与预测. 地球物理学报, 61(10): 4110-4125. DOI:10.6038/cjg2018J0775 |
刘杰, 郑斯华, 黄玉龙. 2003. 利用遗传算法反演非弹性衰减系数、震源参数和场地响应. 地震学报, 25(2): 211-218. DOI:10.3321/j.issn:0253-3782.2003.02.012 |
信延芳, 郭兴伟, 温珍河, 等. 2015. 渤海新生代盆地浅部构造迁移特征及其深部动力学机制探讨. 地球物理学进展, 30(4): 1535-1543. DOI:10.6038/pg20150407 |
赵翠萍, 陈章立, 华卫, 等. 2011. 中国大陆主要地震活动区中小地震震源参数研究. 地球物理学报, 54(6): 1478-1489. DOI:10.3969/j.issn.0001-5733.2011.06.007 |
郑建常, 王鹏, 徐长朋, 等. 2016. 乳山震群震源谱参数的稳健反演. 地球物理学报, 59(11): 4100-4112. DOI:10.6038/cjg20161114 |
郑建常, 徐长朋, 李冬梅, 等. 2018. 利用台站综合节面解研究华北地区应力场的变化. 国际地震动态, (4): 48-57. DOI:10.3969/j.issn.0253-4975.2018.04.009 |
周仕勇, 许忠淮, 陈晓非. 2001. 伽师强震群震源特征及震源机制力学成因分析. 地球物理学报, 44(5): 654-662. DOI:10.3321/j.issn:0001-5733.2001.05.009 |