关于地震波在地球中的传播问题,从最初研究中对介质的连续均匀、完全弹性和各项同性的基本假设已经逐步发展至多相介质、非均匀性和各向异性.地球内部介质的各向异性与深部温压、应力应变及其矿物结构紧密相关,其观测结果可为大陆变形和深部动力学过程提供重要依据.在20世纪60年代,Hess(1964)在太平洋的Pn速度研究中发现海洋上地幔水平方向上存在0.6 km·s-1的速度差异,最快速度平行于海底扩张方向.夏威夷地区的上地幔地震波各向异性强度高达8%(Morris et al., 1969;Raitt et al., 2015).在大陆的上地幔研究中,通过对面波频散、Pn波速度和XKS分裂等现象的观测成功获取其各向异性特征(Vinnik et al., 1984;Babuska and Cara, 1991;Silver and Chan, 1991;王椿镛等,2007).上地幔的地震各向异性主要来源于上地幔物质在板块构造运动中塑性变形形成的橄榄石晶格优势排列(Nicolas and Christensen, 1987;Savage, 1999).通过对S、ScS和SKS震相的剪切波分裂研究,可获得地震各向异性的快波方向φ与在快慢波延时δt.在中国大陆的上地幔各向异性研究中,郑斯华和高原(1994)利用中国数字地震台网(CDSN)的数据,发现明显的横波分裂现象且其时间延迟在0.7 s和1.7 s之间.Zhao和Zheng(2005)基于宽频带地震台记录的SKS数据获得华北克拉通东部地区NW-SE的快波偏振方向,快慢波的时间延迟范围为0.7~1.94 s.
在各向异性介质中,接收函数Ps转换震相的到时随反方位角有余弦变化特征(Liu and Niu, 2012).利用该变化规律对P波接收函数进行余弦走时校正后使用H-κ扫描叠加技术,可获得更为准确的地壳厚度和介质纵波速度(VP)与横波速度(VS)波速比(Hammond,2014;Kaviani and Rumpker, 2015;Wen et al., 2019).近年来,S波接收函数方法在岩石圈软流圈边界LAB(Lithosphere Asthenosphere Boundary)研究中已成为最主要的技术手段之一(Farra and Vinnik, 2000;Oreshin et al., 2002;Li et al., 2004;Yuan et al., 2006;Kind et al., 2012;Shen et al., 2015;娄辛辉等,2017),LAB形态特征是区域地球动力学研究过程中的重要地震学依据.S波接收函数相比P波接收函数入射角更大,在台站下方射线路径更长(Yuan et al., 2006),当其在各向异性较强的区域中传播时不同反方位角转换震相到时的延迟时间会更加明显.接收函数时深转换是将其转换震相到时归位于地下发生转换的界面深度,所以各向异性引起的不同反方位角到时偏差会直接影响对深度的判断.在存在明显的各向异性特征区域,S波接收函数转换震相的到时延迟引起的对深度成像的影响难以忽略不计.
在本文中,我们阐述各向异性对不同反方位角S波接收函数的影响,试图通过对其走时进行校正,进一步提高时深转换信息的准确性,并选取位于青藏高原东北缘区域内中国科学探测台阵项目二期(中国地震科学台阵,2006)的2个流动台站的实测数据进行各向异性走时校正研究,以检验各向异性对接收函数时深转换的影响和各向异性走时校正的必要性.
1 方法 1.1 接收函数的提取及正演计算接收函数方法,即基于等效震源假定从远震体波分离得到台站下方介质Ps/Sp转换波与直达P/S波的相对到时序列(Langston,1979;Farra and Vinnik, 2000).P波接收函数的主频高于S波接收函数,具有更高的垂向分辨率,但直达S波接收函数的Sp转换波先于多次波到达,不受地壳多次波的干扰,更适合探测具有过渡性的软流圈岩石圈边界(Kennett and Engdahl, 1991).提取接收函数主要有坐标旋转和反褶积两大步骤(Kumar et al., 2006, 2007;Wilson et al., 2006;Yuan et al., 2006).因S直达波入射角较大,我们将原始波形从ZNE(垂向、南北向、东西向)坐标系旋转至ZRT(垂向、径向、切向)坐标系后,再将其旋转至LQT(P方向、SV方向、SH方向)射线坐标系,最后通过反褶积便可获得S波接收函数(Yuan et al., 2006;Kind et al., 2012).本文使用三分量接收函数的多道最大或然性反褶积方法(MMLD)进行S波接收函数分离,该方法通过对台阵多台站Q方向分量的叠加从而有效的压制由横向非均匀引起的散射噪声,进一步获得接近真值的震源因子估计(刘启元等,1996;刘启元和Kind,2004;王峻,2016).
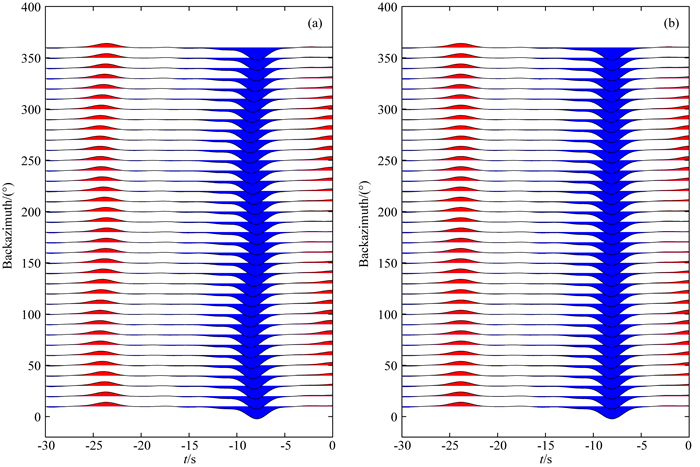
为了研究岩石圈的各向异性,在本文中我们基于广义反射透射系数矩阵方法(Chen,1993)将地壳分层各向异性P波接收函数正演(Levin and Park, 1997;齐少华等,2016)扩展至S波理论接收函数计算.结合研究区域已有的各向异性观测结果(快波方向和延时)合成理论S波接收函数并研究讨论.TI介质为六方对称,也称横向各项同性介质.该介质只有一个对称轴,且垂直于对称轴的平面为各向同性.HTI介质为对称轴水平的TI介质,它表现为介质波速存在水平方向随反方位角的变化特征,称其为方向各向异性.本文主要考虑不同反方位角接收函数的到时差异对时深转换的影响,所以在以下讨论中使用HTI模型来进行地震各向异性计算研究, 图 1a给出仅地壳内部为HTI介质的正演S波接收函数波形,模型的地壳厚度为60 km,地壳各向异性强度为3%.由图 1a中可看出,Sp震相的到时随反方位角有周期为180°的余弦变化规律,在正演过程中,我们使用已有研究(基于SKS横波分裂)获取的台站下方的φ和δt参数,选择其使用的震中距为85°至120°SKS震相的平均慢度(4.75 s/(°))为参考慢度,基于不同反方位角接收函数校正后叠加震相幅值最强为标准,试出台站下方介质的各向异性强度.本文中利用简化的IASP91(参考CRUST 1.0进行地壳厚度修正)作为岩石圈背景速度模型合成理论接收函数.
1.2 接收函数到时的余弦校正Liu和Niu(2012)在接收函数Moho面Ps分裂研究中引入径向分量Ps转换震相到时的余弦校正(Cosine moveout correction),获得了地壳各向异性的快波方向和快慢波延时.该方法利用径向分量中Ps震相随反方位角的周期性变化特征,进一步提高了Ps分裂研究结果的稳定性.为此,我们定义到时校正量为

|
(1) |
其中,φ和δt分别为水平的快波方向和延时,tj和Δtj为第j道接收函数转换震相在各向同性介质中的到时和被校正的时间差,t0为各项同性条件下的转换震相走时.
上文提到,根据式(1)的余弦校正试算出台站下方的各向异性强度(基于校正后不同反方位角叠加转换震相能量最大为基准)后正演理论S波接收函数,同样利用不同反方位角接收函数转换震相(SMp、SLp)叠后能量最大为标准算出单台的两个不同转换震相的延时δt(本文中分两层,即地壳和岩石圈地幔内的转换波延时),通过余弦校正公式便可算出不同反方位角S波接收函数的Moho面和LAB转换震相的延时,也就是单层内(地壳或岩石圈地幔)转换震相的走时校正量.同时,利用正演接收函数所使用的速度模型算出各向同性情况下接收函数SMp和SLp的相对到时,最后结合实际数据及其反方位角信息进行余弦校正并获取最终结果.通过以上方法进行余弦走时校正后可发现S波接收函数(图 1b)转换震相走时完全对齐.这里需要有两点前提条件进行补充,首先SKS的各向异性结果为台站下方地球外核至地表台站位置处的累加效应,本文研究中S波接收函数的射线路径为岩石圈底边界至地表,所以当SKS结果的各向异性影响主要来源为岩石圈介质时余弦校正方法才会合理.其次,由于不同反方位角S波接收函数在岩石圈深度范围内的传播路径跨度较大,所以在各向异性特征相对一致的区域内,我们的校正方法更为适用.
|
图 1 接收函数的正演及其走时校正 (a)校正前;(b)校正后. Fig. 1 Synthetic receiver functions and arrival time correction (a) Before correction; (b) After correction. |
为检验地震各向异性走时校正的必要性和有效性,本文首先正演接收函数波形并进行余弦走时校正.
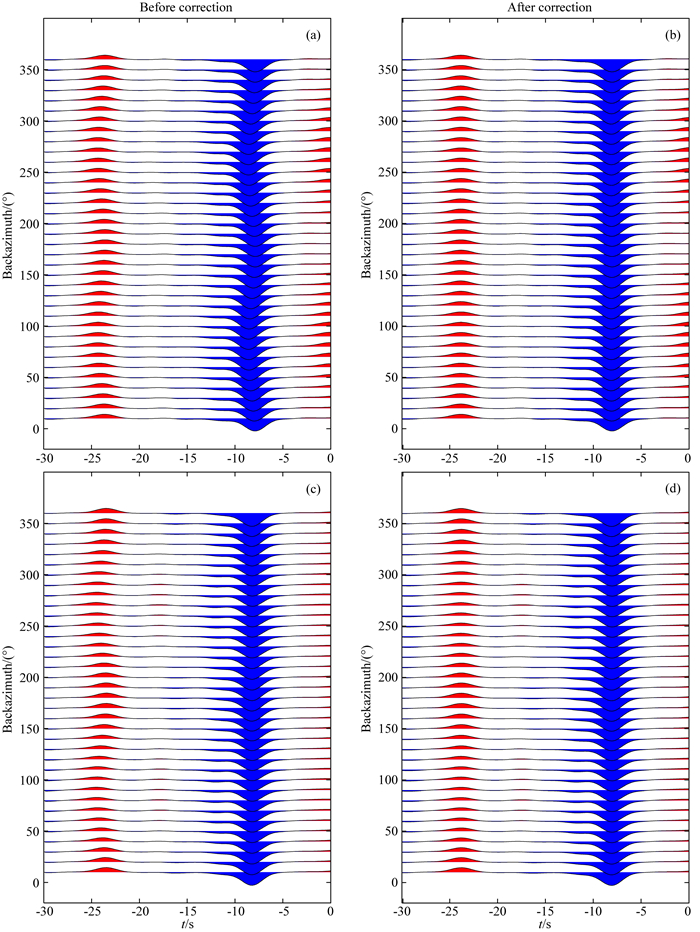
图 2给出基于岩石圈模型M1和M2各向异性正演的S波接收函数,选择12.5 s/(°)作为参考慢度(震中距63°).M1和M2模型参数在表 1中给出,所有模型的Moho深度为60 km,岩石圈地幔的厚度为110 km.M1模型中仅地壳介质内存在各向异性,M2中各向异性介质为岩石圈地幔,分别给定3%的S波各向异性强度.
|
图 2 各向异性模型M1和M2的接收函数正演计算 (a)合成的接收函数,M1;(b)各向异性校正后接收函数,M1;(c)各向异性校正后接收函数,M2;(d)各向异性校正后接收函数,M2. Fig. 2 Synthetic receiver functions computed from anisotropy models M1 and M2 (a) Initial receiver function for M1; (b) Receiver function after correction for M1; (c) Initial receiver function for M2; (d) Receiver functions after correction for M2. |
|
|
表 1 正演接收函数的各向异性模型 Table 1 Anisotropic models for synthetic receiver function |
观察图 2a可知,在M1模型情况下,理论接收函数的Moho面和LAB的转换震相走时随反方位角有相同模式和相同程度的π周期变化规律.在M2模型图 2c中,所有反方位角SMp走时排列整齐,SLp走时变化与反方位角呈余弦函数特征.同时模型M2的接收函数振幅随反方位角存在周期变化(图 2c),因本文主要研究各向异性对走时影响,故能量变化不再赘述.图 2b、d为经过走时校正后的接收函数,可发现M1模型的接收函数的Moho转换震相在时间轴对齐的同时LAB的转换震相走时随反方位角排列保持一致,同样在图 2d中, 经校正处理后的SLp走时差异得到很好的恢复.对比图 2a、c可知,当岩石圈中含有各向异性介质时,反方位角为0°或180°的LAB的转换震相走时最短,这与M1和M2模型中给出的快轴方向为0°保持一致.虽然M1和M2中给定的各向异性强度相同,我们认为造成两种模型下转换震相延时差别的影响主要由于各向异性层厚度和相对的层内走时.
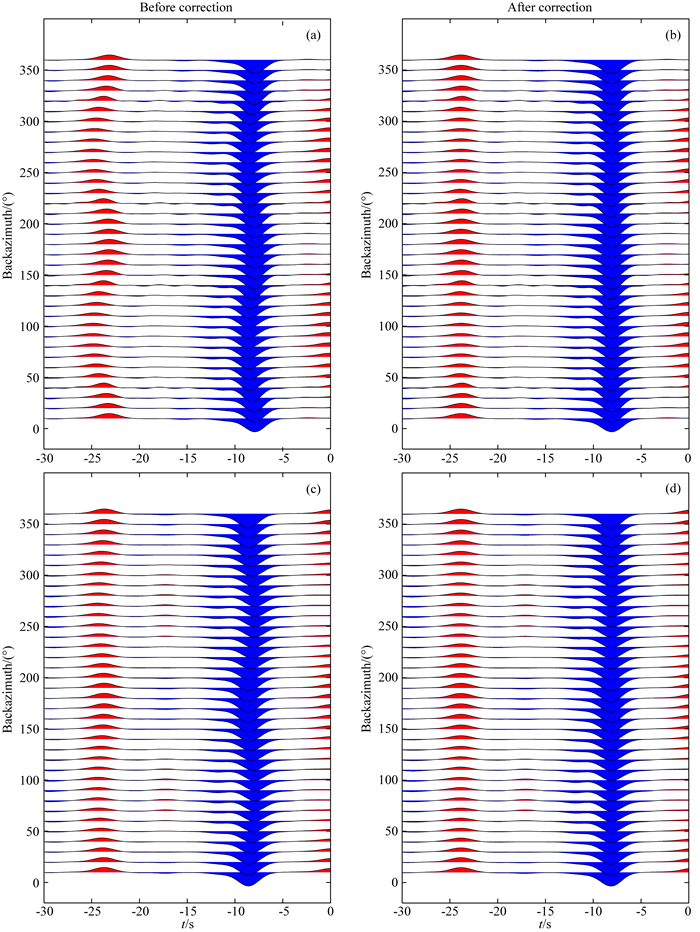
图 3中给出M3、M4(表 1)模型下合成的理论接收函数,这两个模型中地壳内部和岩石圈地幔介质都为各向异性.M3模型中整个岩石圈内各向异性的快轴方向均为0°,壳内各向异性强度为2.5%,Moho面与LAB之间为3%.M4模型中地壳与岩石圈地幔的快轴方向成正交关系分别为90°和0°,各向异性强度同为3%.
|
图 3 各向异性模型M3和M4的接收函数正演计算 (b)合成的接收函数,M3;(b)各向异性校正后接收函数,M3;(c)各向异性校正后接收函数,M4;(d)各向异性校正后接收函数,M4. Fig. 3 Synthetic receiver functions computed from anisotropy models M3 and M4 (a) Initial receiver functions, M3; (b) Receiver functions after correction, M3; (c) Initial receiver functions, M4; (d) Receiver functions after correction, M4. |
观察图 3a可知,在M3模型下正演的接收函数中Moho面与LAB的转换震走时相随反方位角都具有相同的π周期变化特征,LAB转换震相的延时由壳内和岩石圈地幔各向异性介质共同造成,SLp震相延迟时间值明显高于SMp震相.LAB的转换震相沿最快、最慢方向的走时差高达2 s以上,说明岩石圈内各向异性快轴方向一致的情况下对不同反方位角的接收函数进行时深转换时导致的对岩石圈深度判断会有十几千米的偏差,所以在各向异性特征明显区域对接收函数进行走时校正的必要性毋庸置疑.在M4模型下给出的理论接收函数(图 3c)中,SMp震相与SLp震相的走时虽都有以180°为周期的变化规律,但由于地壳与岩石圈地幔具有不同的各向异性快轴方向,SMp震相在90°和270°到时最短而SLp在0°和180°方向走时最快.沿快、慢速方向的LAB转换震相到时也约有1.0 s的差距.图 3b、d给出在模型M3、M4校正后的接收函数,经余弦走时校正后两种模型的Moho面和LAB的转换震相走时对齐效果明显.已知多层各向异性模型参数的情况下,无论不同层内快轴方向或各向异性强度是否相同,经各向异性走时校正后效果显著.
3 实测数据的各向异性走时校正 3.1 数据本文选择中国地震科学探测台阵项目二期(ChinaArrayⅡ)位于青藏高原东北缘的2个流动台站数据进行测试,台站的观测时间为2013—2015年.选取震级大于5.5且震中距为55~85°的地震事件提取S波接收函数.本文使用高斯低通滤波器(α=0.4)对接收函数进行低通滤波以避免旁瓣效应.
青藏高原东北缘作为青藏高原扩张和隆升的前缘,一直受到国内外学者广泛关注.前人在东北缘地区开展的一系列地球物理研究,已获得该区域大量的地震各向异性观测结果(常利军等,2008;Li et al., 2011;Zhang et al., 2012;Wang et al., 2016;Ye et al., 2016;Chang et al., 2017).通过XKS震相和接收函数(Ps震相)研究给出的上地幔、地壳的各向异性方向与地表GPS速度场近平行关系(Zhang et al., 2004;Gan et al., 2007).综合前人结果,可发现青藏高原东北缘区域有显著的各向异性特征,在各向异性强度较大区域,地壳和上地幔延迟时间高达0.4 s和1.6 s.我们根据已有的各向异性研究结果作参考,试图对该区域的数据进行进一步走时校正处理(Chang et al., 2017).
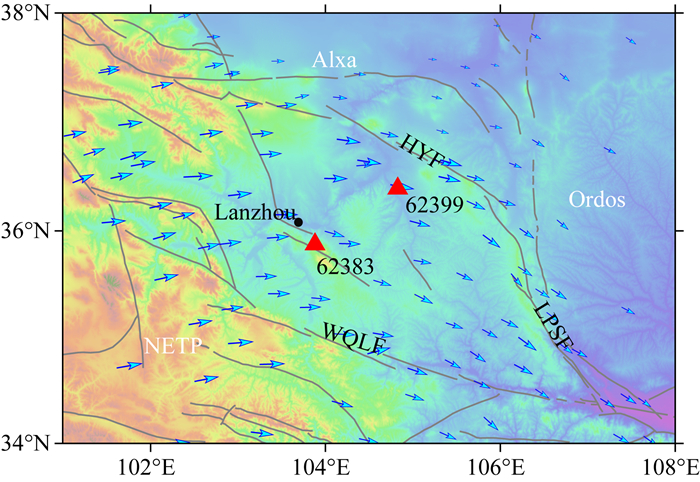
3.2 校正测试我们选择图 4中位于青藏高原东北缘的62383和62399(图 5)两个台站进行校正测试,首先对接收函数动校正处理(Dueker and Sheehan, 1997;Yuan et al., 1997),参考慢度为12.5 s/(°)(震中距63°),使用IASP91(参考CRUST 1.0进行地壳厚度修正)速度模型,台站位置及走时校正使用的各向异性快波方向和延时由表 2给出(Chang et al., 2017).
|
图 4 文中所用台站及分布 图中三角形为本文所用台站,灰色实线为该区域断层分布,蓝色箭头为GPS速度场(Zhang et al., 2004).HYF海原断裂; LPSF六盘山断裂; WQLF西秦岭断裂; Alxa阿拉善块体; Ordos鄂尔多斯块体; NETP青藏高原东北缘. Fig. 4 Shaded map showing distribution of seismic stations in northeastern Tibetan plateau Red triangles represent stations used in this study, gray lines stand for location of faults, blue arrows display GPS velocity vectors. HYF, Haiyuan fault; LPSF, Liupanshan fault; WQLF, Western Qinling fault; NETP, Northeastern Tibetan Plateau. |
|
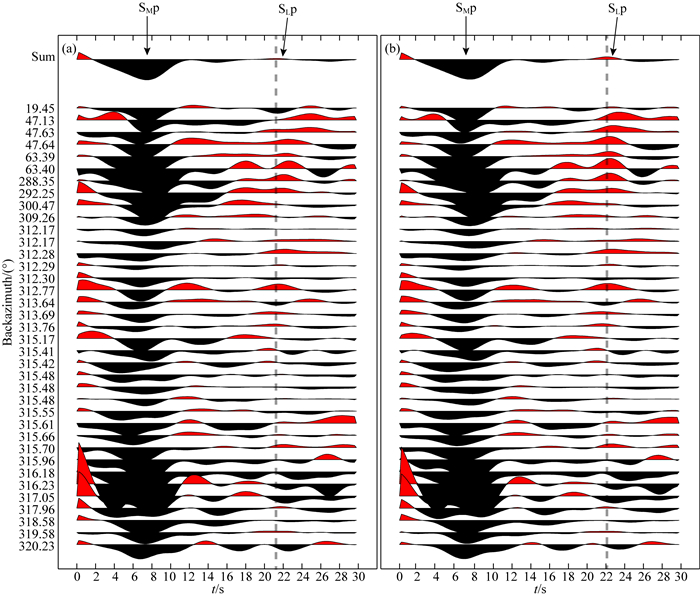
图 5 台站62383的S波接收函数走时校正 (a)校正前;(b)校正后;黑色虚线叠加后的接收函数LAB转换震相走时. Fig. 5 Correction of receiver function arrival time (a) Before correction; (b) After correction. Black dash line stands for arrival time of receiver functions after stacking. |
|
|
表 2 台站的各向异性参数 Table 2 Splitting parameters of two stations |
观察图 5中可知,台站62383的接收函数直接叠加之后,SLp震相几乎不可识别.其接收函数的反方位角分布主要集中在第一和第四象限,表 2中给出台站下方的快波方向为115.4°.由各向异性接收函数正演获得的余弦变化特征的认识可知,反方位角处于第一象限的接收函数的SLp震相走时相对较慢,而位于第四象限则较快.通过比对图 5中校正前后的数据,位于第一象限的接收函数LAB转换震相走时大幅提前,而处于第四象限的数据走时有所滞后.同时我们对接收函数进行曲波变换去噪处理,以便观察转换震相的可追踪性(陈一方等,2019).数据中SLp震相的可追踪性显著增加,将校正后的接收函数进行叠加后发现LAB转换震相能量相比校正前明显加强,同时叠加震相的走时由约21.2 s增加到约22.1 s.
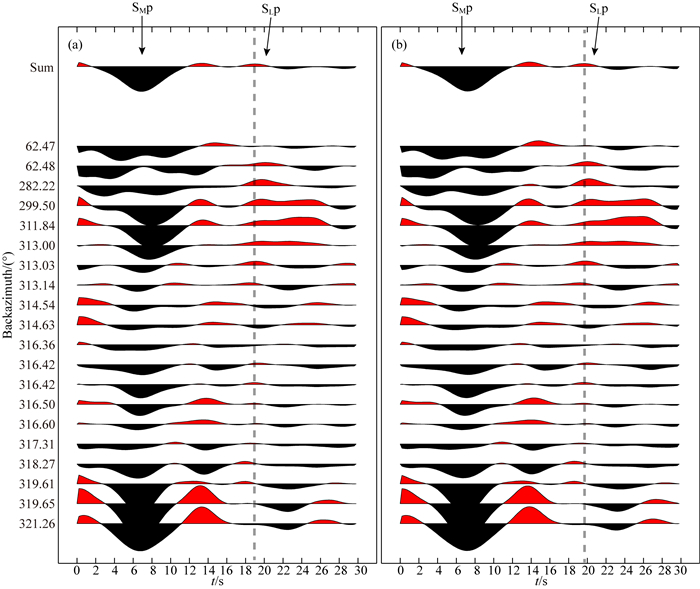
台站62399数据的校正结果在图 6中展示,该台站的快波方向为125.4°,快慢波延时为1.07 s.接收函数的反方位角分布与图 5相似,主要集中于第一与第四象限.校正效果与台站62383保持一致,震相的可追踪性有所加强,校正前后数据叠加的LAB转换震相到时由约18.8 s增加到约19.8 s.
|
图 6 台站62399的S波接收函数走时校正 Fig. 6 Correction of S wave receiver function arrival time for station 62399 |
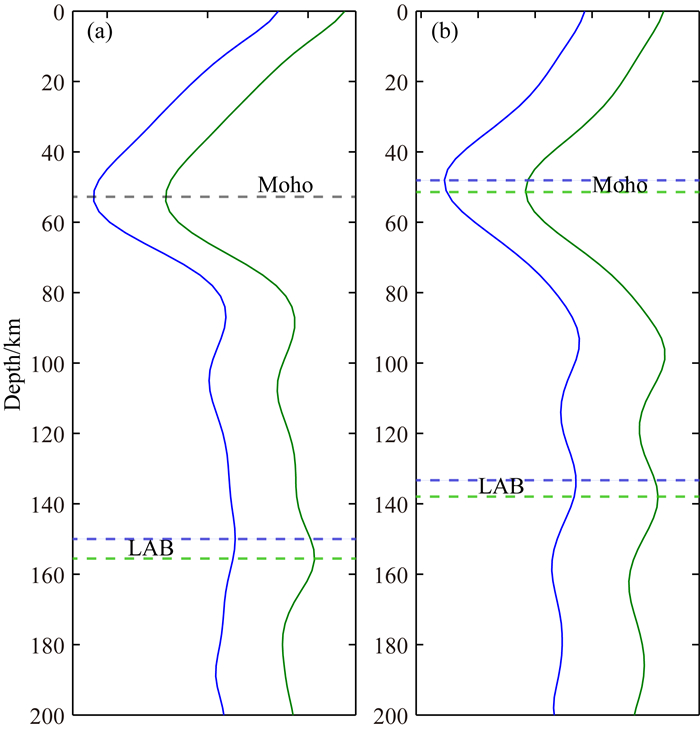
为进一步观察存在较强各向异性对转换界面深度的判断影响,我们将校正前后叠加的接收函数进行时深转换(图 7).由图 7a可知,台站62383在校正前后的地壳厚度无明显变化,均为53 km,LAB深度由149 km增加到156 km,且界面信息强度得到明显增强.经校正后发现台站62399下方的Moho面深度为50 km,相比未校正处理增加2~3 km,岩石圈厚度大致增加6 km至138 km,校正前后对LAB深度判断差别显著.由此可知,进行各向异性走时校正不仅能够加强单台接收函数转换震相的可追踪性,同时对界面深度的估计可以得到较好的改善.
|
图 7 接收函数的时深转换 (a)台站62383;(b)台站62399.蓝色和绿色实线分别为校正前后的结果,虚线代表相应的Moho、LAB转换深度. Fig. 7 Transforming time into depth after receiver function stacking (a) Station 62383; (b) Station 62399. Blue line represents result before correction, green line stands for after correction, dash lines are thicknesses of crust and lithosphere. |
本文通过理论模型测试和实际数据测试,探讨了方位各向异性情况下岩石圈各向异性对S波接收函数成像的影响,并提出了针对岩石圈各向异性效应的余弦校正方法,提高了S波接收函数成像的效果.利用SKS震相分裂研究通常选用震中距范围在85°~120°的地震事件,相应的射线慢度为3.5~6.3 s/(°),提取S波接收函数选取的事件范围是55°~85°,S直达波的水平慢度在10 s/(°)与13.5 s/(°)之间.S波接收函数在各向异性介质中的传播路径更长,受到地震方位各向异性的影响也会更大.在图 7中我们可以注意到单台叠加的接收函数在校正前后LAB转换震相到时差约为0.9 s,深度变化高达6~7 km,而图 5和图 6中沿快慢波方向接收函数转换震相走时差甚至在2 s左右,转换到深度域便会有十几千米的差距.单台叠加后进行深度转换在一定程度上降低了方位各向异性的干扰,而进行接收函数的三维共转换点叠加成像(CCP)时,由各向异性导致的深度计算偏差将对LAB成像结果带来较大影响(Zhu and Kanamori, 2000).所以在各向异性特征显著地区,接收函数的方位各向异性走时校正尤为重要,在已知各向异性参数的情况下,考虑各向异性的影响后对LAB成像更接近地下界面的真实形态,进一步的区域动力学过程研究才更为可靠.
基于各向异性模型正演接收函数波形可知,不同反方位角数据的转换震相走时差异明显,通过对其进行余弦走时校正后发现转换震相的对齐效果显著,证明本文提出的校正方法在理论测试时具有可行性.与此同时,我们选取有较强各向异性的青藏高原东北缘作为研究区域,对位于该地区内两个流动台站62383、62399进行校正测试.需要说明的是,S波接收函数在提取过程中由于地震事件方位分布的局限性和直达S波波形较低的信噪比,致使数据质量相对较差.同时青藏高原东北缘属于构造边界,地下结构复杂,横向非均匀性较强,但是经过校正处理之后接收函数的转换震相可追踪性明显加强,数据叠加后能量明显加强的震相更利于时深转换后对界面深度的识别与判断.考虑各向异性校正后的转换界面深度应该更接近真实情况,且本文给出的地壳和岩石圈厚度与前人观测结果保持一致(Zhang et al., 2012;Ye et al., 2015).
基于Chang等(2017)的SKS快慢波到时差,我们通过正演试算给出台站62383和62399下方介质S波各向异性强度分别为5.1%和4.3%,符合大量存在于上地幔橄榄岩的平均各向异性强度约10%的认识(嵇少丞和Mainprice,1989;金振民等,1994;Jacobsen et al., 2008;杜建国等,2010;朱国臣等,2013).已有观测结果可知研究区域内地壳和岩石圈地幔的各向异性方向几乎平行,且在青藏高原东北缘区域的各向异性特征相似(Li et al., 2011;Zhang et al., 2012;Wang et al., 2016;Ye et al., 2016;Chang et al., 2017;Zhang et al., 2004;Gan et al., 2007),所以在本文中我们给定相同的快波传播方向参数进行校正.同时,Ye等(2016)利用菲涅尔带分析(Fresnel zone analysis)方法推断该区域的各向异性来源于200 km以上,并且主要来自于岩石圈内, 符合上文提到的校正方法的前提条件.在地壳与岩石圈地幔具有不同快轴方向情况下的理论测试表明,接收函数的SMp和SLp震相校正效果显著(M4模型).我们相信本文提出的各向异性校正方法在地壳和上地幔各向异性介质中快轴方向差异较大的区域也有较好的应用前景.
本文的研究基于HTI介质中S波的各向异性模型,目前还未考虑更复杂的情况,比如,加入P波的各向异性和使用对称轴在空间具有任意取向的TI介质模型(ATI)等.同时,在各向异性特征有明显差异的区域,应将走时校正方法拓展至三维的各向异性模型.
致谢 感谢中国地震局地球物理研究所“中国地震科学探测台阵数据中心”为本研究提供地震波形数据(doi:10.12001/ChinArray.Data),同时也感谢两位评阅人对本文认真的评审和提出宝贵建议.
Babuska V, Cara M. 1991. Seismic Anisotropy in the Earth. Netherlands: Kluwer Academic Publishers.
|
Chang L J, Ding Z F, Wang C Y, et al. 2017. Vertical coherence of deformation in lithosphere in the NE margin of the Tibetan plateau using GPS and shear-wave splitting data. Tectonophysics, 699: 93-101. DOI:10.1016/j.tecto.2017.01.025 |
Chang L J, Wang C Y, Ding Z F, et al. 2008. Seismic anisotropy of upper mantle in the northeastern margin of the Tibetan Plateau. Chinese Journal of Geophysics (in Chinese), 51(2): 431-438. |
Chen X F. 1993. A systematic and efficient method of computing normal modes for multilayered half-space. Geophysical Journal International, 115(2): 391-409. DOI:10.1111/j.1365-246X.1993.tb01194.x |
Chen Y F, Chen J H, Guo B, et al. 2019. Denoising the receiver function through curvelet transforming and migration imaging. Chinese Journal of Geophysics (in Chinese), 62(6): 2027-2037. DOI:10.6038/cjg2019M0248 |
China Seismic Array Data Center.2006. China Seismic Array waveform data. China Earthquake Administration.http://www.chinarraydmc.cn.
|
Du J, Li Y, Wang C Y, et al. 2010. High Pressure Geoscience (in Chinese). Beijing: Seismological Press.
|
Dueker K G, Sheehan A F. 1997. Mantle discontinuity structure from midpoint stacks of converted P to S waves across the Yellowstone hotspot track. Journal of Geophysical Research:Solid Earth, 102(B4): 8313-8327. |
Farra V, Vinnik L. 2000. Upper mantle stratification by P and S receiver functions. Geophysical Journal International, 141(3): 699-712. DOI:10.1046/j.1365-246x.2000.00118.x |
Gan W J, Zhang P Z, Shen Z K, et al. 2007. Present-day crustal motion within the Tibetan Plateau inferred from GPS measurements. Journal of Geophysical Research:Solid Earth, 112(B8): B08416. DOI:10.1029/2005JB004120 |
Hammond J O S. 2014. Constraining melt geometries beneath the Afar Depression, Ethiopia from teleseismic receiver functions:The anisotropic H-κ stacking technique. Geochemistry, Geophysics, Geosystems, 15(4): 1316-1332. DOI:10.1002/2013GC005186 |
Hess H H. 1964. Seismic anisotropy of the uppermost mantle under oceans. Nature, 203(4945): 629-631. DOI:10.1038/203629a0 |
Jacobsen S D, Jiang F M, Mao Z, et al. 2008. Effects of hydration on the elastic properties of olivine. Geophysical Research Letters, 35(14): L14303. DOI:10.1029/2008GL034398 |
Ji S C, Mainprice D. 1989. Seismic anisotropy in the lower crust induced by the lattice preferred orientations of minerals. Seismology and Geology (in Chinese), 11(4): 15-30. |
Jin Z M, Ji S C, Jin S Y. 1994. Lattice preferred orientation of olivines and seismic anisotropy in the upper mantle. Chinese Journal of Geophysics (Acta Geophysica Sinica in Chinese), 37(4): 469-477. |
Kaviani A, Rümpker G. 2015. Generalization of the H-κ stacking method to anisotropic media. Journal of Geophysical Research:Solid Earth, 120(7): 5135-5153. DOI:10.1002/2014JB011858 |
Kennett B, Engdahl R. 1991. Travel times for global earthquake location and phase identification. Geophysical Journal International, 105: 429-465. |
Kind R, Yuan X H, Kumar P. 2012. Seismic receiver functions and the lithosphere-asthenosphere boundary. Tectonophysics, 536-537: 25-43. DOI:10.1016/j.tecto.2012.03.005 |
Kumar P, Yuan X, Kind R, et al. 2006. Imaging the colliding Indian and Asian lithospheric plates beneath Tibet. Journal of Geophysical Research:Solid Earth, 11: B06308. DOI:10.1029/2005JB003930 |
Kumar P, Yuan X, Kumar M, et al. 2007. The rapid drift of the Indian tectonic plate. Nature, 449: 894-897. DOI:10.1038/nature06214 |
Langston C A. 1979. Structure under Mount Rainier, Washington, inferred from teleseismic body waves. Journal of Geophysical Research:Solid Earth, 84(B9): 4749-4762. DOI:10.1029/JB084iB09p04749 |
Levin V, Park J. 1997. P-SH conversions in a flat-layered medium with anisotropy of arbitrary orientation. Geophysical Journal International, 131(2): 253-266. DOI:10.1111/j.1365-246X.1997.tb01220.x |
Li X Q, Kind R, Yuan X H, et al. 2004. Rejuvenation of the lithosphere by the Hawaiian plume. Nature, 427(6977): 827-829. DOI:10.1038/nature02349 |
Li Y H, Wu Q J, Zhang F X, et al. 2011. Seismic anisotropy of the Northeastern Tibetan Plateau from shear wave splitting analysis. Earth and Planetary Science Letters, 304(1-2): 147-157. DOI:10.1016/j.epsl.2011.01.026 |
Liu H F, Niu F L. 2012. Estimating crustal seismic anisotropy with a joint analysis of radial and transverse receiver function data. Geophysical Journal International, 188(1): 144-164. DOI:10.1111/j.1365-246X.2011.05249.x |
Liu Q Y, Kind R. 2004. Multi-channel maximal likelihood deconvolution method for isolating 3-component teleseismic receiver function. Seismology and Geology (in Chinese), 26(3): 416-425. |
Liu Q Y, Kind R, Li S C. 1996. Maximal likelihood estimation and nonlinear inversion of the complex receiver function spectrum ratio. Chinese Journal of Geophysics (Acta Geophysica Sinica in Chinese), 39(4): 500-511. |
Lou X H, Ai Y S, Zhang Y Y, et al. 2017. Study of lithospheric structure in the central and western North China craton. Progress in Geophysics (in Chinese), 32(4): 1458-1464. DOI:10.6038/pg20170406 |
Morris G B, Raitt R W, Shor G G Jr. 1969. Velocity anisotropy and delay-time maps of the mantle near Hawaii. Journal of Geophysical Research, 74(17): 4300-4316. DOI:10.1029/JB074i017p04300 |
Nicolas A, Christensen N I. 1987. Formation of anisotropy in upper mantle peridotites-a review.//Fuchs K, Froidevaux Ceds. Composition, Structure and Dynamics of the Lithosphere-Asthenosphere System. Washington DC: Geodynamics Series, 111-123.
|
Oreshin S, Vinnik L, Peregoudov D, et al. 2002. Lithosphere and asthenosphere of the Tien Shan imaged by S receiver functions. Geophysical Research Letters, 29(8): 32-1. |
Qi S H, Liu Q Y, Chen J H, et al. 2016. Stratified crustal anisotropy from receiver function and its particle swarm inversion. Chinese Journal of Geophysics(in Chinese) (in Chinese), 59(12): 4544-4559. DOI:10.6038/cjg20161217 |
Raitt R W, Shor G GJr, Francis T J G, et al. 2015. Anisotropy of the Pacific upper mantle. Journal of Geophysical Research, 74(12): 3095-3109. |
Savage M K. 1999. Seismic anisotropy and mantle deformation:What have we learned from shear wave splitting?. Reviews of Geophysics, 37(1): 65-106. |
Shen X Z, Yuan X H, Liu M. 2015. Is the Asian lithosphere underthrusting beneath northeastern Tibetan Plateau? Insights from seismic receiver functions. Earth and Planetary Science Letters, 428: 172-180. DOI:10.1016/j.epsl.2015.07.041 |
Silver P G, Chan W W. 1991. Shear wave splitting and subcontinental mantle deformation. Journal of Geophysical Research:Solid Earth, 96(B10): 16429-16454. DOI:10.1029/91JB00899 |
Vinnik L P, Kosarev G L, Makeeva L I. 1984. Lithosphere anisotropy from the observation of SKS and SKKS waves. Doklady Akademii Nauk SSSR, 278(6): 1335-1339. |
Wang C Y, Chang L J, Lv Z Y, et al. 2007. Seismic anisotropy of upper mantle in eastern Tibetan Plateau and related crust-mantle coupling pattern. Science in China Series D:Earth Sciences, 50(8): 1150-1160. DOI:10.1007/s11430-007-0053-5 |
Wang J. 2016. Review of the s-wave receiver function method. Progress in Geophysics (in Chinese), 31(1): 88-97. DOI:10.6038/pg20160110 |
Wang Q, Niu F L, Gao Y, et al. 2016. Crustal structure and deformation beneath the NE margin of the Tibetan Plateau constrained by teleseismic receiver function data. Geophysical Journal International, 204(1): 167-179. |
Wen L M, Badal J, Hu J F. 2019. Anisotropic H-k stacking and (revisited) crustal structure in the southeastern margin of Tibet. Journal of Asian Earth Sciences, 169: 93-104. DOI:10.1016/j.jseaes.2018.07.028 |
Wilson D, Angus D, Ni J, et al. 2006. Constraints on the interpretation of S-to-P receiver functions. Geophysical Journal International, 165: 969-980. DOI:10.1111/j.1365-246X.2006.02981.x |
Ye Z, Gao R, Li Q S, et al. 2015. Seismic evidence for the North China plate underthrusting beneath northeastern Tibet and its implications for plateau growth. Earth and Planetary Science Letters, 426: 109-117. DOI:10.1016/j.epsl.2015.06.024 |
Ye Z, Li Q S, Gao R, et al. 2016. Anisotropic regime across northeastern Tibet and its geodynamic implications. Tectonophysics, 671: 1-8. DOI:10.1016/j.tecto.2016.01.011 |
Yuan X H, Kind R, Li X Q, et al. 2006. The S receiver functions:synthetics and data example. Geophysical Journal International, 165(2): 555-564. DOI:10.1111/j.1365-246X.2006.02885.x |
Yuan X H, Ni J, Kind R, et al. 1997. Lithospheric and upper mantle structure of southern Tibet from a seismological passive source experiment. Journal of Geophysical Research:Solid Earth, 102(B12): 27491-27500. |
Zhang H S, Teng J W, Tian X B, et al. 2012. Lithospheric thickness and upper-mantle deformation beneath the NE Tibetan Plateau inferred from S receiver functions and SKS splitting measurements. Geophysical Journal International, 191(3): 1285-1294. |
Zhang P Z, Shen Z K, Wang M, et al. 2004. Continuous deformation of the Tibetan Plateau from global positioning system data. Geology, 32(9): 809-812. DOI:10.1130/G20554.1 |
Zhao L, Zheng T Y. 2005. Using shear wave splitting measurements to investigate the upper mantle anisotropy beneath the North China Craton:Distinct variation from east to west. Geophysical Research Letters, 32(10): L10309. DOI:10.1029/2005GL022585 |
Zheng S H, Gao Y. 1994. Azimuthal anisotropy in lithosphere on the Chinese mainland from observations of SKS at CDSN. Acta Seimologica Sinica (in Chinese), 16(2): 131-140. |
Zhu G C, Ma M N, Zhou X Y, et al. 2013. Advances in elastic properties of olivine. Progress in Geophysics (in Chinese), 28(1): 89-101. DOI:10.6038/pg20130110 |
Zhu L P, Kanamori H. 2000. Moho depth variation in southern California from teleseismic receiver functions. Journal of Geophysical Research:Solid Earth, 105(2): 2969-2980. |
常利军, 王椿镛, 丁志峰, 等. 2008. 青藏高原东北缘上地幔各向异性研究. 地球物理学报, 51(2): 431-438. DOI:10.3321/j.issn:0001-5733.2008.02.015 |
陈一方, 陈九辉, 郭飚, 等. 2019. 接收函数曲波变换去噪与偏移成像. 地球物理学报, 62(6): 2027-2037. DOI:10.6038/cjg2019M0248 |
杜建国, 李营, 王传远, 等. 2010. 高压地球科学. 北京: 地震出版社.
|
嵇少丞, 大卫·梅因普利斯. 1989. 晶格优选定向和下地壳地震波速各向异性. 地震地质, 11(4): 15-30. |
金振民, Ji S C, 金淑燕. 1994. 橄榄石晶格优选方位和上地幔地震波速各向异性. 地球物理学报, 37(4): 469-477. DOI:10.3321/j.issn:0001-5733.1994.04.007 |
刘启元, Kind R. 2004. 分离三分量远震接收函数的多道最大或然性反褶积方法. 地震地质, 26(3): 416-425. DOI:10.3969/j.issn.0253-4967.2004.03.006 |
刘启元, Kind R, 李顺成. 1996. 接收函数复谱比的最大或然性估计及非线性反演. 地球物理学报, 39(4): 500-511. DOI:10.3321/j.issn:0001-5733.1996.04.008 |
娄辛辉, 艾印双, 张耀阳, 等. 2017. 华北克拉通中西部岩石圈结构研究. 地球物理学进展, 32(4): 1458-1464. DOI:10.6038/pg20170406 |
齐少华, 刘启元, 陈九辉, 等. 2016. 地壳分层各向异性介质接收函数及其粒子群反演. 地球物理学报, 59(12): 4544-4559. DOI:10.6038/cjg20161217 |
王椿镛, 常利军, 吕智勇, 等. 2007. 青藏高原东部上地幔各向异性及相关的壳幔耦合型式. 中国科学D辑:地球科学, 37(4): 495-503. |
王峻. 2016. S波接收函数方法研究进展. 地球物理学进展, 31(1): 88-97. DOI:10.6038/pg20160110 |
郑斯华, 高原. 1994. 中国大陆岩石层的方位各向异性. 地震学报, 16(2): 131-140. |
中国地震科学探测台阵数据中心. 2006.中国地震科学探测台阵波形数据.中国地震局.http://www.chinarraydmc.cn.
|
朱国臣, 马麦宁, 周晓亚, 等. 2013. 橄榄石矿物弹性研究进展. 地球物理学进展, 28(1): 89-101. DOI:10.6038/pg20130110 |
 2020, Vol. 63


