 2020, Vol. 63


2. 自然资源部深地动力学重点实验室, 中国地质科学院地质研究所, 北京 100037;
3. 中国地震局地壳动力学重点实验室, 中国地震局地壳应力研究所, 北京 100085
2. Key Laboratory of Deep-Earth Dynamics of Ministry of Natural Resources, Chinese Academy of Geological Sciences, Beijing 100037, China;
3. Key Laboratory of Crustal Dynamics, China Earthquake Administration, Institute of Crustal Dynamics, China Earthquake Administration, Beijing 100085, China
天山构造带是亚洲大陆内部最大的造山带之一,西起乌兹别克斯坦往东延伸到中国新疆境内,全长近2500 km,宽300~500 km.其初始形成时代为晚古生代,由多期板块俯冲和碰撞作用形成(Allen et al., 1993; 马瑞士等, 1997; Xiao et al., 2004; Charvet et al., 2011),新生代受欧亚板块与印度洋板块碰撞的影响,经历了强烈的地壳缩短和隆升作用,山脉两侧发育大型逆冲推覆构造,地壳缩短量可达200±50 km,隆升量高达4000 m(Molnar and Tapponnier, 1975; Allen et al., 1999).GPS测量和活动断裂研究获取的缩短速率差异巨大(Abdrakhmatov et al., 1996; Avouac et al., 1993; Molnar and Deng, 1984; Zubovich et al., 2010; Shen et al., 2001),对缩短方式同样存在不同解读:变形均匀分布在整个块体内部或集中在块体边缘大型断裂(Avouac and Tapponnier, 1993; Shen et al., 2001),但一致认为叠瓦状逆冲推覆构造是区内地壳缩短和山脉隆升的主要体现方式之一.
在近南北向主压应力的作用下,天山山脉两侧形成的逆冲推覆构造具有类似的构造特征,南侧与塔里木盆地相邻部位发育向北倾斜的逆冲断层带,而北侧与准噶尔盆地接壤带发育向南倾斜的逆冲断层组合(图 1b).区内地震活动频繁,震级大于5的地震普遍分布于山脉两侧,震源深度多集中在10~30 km范围(Nelson et al., 1987; Gu et al., 1989; Molnar and Ghose, 2000; Wang et al., 2004).震源机制同样表明,山脉北侧的地震断层多为向南倾斜的逆冲断层,而山脉南侧多为向北倾斜的逆冲断层,其中包括1906年发生在北缘的M7.7玛纳斯地震和1949年发生在南缘的M7.2轮台地震.这些地震既是区域构造活动的产物,亦是研究天山构造带构造特征的良好载体,典型范例为2015年发生在塔里木南缘的MW6.3皮山地震(Ainscoe et al., 2017),发震断层为一向南倾斜的低角度逆冲断层,表明新生代西昆仑山通过逆冲推覆模式实现多阶段生长(Lu et al., 2016).

|
图 1 (a)研究区构造简图; (b)天山山脉盆岭地貌分布(据Wang et al., 2008, 贺振宇等, 2012修改),内插子图为天山山脉新生代构造模式图, 改自于Fu等(2003); (c)天山北缘背斜组合及其与2016年呼图壁地震、1906年玛纳斯地震震中空间展布关系, 改自Deng等(1996) Fig. 1 (a) Simplified tectonic background of the research area; (b) Basin and range of the Chinese Tian Shan (modified after Wang et al., 2008; He et al., 2012), inset diagram is the Cenozoic tectonic model of the Tian Shan orogenic belt (from Fu et al., 2003); (c) The spatial distribution of the anticlines in the northern Chinese Tian Shan (from Deng et al., 1996), and their relation with the 2016 Hutubi earthquake and the 1906 Manas earthquake |
2016年M6.2呼图壁地震发生在天山北缘,其发震构造直接关系到人们对天山构造带扩展模式乃至地貌长期演化的理解,然而对这一问题有两种不同解读:向南倾斜的低角度逆冲断层和向北倾斜的高角度反冲断层.争论集中体现在:1)震源机制解多样化,部分研究机构认为主节面为向北倾斜逆断层,另外一部分则认为主节面为向南倾斜逆断层(表 1);2)从构造模式推断该断层大概率为向南倾斜的低角度断层(图 1b),然而其他证据不支持这一结论,余震分布显示该断面可能是一条向北陡倾的反冲断层(图 2),Lu等(2017)认为该高角度逆断层与1906年玛纳斯地震主滑动面呈y型分布;3)远震体波反演(Liu et al., 2017)和InSAR数据分析(Wang et al., 2019)难以区分向南和向北倾斜断面;4)从余震分布角度考虑,同样并不能排除向东南倾斜的低角度逆断层可能性(图 2).同震库伦应变可为解决这一争论提供线索,断层位移在地壳中形成永久形变,应变性质和大小与断层面参数密切相关(Lin and Stein, 2004; Toda et al., 2005),亦可通过同震应变反推断层面参数(Canitano et al., 2015).本次地震11~110 km范围内分布有四台中国地震局地壳应力研究所布置的RZB型四分量钻孔应变仪(图 1a),本文以它们记录到的同震应变验证中国地震局地球物理研究所(IGP-CEA, 2016)和美国地质调查局(USGS, 2016)提供的震源机制解,并在此基础上提出对天山构造带缩短和隆升方式的新认识.
|
|
表 1 2016年M6.2呼图壁地震震源机制解统计 Table 1 Statistics of the focal mechanisms of the 2016 M6.2 Hutubi earthquake |

|
图 2 呼图壁地震余震空间展布,左边来源于中国地震局地球物理研究所,右边来源于Lu等(2017). (a, b)为余震的平面投影; (c, d)为余震在IGP-CEA震源机制解辅助节面的垂面投影; (e, f)为余震在其主节面的垂面投影,具体震源参数参考表 1 Fig. 2 Spatial distribution of the aftershocks of the 2016 Hutubi earthquake. Aftershocks in the left column are from IGP-CEA, and those in the right column are from Lu et al. (2017). (a, b) are the surface projections of the aftershocks, (c, d) are the projections perpendicular to the IGP-CEA auxiliary nodal plane, and (e, f) are the projections perpendicular to the IGP-CEA main nodal plane. For the detailed source parameters, please see Table 1 |
天山构造带位于中国境内段长1700 km,北与准噶尔盆地相邻,南与塔里木盆地接壤,由多个板块在晚古生代拼贴形成.演化时间大致分布在600~250 Ma(Şengör et al., 1993),经历了前寒武纪古陆形成、古生代洋-陆俯冲增生、晚古生代陆-陆碰撞造山和中新生代陆内成盆多个阶段(薛春纪等,2014).传统上根据两条古生代缝合带划分为北天山、中天山和南天山(Gao et al., 1998; Xiao et al., 2004),后根据超高压变质岩和蛇绿混杂岩划分为北天山、伊利地块、中天山和南天山四个构造单元(图 1b,Wang et al., 2008;Charvet et al., 2011).区内岩性种类多样,前寒武纪变质结晶岩基底、古生代洋-陆和陆-陆碰撞形成的火山岩、磨拉石和陆相碎屑沉积岩建造分布广泛(马瑞士等,1993;贺振宇等,2012;薛春纪等,2014).中-新生代地层主要分布于山间盆地及其山脉两侧,岩性多为河湖相碎屑岩及少量湖相碳酸盐,山脉两侧沉积相组合虽然不尽相同,但整体上仍具有一定的可对比性(李忠和彭守涛,2013).
受欧亚板块和印度洋板块碰撞的影响,区内新生代地层普遍发生强烈的褶皱变形,与下伏老地层以滑脱面的形式接触(Molnar et al., 1994).部分古生代断层重新活化,分割古生代和中-新生代地质体,并控制天山内部的地貌高差;新生代断裂普遍分布在盆地内部,规模较小,但活动性却远高于前者(Lin et al., 2002; Fu et al., 2003).北天山与准噶尔盆地接触带发育三组背斜:独山子—安集海背斜,霍尔果斯—玛纳斯—吐谷鲁背斜和清水河—齐古背斜(图 1c),三组背斜走向皆为近东西向.清水河—齐古背斜靠近山体一侧,由中、新生代地层组成,霍尔果斯—玛纳斯—吐谷鲁背斜地层年代为渐新世到更新世,独山子—安集海背斜则为晚中新世(Sun and Zhang, 2009).Wang等(2004)通过多条人工地球物理剖面揭示,控制这些背斜构造的边缘断裂最终汇聚于准噶尔盆地南缘断裂,并且在7 km和16 km深处发育两条滑脱面.古地震研究认为晚第四纪以来,与清水河—齐古背斜伴生的逆冲断层并不活动,而更靠近准噶尔盆地内部的独山子—安集海背斜带和霍尔果斯—玛纳斯—吐谷鲁背斜相对活跃(Deng et al., 1996).2016年呼图壁地震发生在齐古背斜附近,其发震构造理论上与控制清水河—齐古背斜生长的逆冲断裂密切相关.
2 数据和方法 2.1 仪器和数据四分量RZB钻孔应变仪由中国地震局地壳应力研究所研发,测量精度为10-10,能够精确地记录到应变固体潮和地震导致的动、静态应变(邱泽华和石耀霖, 2003; 欧阳祖熙等,2004;Ouyang et al., 2009; 李涛等, 2011;Gong et al., 2019).为了监测天山一带的地壳运动情况,2015年中国地震局地壳应力研究所在该地区布设了九台此类应变仪,其中最近的四个台站记录到了本次地震产生的应变响应(图 3).雀儿沟台站震中距为11.52 km,石场台站震中距为54.35 km,巴伦台台站震中距为102.54 km,榆树沟台站震中距为108.83 km.四台应变仪全部安装在基岩中,深度从33 m到156 m不等(表 2).本文选取的数据时长为5~9个月,持续时间为2016年7月至2017年4月.所有数据的原始采样周期为1 s,为了简化计算,当时间跨度较大时,我们采用1 min重采样率数据,而地震前后24 h,使用1 Hz采样率原始数据.

|
图 3 应变仪记录的同震响应, 张应变为正,展示数据为震前和震后各15天.内插圆形子图为1~4探头实际分布方位, 探头1的方位角列于表 2.矩形子图为面应变S1+S2固体潮频段频谱分布 Fig. 3 Coseismic strain response to the main shock, extension is positive. Data 15 days before and after the main shock are presented. Inset lines 1~4 show the azimuths of the 4 sensors in each borehole. Azimuths of each sensor l are listed in Table 2. Inset rectangles are the frequency distribution in the tidal band of the areal strain S1+S2 |
|
|
表 2 台站信息统计(方位为探头1的实测方位,正北方向为0°,顺时针为正) Table 2 Information of the stations used in this study (The azimuths are the measured values of each sensor 1, clockwise from north is positive) |
时间准确性直接关系到数据的可信度,当台站GPS信号微弱时,很难保证仪器时间与实际时间完全一致,本文使用地震波理论到时校正数据时间.根据震中距分布,雀儿沟和石场属于地方震(震中距Δ < 1°),榆树沟和巴伦台位于地方震到区域震临界范畴(震中距Δ≈1°),而浅源(震源深度H≈16 km)近震(震中距Δ≤1°)面波不发育,最突出的震相是直达波Pg和Sg.
地震前后15天时间内,主震对应变产生的影响最大(图 3),应变波形同样可以识别出明显的P波和S波震相.如图 4a所示,地震波P波传至石场台站的理论时间为13:15:15,滞后发震时刻11.9 s(国家地震局地球物理研究所,1980),而实际观测到的应变P波到时为13:22:39,两者差值高达7.4 min.通过时间校正之后,应变P波到达时间与理论地震波P波到达时间完全一致(图 4b).相同的方法应用到雀儿沟、巴伦台和榆树沟台站,确定仪器滞后时间分别为5.1,3.7和16.4 min(表 3).

|
图 4 石场S4分量时间校正.黑色虚线为地震发生时刻,灰色虚线为地震波P波的理论到时,灰色实线为观测到应变波P波到时 Fig. 4 Time correction in S4 of SC. Black dashed lines mark the occurrence time of the main shock, gray dashed lines show the predicted arrival time of the seismic P waves, and the gray solid lines show the observed arrival time of the P waves in the strain record |
|
|
表 3 校正时间, 最大主应变方向, M2频段相位差和振幅比统计(C1为探头组合1, 2, 3, C2为探头组合2, 3, 4, C3为探头组合1, 2, 4, C4为探头组合1, 3, 4. M2频段相位差为时间校正后的结果) Table 3 Statistics of the corrected time, the direction of the principal maximum strain, the phase lag and the amplitude ratio of the M2 band (The combinations of C1, C2, C3, and C4 are sensors 1, 2, 3, sensors 2, 3, 4, sensors 1, 2, 4 and sensors 1, 3, 4, respectively. The calculated phase lag and amplitude ratio are based on the calibrated data) |
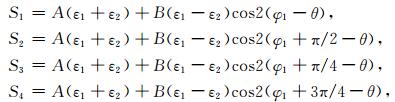
如图 3所示,仪器内部四个探头依次成45°夹角,探头1和2, 3和4互相垂直.假设平面最大主应变方位角为θ,探头1的方位角为φ1, 则在均质弹性体中四个探头记录到的应变, 如Qiu等(2013)文中所示:
|
(1) |
式中A和B为与仪器形状和材料有关的常数(Gladwin and Hart, 1985),ε1,ε2为最大和最小主应变.
由于四组探头实测值为同一地点的平面应变,通过其中任意三组求取的最大主应变理应完全一致.实际仪器安装过程中由于多种因素的影响,例如仪器和孔壁耦合状态、仪器是否绝对水平等,这一理想状态通常难以达到.然而在构造背景已知的前提下,如果四组测量值都接近真实应变值,不同组合求取的最大主应变也应接近真实应变值.通过依次相隔45°夹角的应变求取最大、最小主应变的方法在多篇文献中有详细论述(邱泽华和石耀霖,2005;刘序俨等,2014),本文不再详述.
本文仅考虑以下四种探头组合:探头1, 2, 3,探头2, 3, 4,探头1, 2, 4和探头1, 3, 4.如图 1所示,天山构造带北缘主压应力接近南-北向,四种不同组合计算得到的最大主应变方向基本上位于NW45°到NE20°之间(表 3).计算结果整体上与构造背景具有一定的可比性,特别是石场、雀儿沟和巴伦台三个台站,计算值基本在NW22.5°到NE22.5°之间,非常接近南-北向构造主应力方向.雀儿沟和榆树沟不同组合计算得到的结果极为接近,均方差分别为2.9°和5.0°,石场和巴伦台均方差则分别为13.7°和18.5°.
2.4 固体潮分析和数据标定四个台站都观测到了良好的固体潮波形,面应变S1+S2频谱分析显示,应变数据记录到了非常明显的固体潮峰值,包括半日波M2和S2,全日波K1和O1,且M2频段振幅最大(图 2),这一情况为利用理论固体潮验证和标定观测数据提供了基础.本文在同时考虑天体引力和大洋潮汐的前提下,采用Agnew(2012)方法生成理论固体潮数据,用M2频段对观测数据进行标定(Zhang et al., 2017, 2019).计算时间窗口为29.53天,相邻时间窗口重叠率为80%,重采样周期为0.1 h,具体方法介绍可参考Xue等(2013).
如图 5a所示,四个台站M2频段相位差相对稳定,石场台站出现了相位超前现象,而其余三个台站滞后理论固体潮.巴伦台与理论固体潮相位最匹配,相位差为1°~-3°,雀儿沟相位差为-3°~-14°,石场为9°~17°,榆树沟为-18°~-30°.振幅比值在观测时段内同样相对稳定(图 5b),巴伦台振幅比值均值为0.6,榆树沟为1.2,雀儿沟为1.0,石场为0.8.通常认为理论计算值与地壳内部由固体潮汐产生的实际应变非常接近(Doan et al., 2006),故测量数据越接近真实应变值,与理论固体潮的振幅比值应越接近1,榆树沟、雀儿沟和石场误差范围在±0.2之间,巴伦台误差为-0.4,测量值与理论值具有良好的可比性.

|
图 5 M2频段与理论固体潮的相位差; (b) M2频段与理论固体潮的振幅比值 Fig. 5 Phase lag (a) and Amplitude ratio (b) of the M2 band in S1+S2 |
数据标定是指利用已知应变校正观测数据,使得观测值更接近理论值,实际参考的应变包括地震波(Bernard et al., 2006),激光应变仪测量数据(Hart et al., 1996)和理论固体潮等(Hart et al., 1996; Roeloffs, 2010; Hodgkinson et al., 2013; Langbein, 2015).本文采用理论固体潮M2频段标定观测数据,校正后的数据等于原始测量值除以振幅比值k,表 4为四个台站16个分量的统计情况,k值为4~9个月观测数据振幅比值的平均值,误差为数列的标准方差.
|
|
表 4 固体潮标定结果 Table 4 Statistics of the calibration coefficients |
数据标定完成后,我们着重分析了地震前1 min至地震后25 min段数据,如图 6所示,所有探头都记录到了良好的应变波形,并且在震后5~10 min之内恢复到稳定状态.同震应变定义为:波形稳定至结束时间段均值与震前1 min均值之差,表 5列出了各分量同震应变值,大致分布范围为10-11~10-6,巴伦台S1,S4,雀儿沟S1,S3,S4,石场S3和榆树沟S4记录到张应变增强,其他分量记录到压应变增强.榆树沟S2测量值为-0.07±0.4×10⁻⁹,这一数值小于仪器测量精度,在后续的分析中未考虑.

|
图 6 仪器记录的同震应变, 张应变为正.应变单位为10-9 Fig. 6 Coseimsic strain response recorded by the RZB borehole strainmeters, and extension is positive. The strain unit is nanostrain |
|
|
表 5 应变观测值(1),IGP-CEA主、辅助节面预测值(2, 4)和USGS主、辅助节面预测值(3, 5)统计.应变单位为10-9, 张应变为正 Table 5 Statistics of the measured offsets (1), the predictions of the IGP-CEA nodal planes (2, 4) and the USGS nodal planes (3, 5). The strain unit is nanostrain, and extension is positive |
如图 7所示,应变对数值大体上随震中距呈线性递减,拟合方程为log10(Y)=-0.021X-6.57,斜率和截距95%置信区间分别为-0.029~-0.012和-7.27~-5.87,衡量拟合优度的可决系数R-square等于0.65.这一趋势符合理想状态下弹性应变的分布规律,在理想弹性体中,断层位错导致的库伦应变与震中距R3呈负相关(Manga and Wang, 2015).在非对数坐标系下对测量值进行幂函数拟合,得到最优解为R-2.34,指数95%置信区间为-11.47~6.79,跨度比较大,但最优解的可决系数高达0.59,说明这一数值的统计学意义是可信的,应变观测值随震中距呈幂函数衰减,并且与理论状态下的衰减关系具有一定的可比性.

|
图 7 同震库伦应变与震中距之间关系(其对数值与震中距基本呈直线衰减,非对数坐标系下(内插子图)呈幂函数衰减) Fig. 7 The correlation between the strain offsets and the epicentral distances (The logarithmic values decay linearly with the epicentral distance, while the original values decease in power law) |
不同研究机构提出的震源参数差异明显,其中IGP-CEA和USGS震源参数最受关注,并被广泛分析和引用(Lu et al., 2017; Liu et al., 2017; Wang et al., 2019).两者都认为主节面为一条向北倾斜的高角度逆断层,不同之处在于对辅助节面的解读,前者认为是北东走向的低角度逆冲断层,而后者认为是为近东西走向的低角度逆冲断层.本文主要考虑IGP-CEA主节面(273°/70°/108°)和USGS辅助节面(80°/19°/81°)两种模型,IGP-CEA辅助节面(49°/27°/50°)和USGS主节面(269°/71°/93°)作为参考同样在对比范围之内.
4.1.1 四分量原始记录值本文采用Coulomb v3.3(Lin and Stein, 2004; Toda et al., 2005)计算理论应变值,该软件采用Okada(1992)模型计算特定矩形破裂面导致的应变场分布.断层面的规模通过Wells和Coppersmith(1994)提出的经验公式计算获取,震级为MW6.0的逆断层地震,破裂面长度为10.31 km,宽度为6.85 km,位移为0.524 m.矩形中心位于IGP-CEA重定位余震中心附近(N43.78,E86.32),矩心深度为震源深度,计算结果列于表 5.
两种主要模型的预测值都比较接近实际观测值,USGS辅助节面15个预测值中有13个与实际观测值符号一致,两处例外为石场S1和石场S3,石场S1和S3实测值为压应变和张应变增强,而USGS预测值为张应变和压应变增强;相比较而言IGP-CEA主节面预测结果更为合理,15个预测值与观测值全部符号一致.IGP-CEA辅助节面和USGS主节面分别对石场S1和雀儿沟S3,石场S1和石场S3的预测值出现偏差,此外,IGP-CEA辅助节面不仅仅在构造形态上与天山北缘不匹配,对近场台站雀儿沟S3的预测与观测结果严重不符,观测值为6.3×10⁻⁸而预测值为-1.96×10⁻⁷,应变大小和性质都出现较大的误差.
图 8从预测值和观测值比值角度考虑剩下三种模型的合理性.三种模型计算值基本与观测值处于同一量级,特别是离震中最近的雀儿沟台站,四分量比值基本都集中在1附近;其他台站比值分布相对分散,但总体处于0.1~4之间(3.2>IGP-CEA>0.19, 2.8>USGS>0.01).IGP-CEA全部预测值与观测值量级一致,USGS辅助节面雀儿沟S3(0.05)、石场S1(0.04)、巴伦台S3(0.04)和USGS主节面石场S1(0.07)、巴伦台S3(0.01)都比观测值小一个数量级.从预测值与观测值比值角度考虑,IGP-CEA主节面同样比USGS主、辅助节面更合理.

|
图 8 IGP-CEA主节面(a), USGS辅助节面(b), USGS主节面(c)预测值与实际观测值比值分布 Fig. 8 Ratios between the predicted and measured strain offsets of the main nodal plane of the IGP-CEA focal mechanism (a), the main nodal plane (b) and the auxiliary nodal plane (c) of the USGS focal mechanism |
为了更直观地体现理论应变与实际观测值之间的关系,图 9和图 10分别展示了IGP-CEA和USGS震源参数在0.1 km深度N-S和E-W方向理论应变场,相同方向的测量值则通过公式(1)和四分量的实际方位角计算得出(表 6).四组节面在近地表形成的应变与实际观测值同样十分接近,特别是E-W分量,四组预测值与观测值应变性质全部一致.主要差别在于对石场和榆树沟N-S分量的解读:IGP-CEA辅助节面预测石场和榆树沟N-S分量张应变增强,与观测到的压应变增强完全相反;USGS主、辅助节面对石场N-S方向的计算值与观测值符号相反;而IGP-CEA主节面所有预测值与观测值全部一致.

|
图 9 IGP-CEA主、辅助节面在浅地表100 m形成的南北向和东西向应变场, 张应变为正.内插子图为破裂面在地表的投影, 绿线为推测的地表破裂带位置, 红色五角星为IGP-CEA重定位震中 Fig. 9 Calculated strain at the shallow depth of 100m in the N-S and E-W direction, extension is positive. Considered source parameters are the IGP-CEA nodal planes, inset diagrams denote the surface projections of the ruptured fault planes. The green lines are the speculated surface ruptures, and the red pentagons mark the relocated hypocenter by IGP-CEA |

|
图 10 USGS主、辅助节面在浅地表100 m深度形成的南北向和东西向应变场(张应变为正) Fig. 10 Calculated strain at the shallow depth of 100 m in the N-S and E-W direction (extension is positive). Considered source parameters are the USGS nodal planes |
|
|
表 6 南北和东西向实际观测值(1),IGP-CEA主、辅助节面预测值(2, 3)和USGS主、辅助节面预测值(4, 5) (应变单位为10-9, 张应变为正) Table 6 Statistics of the measured offsets in N-S and E-W direction (1), predictions of the IGP-CEA nodal planes (2, 3) and the USGS nodal planes (4, 5). All data are in nanostrain, and extension is positive |
由于仅有四个台站记录到了本次地震的库伦应变响应,其分布密度无法支持更精细的对比分析,然而综合考虑构造背景、南北和东西向应变分量以及原始四分量的分析结果,基本上可以排除IGP-CEA辅助节面49°/27°/50°,相对于USGS主、辅助节面而言,该节面与观测值不匹配的频率更高;此外,从余震分布的角度考虑,低角度逆冲断层最可能为该节面,在排除它之后,最合理的断层面为向北倾斜的高角度逆冲断层.故此,我们认为本次地震的发震断层面是一条向北倾斜的高角度逆断层,断层面参数更接近IGP-CEA震源机制解主节面(273°/70°/108°).
4.2 对天山造山带隆升的启示新生代天山构造带的山体隆升和地壳缩短是对欧亚大陆和印度洋板块碰撞的远程响应(Molnar and Tapponnier, 1975; Abdrakhmatov et al., 1996),区内发生的地震活动是这一碰撞过程的间接产物.本次地震的发震构造与天山北缘主断层明显不一致:断层面倾向与主断层系相反,断层面倾角明显偏大(图 11a).正常情况下,逆冲推覆带前缘主断层的倾角远小于45°(Scholz, 2002),例如2015年皮山地震断层倾角为20°(Lu et al., 2016),皮山地震与本次地震构造环境极其类似,两者同受青藏高原向北挤压的影响,且同处于大型逆冲推覆构造带的前缘,但发震构造迥异,前者为同向低角度逆冲断层,而后者为典型的反冲构造.

|
图 11 (a) 天山北缘构造简图, 2016年呼图壁地震发震构造为反冲断层F2; (b)低角度逆冲断层与反冲断层的几何关系; (c)常见的反冲断层形成机制, 改自Xu等(2015) Fig. 11 (a) A sketched cross section of the northern Chinese Tian Shan, the seismogenic fault of the 2016 Hutubi earthquake is the backthrust fault; (b) Geometric relation between the low-angle thrust fault and the backthrust fault; (c) Mechanisms generating the backthrust fault, modified from Xu et al. (2015) |
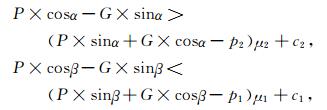
反冲构造由于其独特的构造形态,一直被认为是逆冲推覆构造带中的次级构造,通常发育在俯冲带前缘和造山带盆岭交汇部位(Stagpoole and Nicol, 2008; Xu et al., 2015).图 11b是对反冲构造的简化模型,自重为G的块体在水平挤压力P的作用下,高角度断层F2破裂而低角度断层F1不破裂的条件是:F2比F1率先到达临界应力状态.根据库伦破裂准则有
|
(2) |
式中,μ1和μ2为F1,F2摩擦系数,c1和c2为F1,F2内聚力,p1和p2为孔隙压力,α和β分别为F1,F2倾角.
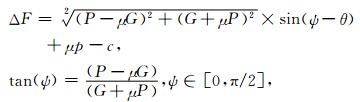
将公式(2)左侧减去右侧得到
|
(3) |
μ,c和p与公式2相同,θ为断层倾角,ψ为由重力G、挤压应力P和μ确定的常数.在0 ~ π/2取值范围内,ΔF随倾角θ减小而增大,意味着断层面倾角越小越容易发生破裂.若将块体视为理想弹性体,F1和F2断层性质则完全一致,摩擦系数μ1等于μ2,内聚力c1等于c2,当p1等于p2时,F1一定会先破裂,因为断层倾角α»β,F1受力必定先到达临界状态.
只有在极少数情况下,F2会先于F1发生破裂,例如F2断层强度远弱于F1,已有研究表明断层强度与断层带的结构和物质组成密切相关,特定情况下断层带的摩擦系数可低至0.1~0.3(Collettini et al., 2019).Carpenter等(2011)认为圣安德烈斯断裂较弱的原因是断层带蒙脱石富集,蒙脱石具有摩擦系数小、内聚力低和不易愈合等特点;而龙门山安县—灌县断裂强度较弱则是由断层带中强烈的压溶作用及其形成的层状硅酸盐矿物富集造成(He et al., 2018).断层面几何形状突变、断层面突然终止同样可以导致F2比F1更易破裂,例如断坡—断坪构造、俯冲带海山等(图 11c),当F1无法跨越障碍时在另一侧形成反冲构造,这一过程受围压、断坡形态、摩擦系数、流变学性质等多种因素的制约,但总体而言,倾角越缓、围压越小并且以脆性破裂为主时,越容易形成反冲构造(Xu et al., 2015).其他因素,例如F2断裂带存在超高孔隙压力(Hickman et al, 1995)时,F2可比F1更容易发生破裂.
本文无法深究何种原因导致本次地震沿反冲构造破裂,但通常认为反冲构造是由主逆冲断裂活动所触发,例如2004年MW9.1苏门答腊地震(Singh et al., 2011)和2010年MW8.8智利地震(Melnick et al., 2012),两次特大型地震都伴随有反冲断层的活动,少数情况下反冲逆断层能够单独发生破裂(Chuang et al., 2014).2016年M6.2呼图壁地震是典型的由反冲断层单独破裂导致的地震,说明天山内部的反向逆断层同样具有单独发震的可能性,在考虑这一区域地震危险性时,也应考虑这一类型的地震.此外,本次地震同样说明反冲构造对天山构造带隆升产生的作用不可忽略,以本次地震参数α=70°,β=19°,震级为MW6.0计算,如地震断层为F1,水平缩短量为0.50 m,垂直分量为0.17 m;如破裂面为F2,水平缩短量和垂直分量分别为0.18和0.49 m.F1和F2水平和垂直分量比值分别为2.76:1和1:2.89,低角度逆冲断层和高角度反冲逆断层对隆升和缩短的贡献差异明显,前者对地壳缩短的贡献更大,而后者对隆升的贡献更明显.
图 12是Guan等(2016)对天山北缘地震反射剖面的解译,该剖面横跨齐古背斜—吐古鲁背斜,深度为12.5 km,揭露的地层年代从中生代延续到第四纪.可以看到新生代地层发生了强烈的褶皱变形,在近南北向主压应力作用下,区内主要发育的断层为向南倾斜的低角度逆冲断层,符合天山北缘主要的地壳缩短方式是叠瓦状逆冲推覆构造这一认识;然而同样可看到区内发育不少向北倾斜的反冲构造,虽然它们的规模普遍小于主要的逆冲断层,但可观的数量加上它们对隆升的贡献更加有效,意味着它们对天山山脉隆升的贡献量可以与主逆冲断层相匹配.故我们认为天山造山带强烈的地壳缩短受控于区内主要的逆冲推覆构造带活动,但山体隆升不仅仅与主要的逆冲断层的活动有关,反向高角度逆断层同样起着非常重要的作用.

|
图 12 天山北缘齐古背斜—吐古鲁背斜地震反射剖面解译(改自Guan等(2016), 剖面位置见图 1c) Fig. 12 Interpretations of the seismic profile across the Qigu-Tugulu anticlines (modifiend from Guan et al. 2016, see its position in Fig. 1c) |
2016年M6.2呼图壁地震发生在天山北缘,分布在11~110 km范围内的四台4分量钻孔应变仪记录到了这次地震导致的库伦应变,通过对16个应变分量的分析得到了下述认识;
(1) 同震库伦应变值分布范围为10-11~10-6,其中巴伦台S1,S4,雀尔沟S1,S3,S4,石场S3和榆树沟S4记录到了张应变增强,其他分量记录到压应变增加,榆树沟S2测量值为小于仪器测量精度;
(2) 通过对比分析IGP-CEA和USGS震源机制解产生的理论应变与实际观测值之间关系,认为本次地震的发震断层是一条高角度向北倾斜的逆断层,该断层是一条明显的反向逆断层;
(3) 天山北缘发育的反向逆断层具有独立破裂发生地震的可能性,考虑周边城市地震危险性时应同时考虑到此类地震;向南倾斜的低角度逆冲断层和向北倾斜的反冲逆断层是在构造挤压应力作用下共同形成的冲起构造,对北天山山前新生代构造变形和隆升过程起着重要作用.
致谢 本论文在在写作过程中得到中国地震局地球物理研究所王宝善研究员和徐逸鹤博士的帮助,余震数据来源于中国地震局地球物理研究所房立华研究员和中国地震局地质研究所鲁人齐副研究员,在此一并衷心感谢;感谢匿名审稿人提出的宝贵意见,使得本文更加合理和完善.
Abdrakhmatov K Y, Aldazhanov S A, Hager B H, et al. 1996. Relatively recent construction of the Tien Shan inferred from GPS measurements of present day crustal deformation rates. Nature, 384(6608): 450-453. DOI:10.1038/384450a0 |
Agnew D. 2012. SPOTL: Some Programs for Ocean-Tide Loading. Report, Scripps Institution of Oceanography. http://escholarship.org/uc/item/954322pg.
|
Ainscoe E A, Elliott J R, Copley A, et al. 2017. Blind thrusting, surface folding, and the development of geological structure in the MW6.3 2015 Pishan (China) earthquake.. Journal of Geophysical Research:Solid Earth, 122(11): 9359-9382. DOI:10.1002/2017JB014268 |
Allen M B, Windley B F, Zhang C. 1993. Paleozoic collisional tectonics and magmatism of the Chinese Tien Shan, central Asia. Tectonophysics, 220(1-4): 89-115. DOI:10.1016/0040-1951(93)90225-9 |
Allen M B, Vincent S J, Wheeler P J. 1999. Late Cenozoic tectonics of the Kepingtage thrust zone:interactions of the Tien Shan and Tarim Basin, northwest China. Tectonics, 18(4): 639-654. DOI:10.1029/1999TC900019 |
Avouac J P, Tapponnier P. 1993. Kinematic model of active deformation in central Asia. Geophysical Research Letters, 20(10): 895-898. DOI:10.1029/93GL00128 |
Avouac J P, Tapponnier P, Bai M, et al. 1993. Active thrusting and folding along the northern Tien Shan late Cenozoic rotation of the Tarim relative to Dzungaria and Kazakhstan. Journal of Geophysical Research:Solid Earth, 98(B4): 6755-6804. DOI:10.1029/92JB01963 |
Bernard P, Lyon-Caen H, Briole P, et al. 2006. Seismicity, deformation and seismic hazard in the western rift of Corinth:New insights from the Corinth Rift Laboratory (CRL). Tectonophysics, 426(1-2): 7-30. DOI:10.1016/j.tecto.2006.02.012 |
Canitano A, Hsu Y J, Lee H M, et al. 2015. Near-field strain observations of the October 2013 Ruisui, Taiwan, earthquake:source parameters and limits of very short-term strain detection. Earth, Planets and Space, 67(1): 125. |
Carpenter B M, Marone C, Saffer D M. 2011. Weakness of the San Andreas Fault revealed by samples from the active fault zone. Nature Geoscience, 4(4): 251-254. DOI:10.1038/ngeo1089 |
Charvet J, Shu L S, Laurent-Charvet S, et al. 2011. Paleozoic tectonic evolution of the Tianshan belt, NW China. Science China Earth Sciences, 54(2): 166-184. |
Chuang R Y, Johnson K M, Kuo Y T, et al. 2014. Active back thrust in the eastern Taiwan suture revealed by the 2013 Rueisuei earthquake:evidence for a doubly vergent orogenic wedge?. Geophysical Research Letter, 41(10): 3464-3470. DOI:10.1002/2014GL060097 |
Collettini C, Tesei T, Scuderi M M, et al. 2019. Beyond Byerlee friction, weak faults and implications for slip behavior. Earth and Planetary Science Letters, 519: 245-263. DOI:10.1016/j.epsl.2019.05.011 |
Deng Q D, Zhang P Z, Xu X W, et al. 1996. Paleoseismology of the northern piedmont of Tianshan Mountains, northwestern China. Journal of Geophysical Research:Solid Earth, 101(B3): 5895-5920. DOI:10.1029/95JB02739 |
Doan M L, Brodsky E, Prioul R, et al. 2006. Tidal analysis of borehole pressure: A tutorial. Schlumberger-Doll Research Report, Cambridge, Mass.
|
Fu B H, Lin A M, Kano K I, et al. 2003. Quaternary folding of the eastern Tian Shan, northwest China. Tectonophysics, 369(1-2): 79-101. DOI:10.1016/S0040-1951(03)00137-9 |
Gao J, Li M S, Xiao X C, et al. 1998. Paleozoic tectonic evolution of the Tianshan orogen, northwestern China. Tectonophysics, 287(1-4): 213-231. DOI:10.1016/S0040-1951(97)00211-4 |
Gladwin M T, Hart R. 1985. Design parameters for borehole strain instrumentation. Pure and Applied Geophysics, 123(1): 59-80. DOI:10.1007/BF00877049 |
Gong Z, Jing Y, Li H B, et al. 2019. Static-dynamic strain response to the 2016 M6.2 Hutubi earthquake (eastern Tien Shan, NW China) recorded in a borehole strainmeter network. Journal of Asian Earth Sciences, 183: 103958. DOI:10.1016/j.jseaes.2019.103958 |
Gu G X, Lin T H, Shi Z L. 1989. Catalogue of Chinese Earthquakes (1831 BC-1969 AD). Li Z Q, trans. Beijing: Science Press.
|
Guan S W, Stockmeyer J M, Shaw J H, et al. 2016. Structural inversion, imbricate wedging, and out of sequence thrusting in the southern Junggar fold and thrust belt, northern Tian Shan, China. AAPG Bulletin, 100(9): 1443-1468. DOI:10.1306/04041615023 |
Hart R H G, Gladwin M T, Gwyther R L, et al. 1996. Tidal calibration of borehole strain meters:removing the effects of small-scale inhomogeneity. Journal of Geophysical Research:Solid Earth, 101(B11): 25553-25571. DOI:10.1029/96JB02273 |
He X L, Li H B, Wang H, et al. 2018. Creeping along the Guanxian-Anxian fault of the 2008 MW7.9 Wenchuan earthquake in the Longmen Shan, China. Tectonics, 37(7): 2124-2141. DOI:10.1029/2017TC004820 |
He Z Y, Zhang Z M, Zong K Q, et al. 2012. Zircon geochronology of Xingxingxia quartz dioritic gneisses:implications for the tectonic evolution and Precambrian basement affinity of Chinese Tianshan orogenic belt. Acta Petrologica Sinica (in Chinese), 28(6): 1857-1874. |
Hickman S, Sibson R, Bruhn R. 1995. Introduction to special section:mechanical involvement of fluids in faulting. Journal of Geophysical Research:Solid Earth, 100(B7): 12831-12840. DOI:10.1029/95JB01121 |
Hodgkinson K, Langbein J, Henderson B, et al. 2013. Tidal calibration of plate boundary observatory borehole strainmeters. Journal of Geophysical Research:Solid Earth, 118(1): 447-458. DOI:10.1029/2012JB009651 |
Langbein J. 2015. Borehole strainmeter measurements spanning the 2014 MW6.0 South Napa Earthquake, California:the effect from instrument calibration. Journal of Geophysical Research:Solid Earth, 120(10): 7190-7202. DOI:10.1002/2015JB012278 |
Li T, Chen Q C, Ouyang Z X, et al. 2011. Application of the RZB Borehole strainmeter in crustal stress observation at the eastern margin of the Tibet Plateau. Acta Scientiarum Naturalium Universitatis Pekinensis (in Chinese), 47(4): 677-683. |
Li Z, Peng S T. 2013. U-Pb geochronological records and provenance system analysis of the Mesozoic-Cenozoic sandstone detrital zircons in the northern and southern piedmonts of Tianshan, Northwest China:Responses to intracontinental basin-range evolution. Acta Petrologica Sinica (in Chinese), 29(3): 739-755. |
Lin A M, Fu B H, Kano K I, et al. 2002. Late Quaternary right-lateral displacement along active faults in the Yanqi basin, southeastern Tian Shan, northwest China. Tectonophysics, 354(3-4): 157-178. DOI:10.1016/S0040-1951(02)00288-3 |
Lin J, Stein R. 2004. Stress triggering in thrust and subduction earthquakes and stress interaction between the southern San Andreas and nearby thrust and strike-slip faults. Journal of Geophysical Research:Solid Earth, 109(B2): B02303. DOI:10.1029/2003JB002607 |
Liu G, Qiao X J, Xiong W, et al. 2017. Source models for the 2016 MW6.0 Hutubi earthquake, Xinjiang, China:A possible reverse event. Geodesy and Geodynamics, 8(5): 311-318. DOI:10.1016/j.geog.2017.05.005 |
Liu X Y, Wang Z Y, Fang H F, et al. 2014. Analysis of 4-component borehole strain observation based on strain invariant. Chinese Journal of Geophysics (in Chinese), 57(10): 3332-3346. DOI:10.6038/cjg20141020 |
Lu R Q, Xu X W, He D F, et al. 2016. Coseismic and blind fault of the 2015 Pishan MW6.5 earthquake:implications for the sedimentary-tectonic framework of the western Kunlun Mountains, northern Tibetan Plateau. Tectonics, 35(4): 956-964. DOI:10.1002/2015TC004053 |
Lu R Q, He D F, Xu X W, et al. 2017. Seismotectonics of the 2016 M6.2 Hutubi earthquake:implications for the 1906 M7.7 Manas earthquake in the northern Tian Shan Belt, China.. Seismological Research Letters, 89(1): 13-21. DOI:10.1785/0220170123 |
Manga M, Wang C Y. 2015. Earthquake hydrology. Treatise on Geophysics. 2nd ed. Oxford: Elsevier, 305-328.
|
Melnick D, Moreno M, Motagh M, et al. 2012. Splay fault slip during the MW8.8 2010 Maule Chile earthquake. Geology, 40(3): 251-254. |
Molnar P, Tapponnier P. 1975. Cenozoic tectonics of Asia:effects of a continental collision. Science, 189(4201): 419-426. DOI:10.1126/science.189.4201.419 |
Molnar P, Deng Q D. 1984. Faulting associated with large earthquakes and the average rate of deformation in central and eastern Asia. Journal of Geophysical Research:Solid Earth, 89(B7): 6203-6227. DOI:10.1029/JB089iB07p06203 |
Molnar P, Brown E, Burchfiel B, et al. 1994. Quaternary climate change and the formation of river terraces across growing anticlines on the north flank of the Tien Shan, China. The Journal of Geology, 102(5): 583-602. DOI:10.1086/629700 |
Molnar P, Ghose S. 2000. Seismic moments of major earthquakes and the rate of shortening across the Tien Shan. Geophysical Research Letters, 27(16): 2377-2380. DOI:10.1029/2000GL011637 |
Nelson M R, McCaffrey R, Molnar P. 1987. Source parameters for 11 earthquakes in the Tien Shan, Central Asia, determined by P and SH waveform inversion. Journal of Geophysical Research:Solid Earth, 29(B12): 12629-12648. |
Okada Y. 1992. Internal deformation due to shear and tensile fault in a half-space. Bulletin of the Seismological Society of America, 92(2): 1018-1040. |
Ouyang Z X, Zhang Z R, Shu G L. 2004. Review and outlook for west China Borehole strainmeter networks. Chinese Journal of Rock Mechanics and Engineering (in Chinese), 23(23): 4058-4062. |
Ouyang Z X, Zhang H X, Fu Z Z, et al. 2009. Abnormal phenomena recorded by several earthquake precursor observation instruments before the MS8.0 Wenchuan, Sichuan Earthquake. Acta Geologica Sinica, 83(4): 834-844. DOI:10.1111/j.1755-6724.2009.00106.x |
Qiu Z H, Shi Y L. 2003. Observations of remote coseismic stress step-changes. Science in China Series D:Earth Sciences, 46(S2): 75-81. |
Qiu Z H, Shi Y L, Ouyang Z X. 2005. Relative in-situ calibration of 4-component Borehole strain observation. Journal of Geodesy and Geodynamics (in Chinese), 25(1): 118-122. |
Qiu Z H, Tang L, Zhang B H, et al. 2013. In situ calibration of and algorithm for strain monitoring using four-gauge borehole strainmeters (FGBS). Journal of Geophysical Research:Solid Earth, 118(4): 1609-1618. DOI:10.1002/jgrb.50112 |
Roeloffs E. 2010. Tidal calibration of plate boundary observatory borehole strainmeters:roles of vertical and shear coupling. Journal of Geophysical Research:Solid Earth, 115(B6): B06405. DOI:10.1029/2009JB006407 |
Scholz C H. 2002. The Mechanics of Earthquakes and Faulting. 2nd ed. Cambridge: Cambridge University Press.
|
Çengör A M C, Natal'in B A, Burtman V S. 1993. Evolution of the Altaid collage and Palaeozoic crustal growth in Eurasia. Nature, 364(6435): 299-207. DOI:10.1038/364299a0 |
Shen Z K, Wang M, Li Y X, et al. 2001. Crustal deformation along the Altyn Tagh fault system, western China, from GPS. Journal of Geophysical Research:Solid Earth, 106(21): 30607-30621. |
Singh S C, Hananto N D, Chauhan A P S. 2011. Enhanced reflectivity of backthrusts in the recent great Sumatran earthquake rupture zones. Geophysical Research Letters, 38(4): L04302. DOI:10.1029/2010GL046227 |
Stagpoole V, Nicol A. 2008. Regional structure and kinematic history of a large subduction back thrust:Taranaki Fault, New Zealand. Journal of Geophysical Research:Solid Earth, 113(B1): B01403. DOI:10.1029/2007JB005170 |
Sun J M, Zhang Z Q. 2009. Syntectonic growth strata and implications for late Cenozoic tectonic uplift in the northern Tian Shan, China. Tectonophysics, 463(1-4): 60-68. DOI:10.1016/j.tecto.2008.09.008 |
Toda S, Stein R S, Richards-Dinger K, et al. 2005. Forecasting the evolution of seismicity in southern California:animations built on earthquake stress transfer. Journal of Geophysical Research:Solid Earth, 110(B5): B05S16. DOI:10.1029/2004JB003415 |
USGS. 2016. Source parameters for the 2016 MW6.0 earthquake, 58 km SSE of Shihezi. https: //earthquake.usgs.gov/earthquakes/eventpage/us20007z2r#executive.
|
Wang B, Faure M, Shu L S, et al. 2008. Paleozoic tectonic evolution of the Yili Block, Western Chinese Tianshan. Bulletin de la Société Géologique de France, 179(5): 483-490. DOI:10.2113/gssgfbull.179.5.483 |
Wang C Y, Zhang Z, Luo H, et al. 2004. Crustal structure of the northern margin of the eastern Tien Shan, China, and its tectonic implications for the 1906 M~7.7 Manas earthquake. Earth and Planetary Science Letters, 233(1-2): 187-202. |
Wang X H, Xu C J, Wen Y M, et al. 2019. The 2016 MW6.0 Hutubi earthquake:A blind thrust event along the northern Tian Shan front. Journal of Asian Earth Sciences, 173: 79-87. DOI:10.1016/j.jseaes.2019.01.011 |
Wells D L, Coppersmith K J. 1994. New empirical relationships among magnitude, rupture length, rupture width, rupture area, and surface displacement. Bulletin of the Seismological Society of America, 84(4): 974-1002. |
Xiao W J, Zhang L C, Qin K Z, et al. 2004. Paleozoic accretionary and collisional tectonics of the Eastern Tianshan (China):implications for the continental growth of central Asia. American Journal of Science, 304(4): 370-395. DOI:10.2475/ajs.304.4.370 |
Xu S Q, Fukuyama E, Ben-Zion Y, et al. 2015. Dynamic rupture activation of backthrust fault branching. Tectonophysics, 644-645: 161-183. DOI:10.1016/j.tecto.2015.01.011 |
Xue C J, Zhao X B, Mo X X, et al. 2014. Tectonic-Metallogenic Evolution of Western Tianshan Giant Au-Cu-Zn-Pb Metallogenic Belt and Prospecting orietation. Acta Geologica Sinica (in Chinese), 88(12): 2490-2531. |
Xue L, Li H B, Brodsky E E, et al. 2013. Continuous permeability measurements record healing inside the Wenchuan earthquake fault zone. Science, 340(61410): 1555-1559. |
Zhang Y, Wang C Y, Fu L Y, et al. 2017. Mechanism of the coseismic change of volumetric strain in the far field of earthquakes. Bulletin of the Seismological Society of America, 107(1): 475-481. DOI:10.1785/0120160253 |
Zhang Y, Wang C Y, Fu L Y, et al. 2019. Unexpected far-field hydrological response to a great earthquake. Earth and Planetary Science Letters, 519: 202-212. DOI:10.1016/j.epsl.2019.05.007 |
Zubovich A V, Wang X Q, Scherba Y G, et al. 2010. GPS velocity field for the Tien Shan and surrounding regions. Tectonics, 29(6): TC6016. DOI:10.1029/2010TC002772 |
国家地震局地球物理研究所. 1980.新编地震走时表.北京: 地震出版社.
|
贺振宇, 张泽明, 宗克清, 等. 2012. 星星峡石英闪长质片麻岩的锆石年代学:对天山造山带构造演化及基底归属的意义. 岩石学报, 28(6): 1857-1874. |
IGP-CEA, 2016. 2016年12月8日新疆呼图壁6.2级地震(第二版). http://www.cea-igp.ac.cn/tpxw/275170.html.
|
李涛, 陈群策, 欧阳祖熙, 等. 2011. RZB型钻孔应变仪在青藏高原东缘地应力监测中的应用. 北京大学学报(自然科学版), 47(4): 677-683. |
李忠, 彭守涛. 2013. 天山南北麓中-新生界碎屑锆石U-Pb年代学记录、物源体系分析与陆内盆山演化. 岩石学报, 29(3): 739-755. |
刘序俨, 王紫燕, 方宏芳, 等. 2014. 对当前四分量钻孔应变观测的审视——以应变不变量为标尺. 地球物理学报, 57(10): 3332-3346. DOI:10.6038/cjg20141020 |
马瑞士, 王赐银, 叶尚夫. 1993. 东天山构造格架及地壳演化. 南京: 南京大学出版社: 131-150.
|
马瑞士, 舒良树, 孙家齐. 1997. 东天山构造演化与成矿. 北京: 地质出版社: 11-202.
|
欧阳祖熙, 张宗润, 舒桂林. 2004. 中国西部钻孔应变仪台网工作回顾与前瞻. 岩石力学与工程学报, 23(23): 4508-4062. |
邱泽华, 石耀霖. 2003. 地震造成远距离应力阶变的观测实例. 中国科学(D辑), 33(S1): 60-64. |
邱泽华, 石耀霖, 欧阳祖熙. 2005. 四分量钻孔应变观测的实地相对标定. 大地测量与地球动力学, 25(1): 118-12. |
薛春纪, 赵晓波, 莫宣学, 等. 2014. 西天山巨型金铜铅锌成矿带构造成矿演化和找矿方向. 地质学报, 88(12): 2490-2531. |