2. 中国气象科学研究院灾害天气国家重点实验室, 北京 100081
2. State Key Laboratory of Severe Weather, Chinese Academy of Meteorological Sciences, Beijing 100081, China
南极是地球气候系统的重要组成部分,对气候变化具有强烈的响应和反馈.作为地球上最重要的两大冷源之一,南极影响着全球大气环流,且通过海冰、冰盖变化和臭氧损耗等过程在全球气候系统中发挥着至关重要的作用(White et al., 1996; Goelzer et al., 2011; Thompson et al., 2011).在气候变化的背景下南极的大气温度正在发生重大变化,这种变化直接与南极臭氧损耗和温室气体增加导致的大气环流变化有关(Doran et al., 2002; Turner et al., 2005).鉴于南极在全球气候系统的重要性,在南极大陆及周边海冰区进行气候变化长期监测是一项具有科学意义和紧迫性的任务(IPCC, 2013).臭氧是大气中重要的痕量气体,由于对太阳紫外辐射的吸收作用,大气臭氧一方面保护了地球生物圈,同时它也是平流层的主要热源,直接影响着全球气候系统和生态系统(Solomon, 1999; Randel and Wu, 1999; Bandoro et al., 2014).由于氟利昂等人造化合物的破坏和南极地区自身特殊的气象条件,极区臭氧时空分布变化相较于其他地区更加剧烈(Solomon et al., 1986; 王卫国等, 2006; 施春华等, 2010; 刘年庆等, 2011; 王维和等, 2011).南极地区的高空气象观测资料大多通过极轨卫星、GPS无线电掩星观测和无线电探空来获取.但由于南极恶劣的自然环境,在南极进行现场观测十分具有挑战性.目前,南极16个业务化地面无线电探空站中除Amundsen-Scott站地处南极点外,其余站点皆位于沿海,这使得南极内陆深处高原地区的探空资料相对匮乏(Wang et al., 2013).同时,探空仪的精度在低温低湿的条件下也会受到影响(Hudson et al., 2004; Rowe et al., 2008).考虑到极地区域观测资料稀少,因此在这些地区进行天气预报和气候研究会更多地依赖卫星数据.
卫星遥感的优势在于观测区域大、时效快且参数多,借助于卫星资料可以弥补极地地区常规观测资料的不足,实现对南极天气气候和陆面过程的多源观测.卫星红外高光谱遥感的发展弥补了传统卫星大气垂直探测的不足,越来越多的应用于极地天气和气候的研究中(Boisvert et al., 2015, 2016).大气红外探测仪(AIRS, Atmospheric InfraRed Sounder)是搭载在美国地球观测系统(EOS, Earth Observing System)Aqua卫星平台上的高光谱红外探测器,它采用光栅分光,在3.7~15.4 μm的热红外区共有2378个连续的光谱通道,光谱分辨率可达1200(λ/Δλ),红外波段的星下点分辨率为13.5 km,垂直分辨率为1 km.Aqua卫星每天在中纬度地区任意位置过境两次,过境当地时间分别为上午1:30和下午的1:30左右(Aumann et al., 2003),但在极地高纬度过境次数远高于两次.在南北极,每天过境的次数会随纬度增加而增加,卫星在70°S以南区域每日过境可达到8次之多.由于卫星在极地过境次数多的优势, 容易找到与探空相匹配的AIRS资料.自2002年9月开始正常运行以来,AIRS已成为了新一代主流极轨大气垂直探测系统,为气候学和气象学研究以及改善数值天气模式提供更加精细化的全球三维大气观测资料(Goldberg et al., 2003; Chahine et al., 2006; Pavelin et al., 2008).2013年1月AIRS发布了第六版数据产品(AIRS-v6),相较于第五版(AIRS-v5)显著改进了晴空订正算法且引进了一种基于神经网络计算初始猜值的方法,同时新增了质量控制标志旗和测值不确定度等参数(Blackwell, 2012; Susskind et al., 2014).
尽管AIRS的验证对比工作在全球范围内已经广泛开展(姚志刚等,2015;洪军等,2015; 符传博等, 2018),但在不同的对比工作中,比较结果往往存在一定差异:Diao等(2013)利用飞机观测数据对地面到上对流层-下平流层(Upper Troposphere-Lower Stratosphere,UT-LS)高度的AIRS温度产品进行了验证,发现温度反演的误差为1~2.5 K,卫星反演温度在边界层内低于飞机观测值,在UT-LS区域高于飞机观测值;Boylan等(2015)利用Concordiasi数据集对AIRS温度资料在南极的精度进行了讨论,发现AIRS数据在对流层存在一个0.5 ℃的冷偏差.Feltz等(2017)对AIRS平流层温度产品进行了评估,发现AIRS-v6二级温度产品在南极冬季存在“垂直振荡”,且在热带平流层中部35 hPa附近存在一个较小的暖误差.关于AIRS臭氧产品的验证工作,Bian等(2007)使用北京GPSO3臭氧探空廓线与AIRS-v4臭氧反演进行对比,发现AIRS与GPSO3的测量在UT-LS区域具有很高的一致性,误差大多保持在10%以内.Pittman等(2009)利用飞机观测与AIRS-v5臭氧反演的比较结果也显示,AIRS能够很好的捕捉到对流层顶附近的臭氧梯度.探空观测点在全球分布不均匀会在一定程度上影响比较结果,由于缺少现场观测的高空数据,AIRS卫星反演在南极尤其是南极内陆难以得到较好的订正,Wang等(2013)发现卫星温度反演在南极地区普遍低于探空观测,且南极内陆的误差要大于海岸和海面.按照纬度进行大致划分得到的结果只能表现出反演误差的系统特征(Divakarla et al., 2006; Tobin et al., 2006),而一些特殊区域的误差分布情况往往会在统计过程中被平滑掉,例如在高原地区卫星红外反演精度会受到地形因素和海拔的影响(Gao et al., 2008; Zhan and Li, 2008; Zhang et al., 2011).
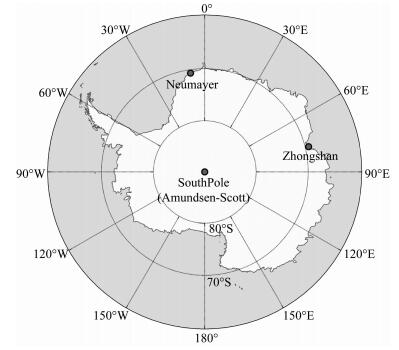
1 数据和方法本研究使用2008年南极中山、Neumayer和SouthPole三站全年的温度臭氧探空数据和与之同步的AIRS卫星产品.其中中山站数据由中国第25次越冬队在国际极地年(IPY)期间开展大气温度和臭氧的探空实验获取,Neumayer和SouthPole站数据来自世界臭氧和紫外辐射数据中心(World Ozone and Ultraviolet Radiation Data Centre, WOUDC)(https://woudc.org/data/explore.php?lang=en).中国南极中山站位于东南极普利兹湾沿岸(69.35°S,76.35°E),在2008年共进行54次臭氧探空实验,其中50次数据可用;德国Neumayer站位于南极大西洋扇区Ekström冰架上(70.65°S,8.26°W),共计68次探空可用;SouthPole站位于南极内陆中心区(90°S,169°E),在2008年共有66次探空;三站的位置如图 1所示.探空资料在进行对比前都已经通过质量控制,确保了数据的准确性.
|
图 1 2008年IPY期间南极臭氧探空三站点(圆圈)图 Fig. 1 Locations of the three radiosonde stations (circles) during the 2008 International polar year (IPY) campaign |
使用Vaisala RS80型无线电探空仪测量不同高度上的气温、相对湿度、气压以及飞行过程中的GPS定位,然后将所有实测数据仪器一并发回地面.这种探空仪与南极业务探空站使用的Vaisala RS92精度相当,根据WMO 2010年探空仪对比实验的结果,从地面到高空100 hPa处的温度探测精度为0.3 ℃,从100 hPa到10 hPa探测精度为0.6 ℃(Nash et al., 2010).探空仪的响应时间和升速都会随高度而变化,探空温度数据在地表附近和100 hPa处高空的垂直分辨率分别约为5 m和30 m(Hudson et al., 2004).大气臭氧探测使用美国EN-SCI的ECC-2Z型电化学臭氧探空仪,它是根据臭氧与KI溶液发生电化学反应来确定大气臭氧浓度,根据JOSIE对比实验的结果,其测量不确定度为3%~5%,到30 km以上上升到5%~10% (Smit et al., 2007).本研究所用AIRS-v6二级辅助产品(AIRX2SUP)资料,每天共240景,资料包含详细的质量评价信息(QC_flag),以0, 1, 2分别表示数据质量优良、可用和无法使用,本研究剔除了无法使用的数据.数据详细说明及下载参考:https://disc.gsfc.nasa.gov/.
卫星产品在不同区域和时间的精度存在差异,此外不同的数据处理方法也会对比较结果产生影响(Zhang et al., 2010; Verhoelst et al., 2015).同一景AIRS产品相邻的像元之间具有连续性,因此本文在比较时只使用一景数据中空间和时间上与探空最接近的一个像元.Aqua卫星在高纬度地区轨道较为密集,同一次探空可能匹配多景的卫星数据,这使得我们能够使用多个相互独立的AIRS廓线与同一探空廓线进行对比,扩大了用于进行对比分析的样本数量.探空仪从地面上升到高空存在时间滞后,且上升过程中会产生水平位置的漂移,这种时空差异会影响两种观测结果的一致性.在比较时设置不同的阈值也会对结果造成影响,Diao等(2013)通过讨论不同时空窗口下对比结果的差异,建议在进行AIRS资料对比时时间和空间间隔应分别在4 h和100 km以内,以保证时空差异带来的误差在10%以内.Sun等(2010)在进行卫星和无线电探空资料对比时发现,温度偏差会随着距离和时间差异增加而增加,最大可达到6 h和300 km.NOAA产品订正系统(NPROVS)在匹配探空廓线和AIRS卫星反演时的标准为时间间隔不超过±6 h,水平距离250 km以内(Reale et al., 2012).本研究通过设置不同的时空窗口大小,发现当空间差异保持在100 km以内,时间间隔在3 h以内时,样本数较多且误差可控.综上本文选择探空站距离在100 km以内,与探空时间相隔3 h以内的AIRS过境点与探空数据相匹配.臭氧探空的垂直分辨率在100~400 m左右,这是由仪器的响应时间和气球升速来确定的.水平分辨率为50 km,垂直方向上(1100~0.02 hPa)分为100个气压层,气压层的间隔在地面约为250 m,而在上对流层附近就已经超过600 m,故探空的垂直分辨率要高于卫星资料的垂直分辨率.为了用探空资料验证卫星资料时必须降低探空仪垂直分辨率.探空数据是对大气参数进行直接探测,该测值仅反映该高度或气压层大气的真实状态,与该高度上下相邻气压层是相互独立的(Conrath, 1972; Backus and Gilbert, 1970).尽管拉格朗日线性插值法已经被广泛的用于卫星廓线产品的验证工作中,但线性插值法得到的降分辨率的探空廓线与AIRS廓线的比较是假设卫星产品在各高度上的数据是彼此独立的.实际上卫星在反演具体某高度气象参数时考虑了不同气压层的权重贡献,且这个过程不是线性的,这种现象在测值(包括水汽、温度和臭氧)垂直梯度较大区域(如UT-LS)尤为明显(Yan et al., 2016; Shi et al., 2017).故在对探空廓线进行降分辨率平滑的过程中,不仅需考虑遥感测值预设的气压高度层,同时应该引入卫星反演算法中的平均核函数及先验廓线.AIRS是将获得的测量原始数据(即Level 1a产品)转换为红外辐射值(Level 1a产品)用于反演多种大气物理参数,在反演计算过程中引入了先验的平均态函数与先验廓线来对基于辐射计算的结果进行约束.为了使遥感廓线反演值和相应的探空观测或现场飞机观测廓线具有可比性,本文使用了平均核函数将分辨率较高的探空观测数据平滑到低分辨率的AIRS廓线预设的气压层上.
在随后的比较中,本文对从地表到高空10 hPa的AIRS产品精度进行评估.本文选择AIRS廓线与探空观测的空间距离在100 km以内,时间间隔在3 h以内.探空观测垂直分辨率要高于卫星资料,在进行资料对比前必须降低探空资料的垂直分辨率.本文采用平均核函数平滑法降低高垂直分辨率的原始探空数据以匹配到AIRS温度廓线产品预设的气压高度用来检验其精度.平均核函数代表了AIRS观测对真实大气状态变化的敏感性(Rodgers and Connor, 2003;Menke,1984),定义为

|
(1) |
其中
通过如下的数学过程加权平均到100层的AIRS气压层上:

|
(2) |

|
(3) |
对于温度廓线:

|
(4) |
对于水汽和臭氧廓线:

|
(5) |
其中Xk表示考虑传感器对真实大气廓线的灵敏度、先验廓线和仪器垂直分辨率后将会得到的AIRS廓线,X0是AIRS预设气压层上先验的初估值廓线,v6的先验廓线是基于欧洲中尺度天气预报中心再分析资料通过神经网络拟合得到,XT是线性插值得到的探空廓线.平均核函数A是一个n×n的权重函数矩阵,它储存在AIRS二级辅助产品中,其具体参数由AIRS产品的版本决定.平均核函数是不同高度上辐射贡献的权重函数,它决定了来自一定高度范围内大气红外辐射总量,反映了卫星探测某个高度的辐射值与该高度所处的高度层之间的关系(Maddy and Barnet, 2008; Rodgers and Connor, 2003).核函数矩阵的对角元素表征了反演廓线中所包含的独立信息量的多少,被称为信号自由度.T是AIRS反演所采用的梯形矩阵,梯形矩阵的大小由AIRS反演中气压层的数量决定,具体设置方法参见(Susskind et al., 2003),T′是
T的最小二乘解.由于不同版本AIRS产品所采用的平均核函数不同,因此不同版本的反演结果也不同.方程(4)、(5)中除XT来自于探空数据外,其余所有参数都由AIRS数据组直接提供.
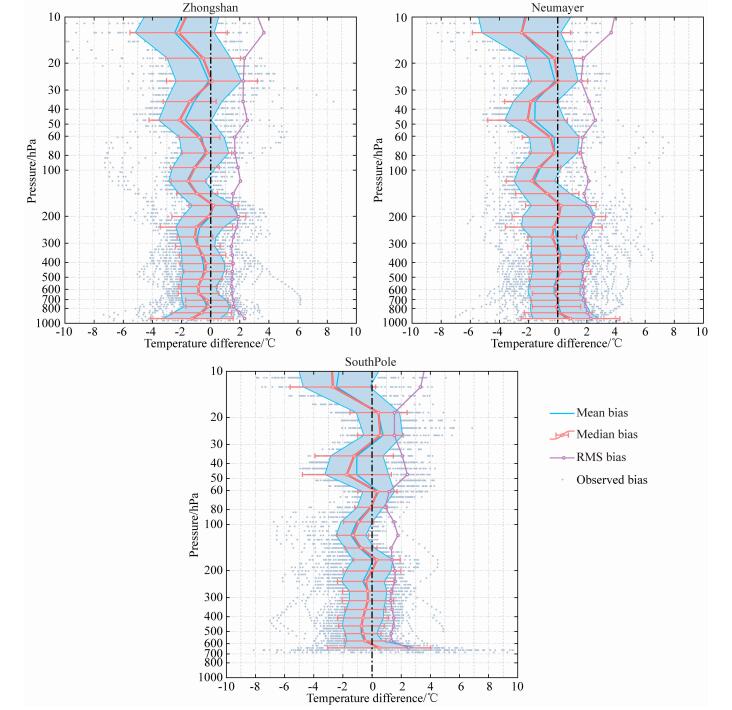
2 结果分析 2.1 温度图 2给出了三个站点AIRS反演温度相对于RS92探空温度测量结果的详细比较情况,采用绝对误差衡量温度的对比情况,定义如(6)式所示,单位为℃.
|
图 2 AIRS-v6相对于RS80和RS92的平均误差、误差中位数和均方根误差 蓝色阴影部分代表平均误差标准差的两倍,红色误差棒代表四分位差,每一组误差廓线的结果用浅蓝色点表示. Fig. 2 Mean, median and root mean square biases for AIRS-v6 temperature profiles relative to RS80 and RS92 temperature profiles Uncertainty bounds on the mean bias (blue shaded envelope bounded by thin blue lines) represent twice the standard error of the mean, while error bars on the median bias (red error bars) indicate the interquartile range (IQR). Results for individual profiles are shown as pearl blue points. |

|
(6) |
其中xA(p)为给定气压层AIRS的反演值,而xs(p)为卷积到该气压层上的探空观测值.图中蓝色细线代表平均误差(Mean Bias,MB),平均误差的不确定度范围(蓝色阴影)为平均误差标准差的两倍,中值误差(红线)的误差棒表示四分位差,均方根误差(Root Mean Square error,RMSe)用紫色实线表示,单次观测的误差廓线结果用灰色点表示.AIRS第六版温度产品的平均误差垂直分布变化在三个站点的不同高度比较一致,AIRS产品总体上低于探空值.AIRS温度相对于核函数处理后探空测值(kerned sonde)的MB在所有气压层上的平均值为-0.59 ℃(中山站-0.79 ℃,Neumayer站-0.44 ℃,SouthPole站-0.55 ℃),平均RMSe为1.88 ℃(中山站-1.85 ℃,Neumayer站2.09 ℃,SouthPole站1.71 ℃).60 hPa以下的RMSe在中山站低于2 ℃;在Neumayer站略大,在200 hPa以下小于2 ℃,从200~40 hPa左右RMSe逐渐增加到2 ℃左右;RMSe在SouthPole站最小,特别是在100 hPa以下平均约为1.5 ℃.800 hPa以下的RMSe也在2 ℃左右,但要高于对流层中其他区域.
在100 hPa以上误差明显增大且分布更为离散,甚至到10 hPa左右RMSe接近4 ℃,而下投式探空对比结果在该区域没有出现较大的误差(Boylan et al., 2015),造成这种现象的原因可能是探空气球在高空发生了较大的水平漂移.另一方面,探空仪的辐射误差大小会随着高度的升高而上升,尽管RS92已采用了先进的防辐射工艺和辐射订正算法(Steinbrecht et al., 2008; 冒晓莉等,2014).300 hPa以下MB和RMSE都相对较小(RMSE在2 ℃左右),到近地面处误差水平又有所上升.值得注意的是,在200~300 hPa之间有一个标准差较大的区域,这个特点在中山站和Neumayer这两个海岸站尤为显著.Boylan等(2015)讨论了下垫面类型对AIRS反演可能的影响,发现在积雪下垫面的区域AIRS温度最大偏差出现在200 hPa左右.冰雪下垫面影响200~300 hPa温度反演的机制可通过模式模拟来进一步研究,由于200~300 hPa是对流层向平流层过渡区,大气运动具有不连续性(特别是水汽),这涉及到红外遥感对水汽的变化是否敏感.因此AIRS温度反演精度在200~300 hPa的不确定性是由多种因素造成,有待于深入研究.位于内陆的SouthPole站AIRS温度在近地面偏高,可能是受到高原地形因素的影响导致卫星的反演算法在该处更为复杂且误差更大.Wang等(2013)报道了AIRS-v5相对于下投式探空存在一个平均大小为2 ℃的冷偏差,这个偏差受到下垫面类型、海拔高度和“云污染”的影响.在海冰下垫面的近地面附近(850 hPa以下),AIRS-v5存在一个随高度降低而增加的暖偏差,这种低层暖偏差在太平洋中部的飞机观测数据对比中也曾出现,且偏差大小随总云量增加而变大(Diao et al., 2013).由于AIRS-v6在地表发射率和云反演算法上的提高,AIRS-v6的偏差随下垫面变化的程度不如AIRS-v5明显,受云的影响程度也较小.尽管AIRS-v6在精度上有所提高,但仍然存在一个统计显著的冷偏差,造成这种偏差的原因还需要进一步分析.
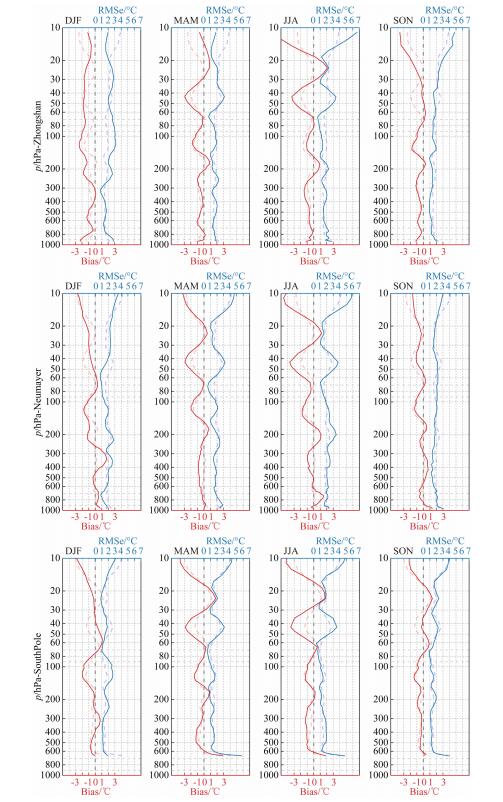
图 3讨论温度误差廓线在不同季节的变化情况,可以看出误差廓线在不同的季节存在一定差异.从对流层低层到平流层上层,卫星反演与探空值之间的偏差呈逐渐增大趋势,除平流层上层外,其余位置均方根误差大小保持在3 K内.在大气中200 hPa以下高度,误差廓线在各季节变化不大,误差平均值总体是在零点附近振荡(中山站、Neumayer站和SouthPole站分别为-0.65 ℃,0.02 ℃,-0.41 ℃),均方根误差在春季最小约为1 ℃左右,其次是夏季,秋冬季相对较大但也保持在2 ℃左右.200 hPa以上偏差有所加大但也不超过3 ℃,到大气上部100~30 hPa,误差廓线基本上可分为“秋冬型”和“春夏型”.在秋冬季节,误差大小呈现出明显的先增加后减小的上下振荡趋势,振荡的两个极值点分别在80 hPa和40 hPa附近.而在春夏季误差廓线呈现出较为平稳的变化趋势,误差大小总体上表现为逐渐增大趋势.中山站平流层上层冬春季的均方根误差为明显的正距平(Neumayer站为冬季),而南极点站这一高度的均方根误差在四个季节的变化规律及大小都较为一致.这可能是由于东西南极沿海在这些时间段内平流层温度场水平分布梯度增大,同时也有可能是平流层风速增强导致探空仪漂移更远.卫星产品与探空总体上呈现出较高的一致性,且随高度上升而增大,只有在SouthPole站的近地面处一致性略低,说明AIRS对流层温度产品在南极沿岸地区的反演精度要优于南极中心内陆地区.
|
图 3 各季节温度平均误差和均方根误差随高度的变化情况 红色实线为季节平均误差廓线,蓝色实线为季节均方根误差廓线,红色虚线和蓝色虚线分别代表平均误差和均方根误差的年平均值. Fig. 3 Temperature mean biases (red solid line) and root mean square biases (blue solid line) as a function of height for each season The red and blue dashed lines represent the annual average of the mean biases and the root mean square biases. |
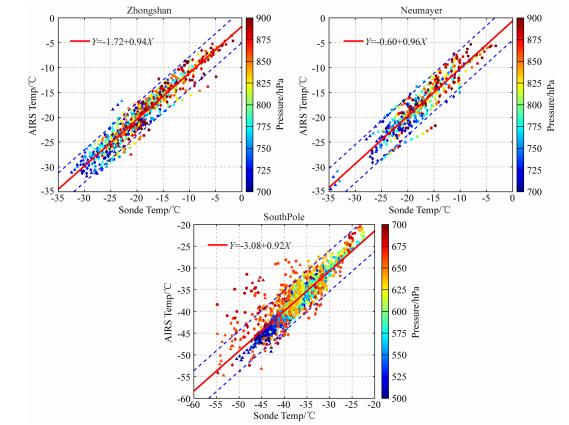
由图 3的分析可知,AIRS温度产品在近地面处(尤其是在SouthPole站)具有较大误差,为了分析造成误差的原因,本文进一步讨论了AIRS温度产品在近地面附近的精度(图 4).选取每个站点从地面到离地面2000 m高度的气压层进行统计,即中山站和Neumayer的900~700 hPa高度,由于南极点站的海拔较高,故选择700~500 hPa高度.可以看出,AIRS产品和探空测量的一致性在海岸站要明显高于内陆的SouthPole站.这种一致性在不同的季节是变化的(暨具有季节差异),一般而言,各站点在秋冬季的一致性要低于春夏季.下垫面类型对近地面气层AIRS温度反演的影响是明显的,且距离地面越近受到的影响越大.南极地区气温极端寒冷,且云与地表(积雪)在红外波段的对比度较低,这些因素导致了AIRS提取的南极边界层低层大气精细垂直结构信息存在局限性.Boylan等(2015)的比较表明,在海拔较高的地区AIRS温度测值高于探空,且随海拔升高这种暖偏差的幅度会变大;在空间上,AIRS近地面气温产品在南极大陆存在暖偏差(2.48 ℃),而在海冰区为冷偏差(-1.29 ℃).Hearty等(2014)发现AIRS-v5在南极海平面气压处存在超过2 ℃暖偏差,而在高度超过700 hPa的地区测值偏冷,Dong等(2010)发现在南大洋开放水域AIRS-v5温度产品通常比现场走航观测结果偏冷(-2.03 ℃).
|
图 4 AIRS温度产品与探空温度测量在近地面(地面到2 km左右)线性回归方程 散点分别表示夏季(方块)、秋季(圆圈)、春季(三角)和冬季(菱形)的温度测值,红色直线表示该站点的回归情况,各测值的高度用填色表示. Fig. 4 The linear regression equation of AIRS and sounding temperature measurement in the near-surface (ground to 2 km) The scatter points represent the temperature measurements in summer (squares), autumn (circles), spring (triangles), and winter (diamonds), and the red lines indicate the regression of the site. The heights of the measurements are indicated by color filling. |
本节给出AIRS臭氧反演与ECC臭氧探空的对比结果,比较时采用相对误差衡量臭氧的对比情况,定义如(7)式所示,单位为%.

|
(7) |
其中xA(p)为AIRS在特定气压层的混合比反演值,而xs(p)为ECC探空观测值降低分辨率后在该气压层上的值.
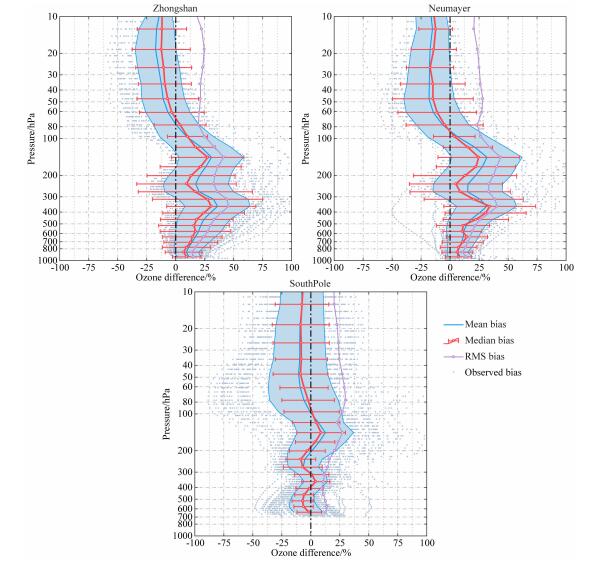
图 5给出了三个站点AIRS-v6相对于ECC探空臭氧观测结果的详细比较情况.RMSe在100 hPa高度以上约为25%,100 hPa以下达到30%,部分区域甚至超过40%,虽然AIRS反演对流层臭氧误差较大,但由于大气臭氧主要集中在平流层,对流层臭氧分压较小,因此误差对于描述大气臭氧总量变化影响较小.中山站和Neumayer两个海岸站的误差分布情况较为一致,在80 hPa以下,AIRS-v6臭氧产品整体高于探空值,误差在150 hPa和350 hPa附近达到峰值,均方根误差最大可达40%;350 hPa以下相对误差逐渐减小,到地面处误差降到10%左右且离散度也减小到较小水平.在高空80 hPa以上,各站点的AIRS臭氧产品均低于探空值,且均方根误差和标准差变化很小,三站点的误差分布呈现出较为一致的规律.位于内陆的SouthPole站在对流层中没有明显高估ECC探空测值,其相对误差从地面到高空均保持在较低水平.200 hPa到地面,相对误差平均在±10%以内;200~100 hPa卫星反演高估了探空测值10%左右;在100 hPa以上,AIRS与ECC的相对误差为负值,大小在10%以内.AIRS产品对于不同站点处对流层臭氧的精度差异反映了下垫面对AIRS反演产品准确度的影响,不同类型下垫面温度、臭氧和云的垂直分布气候态差异是造成AIRS精度差异的根本原因.
|
图 5 AIRS-v6臭氧体积混合比廓线相对于ECC的平均误差、误差中位数和均方根误差 Fig. 5 As in Fig.2, but for relative biases between ECC and AIRS-v6 profiles of ozone volume mixing ratio |
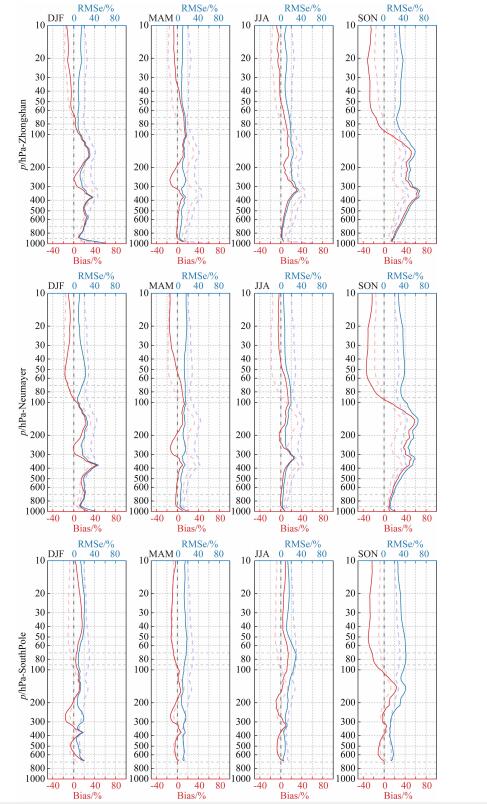
为了减少季节间互相补偿对误差统计的影响,图 5给出了各季节卫星臭氧相对误差廓线.可以看出在400~100 hPa高度,中山站和Neumayer站对流层的正误差主要来自于春季;在300~200 hPa之间,AIRS测值在秋季偏低,在其他季节偏高;在100 hPa以上,AIRS在春季明显低估了ECC臭氧测值;在400 hPa以下,各季节的误差都在随高度降低逐渐减少,值得注意的是夏季AIRS廓线在接近地面处(900 hPa以下)突然增大,这说明卫星对于近地面处臭氧快速变化的捕捉能力存在不足,具体造成这种误差突增的原因还需要进一步分析.对于SouthPole站,AIRS在春季400~100 hPa高度并没有出现明显的误差增大现象,而在100 hPa以上的区域仍然存在明显的负误差.400~100 hPa处于上对流层-下平流层(UT-LS)区域,这一区域内的臭氧变化和对流层顶天气尺度的变化紧密相关.
对流层顶温度垂直梯度降低会导致平流层-对流层双向交换增强(Zängl and Hoinka, 2001;Pan et al., 2004),研究表明南极冬季对流层顶“消失”,使得平流层的冷空气进入对流层(Roscoe,2004).南极春季臭氧损耗对西南极对流层顶高度和温度垂直梯度变化有较大影响,威德尔海区对流层顶高度的极大值在夏秋季位于9 km处,冬春季约在13~14 km之间(Evtushevsky et al., 2008).屈小川等(2014)利用COSMIC掩星资料发现南极对流层温度季节变化范围为200~230 K,高度变化范围为9~11 km,Bian等(2011)利用中山站探空资料发现南极对流层顶逆温在夏季和秋季比春季和冬季明显.本研究的结果表明AIRS反演能够很好的捕获对流层顶附近臭氧梯度的连续结构,但AIRS臭氧反演在春季臭氧快速变化时期对剧烈变化的臭氧梯度捕获能力存在不足.
图 6给出了臭氧误差廓线在不同季节差异.总体上讲,AIRS平流层臭氧的RMSe在春季明显大于其他季节.AIRS在南极春季100 hPa以上出现较大误差,均方根误差平均可达60%,而这一区域均方根误差年平均值仅为40%.南极春季(9—11月)在13~23 km高度附近“臭氧洞”事件频发,受极地涡旋强度和中心位置变化的影响,“臭氧洞”期间大气臭氧总量日变化很大(郑向东等,1995;孔琴心等,1996;郭松等,1997).AIRS臭氧误差出现异常的区域恰好与大气臭氧时空分布发生快速变化的区域相吻合.考虑到AIRS的时效性与空间分辨率,在相同的时空窗口下,“臭氧洞”期间AIRS臭氧反演与探空观测之间的差异会大于非“臭氧洞”期间.其次卫星反演过程中使用了先验的气候态廓线,这种气候态廓线在大气臭氧垂直分布发生快速变化的情况下的适用性还有待进一步研究.已有研究表明AIRS臭氧反演在中纬度地区能够捕捉到对流层顶附近的臭氧变化,但是对212~300 hPa高度范围内的臭氧梯度变化敏感性较低(Pittman et al., 2009).UT-LS区域在大气化学与气候相互作用中发挥着重要作用,在南极极夜期间很少有卫星仪器能够提供连续的天气尺度的臭氧变化情况,而本研究中评估的AIRS卫星数据为相关的气候研究提供了可能.
|
图 6 各季节臭氧平均误差和均方根误差随高度的变化情况 红色实线为季节平均误差廓线,蓝色实线为季节均方根误差廓线,红色虚线和蓝色虚线分别代表平均误差和均方根误差的年平均值. Fig. 6 As in Fig.3, but for ozone mean biases and root mean square biases as a function of height for each season |
了解AIRS反演产品在南极地区的精度,分析使用AIRS资料时应该注意的问题(如下垫面、云对反演产品的影响),是一项兼具科学意义和实用价值的工作.本研究使用2008年中山站、Neumayer站和SouthPole站为期一年的臭氧探空资料(分别代表东南极、西南极和南极内陆),对最新的AIRS-v6数据集在南极的精度进行了评估.主要结论如下:
(1) AIRS温度廓线与探空观测具有很高的一致性,但总体上低于探空值,在100 hPa以上误差较为显著,RMSe平均达到2~3 ℃.季节变化可影响温度反演精度,其中平流层比对流层受季节影响更大,各站点秋冬季的一致性均低于春夏季,且秋冬季温度误差振荡更明显.下垫面能明显影响到近地面层AIRS温度产品的精度,说明AIRS在提取南极低层大气垂直结构信息时仍存在局限性.
(2) AIRS臭氧产品精度在平流层要优于对流层,RMSe平均分别为25%和30%.UT-LS区域的RMSe最大可达到40%,其中春季的反演误差贡献最大.臭氧反演在高空(80 hPa以上)均低于ECC探空,对流层中的误差分布在海岸和内陆存在明显差异.臭氧洞期间AIRS反演误差明显增大,这种现象在对流层顶附近尤为显著,说明AIRS对大气臭氧快速变化的捕捉能力仍然存在不足.
(3) AIRS产品精度在南极沿岸和内陆存在差异,与卫星反演时采用的先验气候态值有关,由于南极地区探空资料较少且主要位于沿海,故在南极内陆地区进行探空试验能显著提高卫星资料精度,改善该区域天气预报能力.
致谢 感谢中国第25次南极越冬队和世界臭氧和紫外辐射数据中心提供的温度和臭氧探空数据,感谢AIRS科学团队提供的AIRX2SUP产品.
Aumann H H, Chahine M T, Gautier C, et al. 2003. AIRS/AMSU/HSB on the Aqua mission:design, science objectives, data products, and processing systems. IEEE Transactions on Geoscience and Remote Sensing, 41(2): 253-264. DOI:10.1109/TGRS.2002.808356 |
Backus G, Gilbert F. 1970. Uniqueness in the inversion of inaccurate gross earth data. Philosophical Transactions of the Royal Society A:Mathematical, Physical and Engineering Sciences, 266(1173): 123-192. |
Bandoro J, Solomon S, Donohoe A, et al. 2014. Influences of the Antarctic ozone hole on Southern Hemispheric summer climate change. Journal of Climate, 27(16): 6245-6264. DOI:10.1175/JCLI-D-13-00698.1 |
Bian J C, Gettelman A, Chen H B, et al. 2007. Validation of satellite ozone profile retrievals using Beijing ozonesonde data. Journal of Geophysical Research:Atmospheres, 112(D6): D06305. |
Bian L G, Lin Z, Zhang D Q, et al. 2011. The vertical structure and seasonal changes of atmosphere ozone and temperature at Zhongshan station over east Antarctica. Science China Earth Sciences, 55(2): 262-270. DOI:10.1007/s11430-011-4355-2 |
Blackwell W J. 2012. Neural network Jacobian analysis for high-resolution profiling of the atmosphere. EURASIP Journal on Advances in Signal Processing, 2012: 71. DOI:10.1186/1687-6180-2012-71 |
Boisvert L N, Wu D L, Vihma T, et al. 2015. Verification of air/surface humidity differences from AIRS and ERA-Interim in support of turbulent flux estimation in the Arctic. Journal of Geophysical Research:Atmospheres, 120(3): 945-963. DOI:10.1002/2014JD021666 |
Boisvert L N, Petty A A, Stroeve J C. 2016. The impact of the extreme winter 2015/16 Arctic cyclone on the Barents-Kara Seas. Monthly Weather Review, 144(11): 4279-4287. DOI:10.1175/MWR-D-16-0234.1 |
Boylan P, Wang J H, Cohn S A, et al. 2015. Validation of AIRS version 6 temperature profiles and surface-based inversions over Antarctica using Concordiasi dropsonde data. Journal of Geophysical Research:Atmospheres, 120(3): 992-1007. DOI:10.1002/2014JD022551 |
Chahine M T, Pagano T S, Aumann H H, et al. 2006. AIRS:Improving weather forecasting and providing new data on greenhouse gases. Bulletin of the American Meteorological Society, 87(7): 911-926. DOI:10.1175/BAMS-87-7-911 |
Conrath B J. 1972. Vertical resolution of temperature profiles obtained from remote radiation measurements. Journal of the Atmospheric Sciences, 29(7): 1262-1271. DOI:10.1175/1520-0469(1972)029<1262:VROTPO>2.0.CO;2 |
Diao M H, Jumbam L, Sheffield J, et al. 2013. Validation of AIRS/AMSU-A water vapor and temperature data with in situ aircraft observations from the surface to UT/LS from 87°N-67°S. Journal of Geophysical Research:Atmospheres, 118(12): 6816-6836. DOI:10.1002/jgrd.50483 |
Divakarla M G, Barnet C D, Goldberg M D, et al. 2006. Validation of Atmospheric Infrared Sounder temperature and water vapor retrievals with matched radiosonde measurements and forecasts. Journal of Geophysical Research:Atmospheres, 111(D9): D09S15. DOI:10.1029/2005JD006116 |
Dong S F, Gille S T, Sprintall J, et al. 2010. Assessing the potential of the Atmospheric Infrared Sounder (AIRS) surface temperature and specific humidity in turbulent heat flux estimates in the Southern Ocean. Journal of Geophysical Research:Oceans, 115(C5): C05013. DOI:10.1029/2009JC005542 |
Doran P T, Priscu J C, Lyons W B, et al. 2002. Antarctic climate cooling and terrestrial ecosystem response. Nature, 415(6871): 517. DOI:10.1038/nature710 |
Evtushevsky O M, Grytsai A V, Klekociuk A R, et al. 2008. Total ozone and tropopause zonal asymmetry during the Antarctic spring. Journal of Geophysical Research:Atmospheres, 113(D7): D00B06. DOI:10.1029/2008JD009881 |
Feltz M L, Knuteson R O, Revercomb H E. 2017. Assessment of COSMIC radio occultation and AIRS hyperspectral IR sounder temperature products in the stratosphere using observed radiances. Journal of Geophysical Research:Atmospheres, 122(16): 8593-8616. DOI:10.1002/2017JD026704 |
Fu C B, Dan L, Feng J M, et al. 2018. Temporal and spatial heterogeneous distribution of tropospheric CO2 over China and its possible genesis. Chinese Journal of Geophysics (in Chinese), 61(11): 4373-4382. DOI:10.6038/cjg2018L0266 |
Gao W H, Zhao F S, Xu Y F, et al. 2008. Validation of the surface air temperature products retrieved from the atmospheric infrared sounder over China. IEEE Transactions on Geoscience and Remote Sensing, 46(6): 1783-1789. DOI:10.1109/TGRS.2008.916640 |
Goelzer H, Huybrechts P, Loutre M F, et al. 2011. Impact of Greenland and Antarctic ice sheet interactions on climate sensitivity. Climate Dynamics, 37(5-6): 1005-1018. DOI:10.1007/s00382-010-0885-0 |
Goldberg M D, Qu Y, McMillin L M, et al. 2003. AIRS near-real-time products and algorithms in support of operational numerical weather prediction. IEEE Transactions on Geoscience and Remote Sensing, 41(2): 379-389. DOI:10.1109/TGRS.2002.808307 |
Guo S, Zhou X J, Zheng X D, et al. 1997. The measurements and analyses of ozone profile during the "ozone hole" period over Zhongshan station, Antarctica. Chinese Journal of Polar Research (in Chinese), 9(1): 78-82. |
Hearty T J, Savtchenko A K, Tian B J, et al. 2014. Estimating sampling biases and measurement uncertainties of AIRS-AMSU-a temperature and water vapor observations using MERRA reanalysis. Journal of Geophysical Research:Atmospheres, 119(6): 2725-2741. DOI:10.1002/2013JD021205 |
Hong J, Yao Z G, Han Z G, et al. 2015. Numerical simulations and AIRS observations of stratospheric gravity waves induced by the Typhoon Muifa. Chinese Journal of Geophysics (in Chinese), 58(7): 2283-2293. DOI:10.6038/cjg20150707 |
Hudson S R, Town M S, Walden V P, et al. 2004. Temperature, humidity, and pressure response of radiosondes at low temperatures. Journal of Atmospheric and Oceanic Technology, 21(5): 825-836. DOI:10.1175/1520-0426(2004)021<0825:THAPRO>2.0.CO;2 |
Intergovernmental Panel on Climate Change. 2013. Climate Change 2013: The Physical Science Basis. Contribution of Working Group I to the Fifth Assessment Report of the Intergovernmental Panel on Climate Change. edited by Stocker T F et al. Cambridge U. K., and New York: Cambridge Univ. Press, 1535. doi: 10.1017/CBO9781107415324.
|
Kong Q X, Liu G R, Wang G C. 1996. Observations and analyses of atmospheric ozone over Antarctic Zhongshan station in the spring of 1993. Chinese Journal of Atmospheric Sciences (in Chinese), 20(4): 395-400. |
Liu N Q, Huang F X, Wang W H. 2011. Monitoring of the 2011 spring low ozone events in the Arctic region. Chinese Science Bulletin, 56(27): 2893-2896. |
Maddy E S, Barnet C D. 2008. Vertical resolution estimates in version 5 of AIRS operational retrievals. IEEE Transactions on Geoscience and Remote Sensing, 46(8): 2375-2384. DOI:10.1109/TGRS.2008.917498 |
Mao X L, Xiao S R, Liu Q Q, et al. 2014. Fluid dynamic analysis on solar heating error of radiosonde humidity measurement. Acta Physica Sinica (in Chinese), 63(14): 144701. |
Menke W. 2012. Geophysical Data Analysis: Discrete Inverse Theory. London: Geophysical Data Analysis: Discrete Inverse Theory, 261-276.
|
Pan L L, Randel W J, Gary B L, et al. 2004. Definitions and sharpness of the extratropical tropopause:A trace gas perspective. Journal of Geophysical Research:Atmospheres, 109(D23): D23103. DOI:10.1029/2004JD004982 |
Pavelin E G, English S J, Eyre J R. 2008. The assimilation of cloud-affected infrared satellite radiances for numerical weather prediction. Quarterly Journal of the Royal Meteorological Society, 134(632): 737-749. DOI:10.1002/qj.243 |
Pittman J V, Pan L L, Wei J C, et al. 2009. Evaluation of AIRS, IASI, and OMI ozone profile retrievals in the extratropical tropopause region using in situ aircraft measurements. Journal of Geophysical Research:Atmospheres, 114(D24): D24109. DOI:10.1029/2009JD012493 |
Qu X C, An J C, Liu G. 2014. Analysis of Antarctic tropopause with COSMIC occultation data. Geometrics and Information Science of Wuhan University (in Chinese), 39(5): 605-610. |
Randel W J, Wu F. 1999. Cooling of the Arctic and Antarctic polar stratospheres due to ozone depletion. Journal of Climate, 12(5): 1467-1479. DOI:10.1175/1520-0442(1999)012<1467:COTAAA>2.0.CO;2 |
Reale T, Sun B M, Tilley F H, et al. 2012. The NOAA products validation system (NPROVS). Journal of Atmospheric and Oceanic Technology, 29(5): 629-645. DOI:10.1175/JTECH-D-11-00072.1 |
Rodgers C D, Connor B J. 2003. Intercomparison of remote sounding instruments. Journal of Geophysical Research:Atmospheres, 108(D3): 4116. DOI:10.1029/2002JD002299 |
Roscoe H K. 2004. Possible descent across the "Tropopause" in Antarctic winter. Advances in Space Research, 33(7): 1048-1052. DOI:10.1016/S0273-1177(03)00587-8 |
Rowe P M, Miloshevich L M, Turner D D, et al. 2008. Dry bias in Vaisala RS90 radiosonde humidity profiles over Antarctica. Journal of Atmospheric and Oceanic Technology, 25(9): 1529-1541. DOI:10.1175/2008JTECHA1009.1 |
Shi C H, Chen Y, Zheng B, et al. 2010. A comparison of the contributions of dynamical transportation and photochemical process to ozone's seasonal variation in the stratosphere. Chinese Journal of Atmospheric Sciences (in Chinese), 34(2): 399-406. |
Shi C H, Zhang C X, Guo D. 2017. Comparison of electrochemical concentration cell ozonesonde and microwave limb sounder satellite remote sensing ozone profiles for the center of the South Asian high. Remote Sensing, 9(10): 1012. DOI:10.3390/rs9101012 |
Smit H G J, Straeter W, Johnson B J, et al. 2007. Assessment of the performance of ECC-ozonesondes under quasi-flight conditions in the environmental simulation chamber:Insights from the Juelich Ozone Sonde Intercomparison Experiment (JOSIE). Journal of Geophysical Research:Atmospheres, 112(D19): D19306. DOI:10.1029/2006JD007308 |
Solomon S, Garcia R R, Rowland F S, et al. 1986. On the depletion of Antarctic ozone. Nature, 321(6072): 755-758. DOI:10.1038/321755a0 |
Solomon S. 1999. Stratospheric ozone depletion:A review of concepts and history. Rev. Geophys., 37: 275-316. DOI:10.1029/1999RG900008 |
Steinbrecht W, Claude H, Schönenborn F, et al. 2008. Pressure and temperature differences between Vaisala RS80 and RS92 Radiosonde systems. Journal of Atmospheric and Oceanic Technology, 25(6): 909-927. DOI:10.1175/2007JTECHA999.1 |
Sun B M, Reale A, Seidel D J, et al. 2010. Comparing radiosonde and COSMIC atmospheric profile data to quantify differences among radiosonde types and the effects of imperfect collocation on comparison statistics. Journal of Geophysical Research:Atmospheres, 115(D23): D23104. DOI:10.1029/2010JD014457 |
Susskind J, Barnet C D, Blaisdell J M. 2003. Retrieval of atmospheric and surface parameters from AIRS/AMSU/HSB data in the presence of clouds. IEEE Transactions on Geoscience and Remote Sensing, 41(2): 390-409. DOI:10.1109/TGRS.2002.808236 |
Susskind J, Blaisdell J M, Iredell L. 2014. Improved methodology for surface and atmospheric soundings, error estimates, and quality control procedures:the atmospheric infrared sounder science team version-6 retrieval algorithm. Journal of Applied Remote Sensing, 8(1): 084994. DOI:10.1117/1.JRS.8.084994 |
Thompson D W J, Solomon S, Kushner P J, et al. 2011. Signatures of the Antarctic ozone hole in Southern Hemisphere surface climate change. Nature Geoscience, 4(11): 741. DOI:10.1038/ngeo1296 |
Tobin D C, Revercomb H E, Knuteson R O, et al. 2006. Atmospheric Radiation Measurement site atmospheric state best estimates for Atmospheric Infrared Sounder temperature and water vapor retrieval validation. Journal of Geophysical Research:Atmospheres, 111(D9): D09S14. DOI:10.1029/2005JD006103 |
Turner J, Colwell S R, Marshall G J, et al. 2005. Antarctic climate change during the last 50 years. International Journal of Climatology, 25(3): 279-294. DOI:10.1002/joc.1130 |
Verhoelst T, Granville J, Hendrick F, et al. 2015. Metrology of ground-based satellite validation:co-location mismatch and smoothing issues of total ozone comparisons. Atmospheric Measurement Techniques, 8(12): 8023-8082. |
Wang J H, Hock T, Cohn S A, et al. 2013. Unprecedented upper-air dropsonde observations over Antarctica from the 2010 Concordiasi Experiment:Validation of satellite-retrieved temperature profiles. Geophysical Research Letters, 40(6): 1231-1236. DOI:10.1002/grl.50246 |
Wang W G, Fan W X, Wu J, et al. 2006. A study of spatial-temporal evolvement of the global cross-tropopause ozone mass flux. Chinese Journal of Geophysics (in Chinese), 49(6): 1595-1607. DOI:10.1002/cjg2.987 |
Wang W H, Zhang Y, Li X J, et al. 2011. Monitoring results and analysis of anomalously low ozone in the 2011 Arctic spring. Chinese Journal of Polar Research (in Chinese), 23(4): 310-317. |
White W B, Peterson R G. 1996. An Antarctic circumpolar wave in surface pressure, wind, temperature and sea-ice extent. Nature, 380(6576): 699. DOI:10.1038/380699a0 |
Yan X L, Wright J S, Zheng X D, et al. 2016. Validation of Aura MLS retrievals of temperature, water vapour and ozone in the upper troposphere and lower-middle stratosphere over the Tibetan Plateau during boreal summer. Atmospheric Measurement Techniques, 9(8): 3547-3566. DOI:10.5194/amt-9-3547-2016 |
Yao Z G, Zhao Z L, Han Z G. 2015. Stratospheric gravity waves during summer over East Asia derived from AIRS observations. Chinese Journal of Geophysics (in Chinese), 58(4): 1121-1134. DOI:10.6038/cjg20150403 |
Zängl G, Hoinka K P. 2001. The tropopause in the polar regions. Journal of Climate, 14(14): 3117-3139. DOI:10.1175/1520-0442(2001)014<3117:TTITPR>2.0.CO;2 |
Zhan R F, Li J P. 2008. Validation and characteristics of upper tropospheric water vapor over the Tibetan Plateau from AIRS satellite retrieval. Chinese Journal of Atmospheric Sciences (in Chinese), 32(2): 242-260. |
Zhang L, Jacob D J, Liu X, et al. 2010. Intercomparison methods for satellite measurements of atmospheric composition:application to tropospheric ozone from TES and OMI. Atmospheric Chemistry and Physics, 10(1): 4725-4739. |
Zhang Y W, Wang D H, Zhai P M, et al. 2011. Applicability of AIRS monthly mean atmospheric water vapor profiles over the Tibetan Plateau region. Journal of Atmospheric and Oceanic Technology, 29(11): 1617-1628. |
符传博, 丹利, 冯锦明, 等. 2018. 我国对流层二氧化碳非均匀动态分布特征及其成因. 地球物理学报, 61(11): 4373-4382. DOI:10.6038/cjg2018L0266 |
郭松, 周秀骥, 郑向东, 等. 1997. 南极中山站臭氧洞期间O3廓线的观测研究. 极地研究, 9(1): 78-82. |
洪军, 姚志刚, 韩志刚, 等. 2015. 台风"梅花"诱发平流层重力波的数值模拟与AIRS观测. 地球物理学报, 58(7): 2283-2293. DOI:10.6038/cjg20150707 |
孔琴心, 刘广仁, 王庚辰. 1996. 1993年春季南极中山站上空大气臭氧的观测分析. 大气科学, 20(4): 395-400. DOI:10.3878/j.issn.1006-9895.1996.04.02 |
刘年庆, 黄富祥, 王维和. 2011. 2011年春季北极地区臭氧低值事件的卫星遥感监测. 科学通报, 56(27): 2315-2318. |
冒晓莉, 肖韶荣, 刘清惓, 等. 2014. 探空湿度测量太阳辐射误差修正流体动力学研究. 物理学报, 63(14): 144701. DOI:10.7498/aps.63.144701 |
屈小川, 安家春, 刘根. 2014. 利用COSMIC掩星资料分析南极地区对流层顶变化. 武汉大学学报·信息科学版, 39(5): 605-610. |
施春华, 陈月娟, 郑彬, 等. 2010. 平流层臭氧季节变化的动力和光化学作用之比较. 大气科学, 34(2): 399-406. DOI:10.3878/j.issn.1006-9895.2010.02.13 |
王卫国, 樊雯璇, 吴涧, 等. 2006. 全球平流层-对流层之间臭氧通量的时空演变研究. 地球物理学报, 49(6): 1595-1607. DOI:10.3321/j.issn:0001-5733.2006.06.004 |
王维和, 张艳, 李晓静, 等. 2011. 2011年春季北极臭氧异常低值监测和特征分析. 极地研究, 23(4): 310-317. |
姚志刚, 赵增亮, 韩志刚. 2015. AIRS观测的东亚夏季平流层重力波特征. 地球物理学报, 58(4): 1121-1134. DOI:10.6038/cjg20150403 |
占瑞芬, 李建平. 2008. 青藏高原地区大气红外探测器(AIRS)资料质量检验及揭示的上对流层水汽特征. 大气科学, 32(2): 242-260. |
郑向东, 周秀骥, 陆龙骅, 等. 1995. 1993年中山站南极"臭氧洞"的观测研究. 科学通报, 40(6): 533-535. DOI:10.3321/j.issn:0023-074X.1995.06.016 |
 2020, Vol. 63


