 2020, Vol. 63


2. 防灾科技学院, 河北廊坊 065201;
3. 武汉大学测绘学院, 武汉 430079
2. Institute of Disaster Prevention, Hebei Langfang 065201, China;
3. School of Geodesy and Geomatics, Wuhan University, Wuhan 430079, China
岩石圈有效弹性厚度(Te,effective elastic thickness),反映了岩石圈在地质时间尺度(>1 Ma)上的力学强度,定义为与岩石圈板块中实际应力分布所产生的弯矩(bending moment)相等的弯曲弹性薄板的厚度(Forsyth,1985;焦述强和金振民,1996),与壳幔物质组成、热状态、壳幔耦合程度等相关(Burov and Diament, 1995;安美建和石耀霖,2006).陆地Te的计算结果可为克拉通破坏、青藏高原隆升等构造运动的动力学机制研究提供参考(赵俐红等,2004;郑勇等,2012;姜效典等,2014).
国际上,岩石圈力学强度参数(抗挠刚度或有效弹性厚度)的定量计算始于20世纪70年代(Walcott, 1970a, b, c).此后,陆地Te的计算方法主要包括谱方法和空域法两类.谱方法包括布格重力异常-地形导纳法、布格重力异常-地形相干性方法、空间重力异常-地形导纳法等(McNutt,1979;Forsyth,1985).为解决谱分析过程中传统傅里叶变换产生的频率泄露问题,同时提高Te计算结果的空间分辨率,学者们还引入了多窗谱法、Fan小波分析等方法(McKenzie and Fairhead, 1997;Simons et al., 2000;Kirby and Swain, 2011; Kirby,2014).谱方法计算Te的局限性是其频谱泄露问题和数据窗内Te参数需保持定值,这制约了计算结果空间分辨率的提高,也不利于研究岩石圈强度的横向变化.空域法则直接利用数值解法求解岩石圈在地形载荷作用下发生挠曲形变的偏微分方程,虽在求解过程中可顾及岩石圈强度的横向差异,但计算量大、计算速度慢,求解难度大.因此,虽然Van Wees和Cloetingh(1994)即提出了该方法,但至今仅有少量计算成果发表(赵俐红等,2004;Jordan and Watts, 2005;姜效典等,2014).
在国内,自20世纪90年代年以来,学者们采用不同的方法对中国大陆局部或整体岩石圈有效弹性厚度进行了计算(王勇和许厚泽,1996;赵俐红等,2004;郑勇等,2012;李永东等,2013;陈波,2013;姜效典等,2014;陈青,2015),并应用于华北克拉通、青藏高原等区域的构造解释.但是,目前中国大陆地区Te的计算和研究存在的主要问题是:不同学者由于采用了不同的数据资料和计算方法,计算的Te存在较大差异,且计算成果的空间分辨率较低,这制约了对计算结果的地球物理解释和应用.
青藏高原东南缘是高原物质向东流出并发生顺时针旋转运动的区域,构造运动强烈、地震频发.对该地区Te的研究,不仅有助于促进高原增厚机制、壳幔耦合作用等研究,还可为地震动力学背景研究、区域地震危险性分析等提供参考,具有一定的地球科学研究和减灾应用意义.本文首先给出Te计算的有限差分方法,并模拟分析其计算稳定性、可靠性.在此基础上,利用EIGEN6C4布格重力异常(http://icgem.gfz-potsdam.de)和SIO V15.1地形(http://topex.ucsd.edu)资料计算青藏高原东南缘Te,并分析其与岩石圈结构的关系以及对下地壳流的指示意义.
1 岩石圈有效弹性厚度计算的有限差分法 1.1 计算原理与数据处理流程在岩石圈有效弹性厚度的研究中,通常将岩石圈类比为上覆于无黏性流体上的弹性板薄板(厚度较长度小得多),在垂直载荷q(地形载荷下为ρcgh)和水平应力场(σxx,σyy,σxy)作用下,岩石圈的挠曲形变微分方程为(van Wees and Cloetingh, 1994):

|
(1) |
式中岩石圈抗挠刚度D=ET3e/12(1-v2),E为杨氏模量,Te为岩石圈有效弹性厚度,v为泊松比,w为岩石圈挠曲,q=ρcgh,ρc为地壳密度,h为地形高程,dρ=ρin-ρm为挠曲填充物质密度与地幔密度之差,g为平均重力加速度.实际岩石圈中促使岩石圈发生挠曲形变所需的水平应力巨大,超过其所能承受的应力,一旦这种水平应力场存在,则岩石圈将破裂,而不发生挠曲形变(Turcotte and Schubert, 2014),因此,实际应用中多不用考虑水平应力场,即(σxx=0,σyy=0,σxy=0).
当岩石圈强度无横向变化时,公式(1)可以大大简化,并可直接获得频域解(Watts,2001),这构成了采用谱方法计算Te的基础.当岩石圈强度存在横向变化时(实际情况即是),公式(1)的解析解不易获得,通常可采用有限差分方法求其数值解.本文即在顾及岩石圈强度横向变化的情况下,直接以中心差分公式代替(1)式中的偏微分,将此偏微分方程转换成线性方程组以获得其数值解,即:

|
(2) |
式中W=(w1, w2, …, wi, …, wMN-1, wMN)T,H=C2(h1, h2, …, hi, …, hMN-1, hMN)T为MN行列向量(以从左到右、从上到下的顺序排列),
岩石圈有效弹性厚度的计算是以挠曲均衡理论为基础的(Watts,2001),在陆地区域通常以地形数据为输入载荷,以布格重力异常为约束条件,即计算地形载荷作用下产生的Moho面挠曲,进而计算Moho面挠曲引起的布格重力异常,当布格重力异常的计算值与观测值之差的均方根RMS(Root Mean Square)达到最小时,获得Te计算结果.研究表明,陆地岩石圈有效弹性厚度为0至百余千米(Burov and Diament, 1995;Watts,2001),且重力具有衰减特性,即计算点周边的质量对其影响更显著.因此,可以设计Te的计算流程为(图 1):

|
图 1 岩石圈有效弹性厚度计算流程图 Fig. 1 Flow chart for calculating the lithospheric effective elastic thickness |
第一步,获取横向变化的Te初始模型,即以步长为5 km,分别计算Te为0~150 km时对应的布格重力异常,共31组,逐点将此计算值与观测值比较(将待算点周围100 km范围内的重力异常值一起参与比较),当两者之差的RMS最小时,获得该点的Te初始值,遍历待算点后即可获得横向变化的初始模型;
第二步,Te模型调整,即基于第一步获得的初始模型,分别计算初始模型-4 km、-2 km、+2 km、+4 km时的4组布格重力异常,按第一步的方法逐点挑选Te值,实现Te模型的更新调整,循环此调整过程直到前后两次计算的Te之差小于等于2 km;
第三步,Te模型微调,即在第二步获得的Te模型基础上,分别计算模型-1 km、+1 km时的2组布格重力异常,并按第一步的方法逐点挑选Te值,循环此调整过程4次(因为第二步单次最大调整量是4 km),即可获得最终计算结果.
1.2 模拟计算分析为分析1.1节Te计算方法的可靠性、计算程序的稳定性,先以模型数据进行模拟计算.表 1所示为模拟岩石圈的地幔密度、地壳密度等参数,以及拟采用的格网尺寸.采用钟形函数生成的模拟岩石圈有效弹性厚度如图 2a所示,模拟地形载荷(顶高2000 m)如图 2b所示.在地形载荷作用下的挠曲形变及其产生的布格重力异常分别如图 2c、d所示.
|
|
表 1 模拟计算时采用的岩石圈参数 Table 1 Lithospheric parameters used in simulation calculation |

|
图 2 模拟的岩石圈有效弹性厚度(a),地形(b),岩石圈挠曲(c),以及布格重力异常(d) Fig. 2 Simulated lithospheric effective elastic thickness (a), topography (b), lithospheric flexure (c), and Bouguer gravity anomaly (d) |
模拟分析时,以图 2b所示地形为输入载荷,图 2d所示布格重力异常为约束,计算Te并与图 2a进行对比.主要考虑布格重力异常存在高斯噪声,以及存在岩石圈内部载荷两种情况下的计算结果.
(1) 布格重力异常加入高斯噪声
利用1.1节所述方法,以图 2d所示布格重力异常加入不同误差后的数据为约束计算Te,以测试计算程序的正确性和稳定性,计算结果如图 3所示.图 3a为数据不含误差时的计算结果,准确恢复了图 2a所示的Te,在图形中央200 km×200 km范围内(实际计算过程中为避免边界效应,一般仅取中心区域的计算结果),计算结果与模型值之差在±2 km以内,表明计算程序正确.在图 2d所示的布格重力异常中加入均值/标准差分别为1/3 mGal、3/5 mGal、5/7 mGal的高斯噪声后,Te计算结果分别见图 3b、c、d,可见随着噪声水平增大,Te计算结果精度逐步降低,但Te值由中心向外逐步减小的趋势始终得以保持,说明计算程序表现稳定.

|
图 3 布格重力异常无噪声(a)和加入高斯噪声均值/标准差分别为1/3mGal(b)、3/5 mGal (c)、5/7 mGal (d)时岩石圈有效弹性厚度计算结果图中等值线表示岩石圈有效弹性厚度计算结果,背景色彩为计算误差. Fig. 3 The lithospheric effective elastic thickness (e) calculated with no noise (a), or by adding Gauss noise to Bouguer gravity anomaly, with mean/STD are 1/3 mGal (b), 3/5 mGal (c), 5/7 mGal (d) respectivelyContours depict calculated Te and the background color indicates the calculation error. |
(2) 内部载荷的影响
因地球内部热活动等引起的密度异常,即所谓内部载荷作用,是影响陆地Te计算结果的重要因素(Forsyth,1985;姜效典等,2014).为定量研究其影响,本文再以钟形函数模拟埋深为40 km,与周围岩石密度差为100 kg·m-3的低密度异常体.该低密度异常体将产生负重力异常,并因其浮力作用而引起地壳向上隆升,如图 4所示.由此而附加于布格重力异常的重力影响将包括异常体产生的负异常和Moho面向上隆升的正异常两部分,而地形将包括地表载荷和由内部载荷引起的隆起两部分.图 5所示是内部载荷高分别为1100 m、1500 m、1700 m和1900 m时对应的Te计算结果.对比图 5与图 2a,表明在存在内部载荷情况下,即使内部载荷尺寸与地形载荷相当,本文采用的计算程序仍可较好恢复岩石圈有效弹性厚度的变化趋势,进一步验证了计算方法和程序的正确性.

|
图 4 内部低密度载荷引起的Moho面隆升及其重力异常效应示意图 Fig. 4 Diagram for Moho surface uplift caused by internal low density loading and its gravity anomaly |

|
图 5 内部载荷高度分别为1100 m(a)、1500 m(b)、1700 m(c)、1900 m(d)时的岩石圈有效弹性厚度计算结果图中等值线表示岩石圈有效弹性厚度计算结果,背景颜色表示计算误差. Fig. 5 The calculated results of the lithospheric effective elastic thickness under different internal load heights, which are 1100 m (a), 1500 m (b), 1700 m (c) and 1900 m (d), respectively Contours depict calculated Te and the background color indicates the calculation error. |
本文研究区域以青藏高原东南缘为中心(94°E—110°E,20°N—36°N),是青藏高原物质东流后发生顺时针转向的区域,区域内巴颜喀拉、川滇、华南等活动地块间相互作用强烈,造成大震频发(图 6).

|
图 6 研究区域的地形(数据源自SIO V15.1,https://topex.ucsd.edu/marine_topo/mar_topo.html)及构造格局(黑色虚线内为本文岩石圈有效弹性厚度计算区域) Fig. 6 Topography in the study area (SIO V15.1:https://topex.ucsd.edu/marine_topo/mar_topo.html) and its tectonic pattern (within the black-dashed line is the area for calculating the lithospheric effective elastic thickness in this paper) |
本文Te计算的输入数据为地形模型,约束数据为布格重力异常.其中,地形模型是来自斯克里普斯海洋研究所(SIO,Scripps Institute of Oceanography)的V15.1模型,其陆地部分的地形数据来自ETOPO1(Amante and Eakins, 2009),空间分辨率为1′×1′,如图 6所示.研究区域右下角水域为质量亏损区,计算时做负载荷处理.布格重力异常为来自ICGEM(International Center for Global Earth Models)的EIGEN6C4模型(FöFörste et al., 2014).该模型为联合地面、卫星测高和卫星重力数据构建的超高阶重力场模型(2190阶),空间分辨率约为5′×5′.EIGEN6C4模型融合了GOCE卫星重力数据,在长波部分(>100 km)较EGM2008模型具有更高的精度(Biancale,2011;FöFörste et al., 2014;冯进凯等,2017).ICGEM网站提供的是简单布格重力异常,为抑制局部地形起伏等影响,本文对下载的数据进行了50 km低通滤波处理(Fielding and McKenzie, 2012),结果如图 7所示.

|
图 7 研究区域布格重力异常数据为源自ICGEM的EIGEN6C4模型(http://icgem.gfz-potsdam.de) Fig. 7 Bouguer gravity anomaly in the study area downloaded from ICGEM (EIGEN6C4: http://icgem.gfz-potsdam.de) |
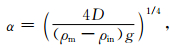
根据挠曲均衡理论(Watts,2001),在固定载荷作用下Moho面的挠曲形变幅度和波长由挠曲参数(flexural parameter)α决定,即
|
(3) |
式中各符号意义与公式(1)相同,而以第一挠曲节点(first flexural node)位置(即
青藏高原东南缘岩石圈有效弹性厚度计算结果如图 8a所示,布格重力异常计算值如图 8b所示.从图 8a看,川滇地区岩石圈有效弹性厚度为0~100 km,四川盆地和喜马拉雅东构造结地区岩石圈强度大(>50 km),自巴颜喀拉块体东部至川滇菱形块体岩石圈强度小(< 15 km).自川西高原至四川盆地,岩石圈有效弹性厚度由0~10 km增大至50~100 km.

|
图 8 青藏高原东南缘岩石圈有效弹性厚度(a)与布格重力异常(b)计算值 Fig. 8 The calculated lithospheric effective elastic thickness (a) and Bouguer gravity anomaly (b) in the southeastern Qinghai-Tibet Plateau |
有效弹性厚度作为岩石圈综合强度的定量描述,其数值与岩石圈各圈层厚度无直接对应关系(安美建和石耀霖,2006),不同学者计算结果也存在差异(Burov and Diament, 1995;Watts,2001),因此有学者认为有效弹性厚度变化趋势的研究比其具体数值更有意义(Watts,2001).实际上,岩石圈有效弹性厚度计算的理论基础是岩石圈挠曲均衡模型,且主要是以Moho面在地形等载荷作用下的挠曲形变(或其产生的布格重力异常)为约束来定量评估其数值(Watts,2001).因此,我们可以根据均衡重力异常、Moho面挠曲等来间接评估有效弹性厚度计算结果的正确性.特别是通过与测震学获得的Moho面挠曲形状的比较,可以为有效弹性厚度计算结果提供独立验证.
在挠曲均衡模型下,均衡重力异常计算结果如图 9a所示,与Airy均衡重力异常相较(图 9b),其幅度更小,数值变化“平缓”,显示本文研究区域岩石圈符合挠曲均衡模型.此外,我们选取横跨川滇菱形块体北部(EE′)和龙门山断裂带(FF′)的两条剖面,其测震学Moho深度分别来自Wang等(2010)和嘉世旭等(2014).在Airy均衡模型和挠曲均衡模型下分别计算了两条剖面的均衡重力异常、布格重力异常和Moho挠曲,如图 9c、d所示.

|
图 9 挠曲均衡重力异常(a)、Airy均衡重力异常(b)、跨龙门山剖面FF′重力异常与Moho面深度(c),以及横穿川滇菱形块体北部的剖面EE′重力异常与Moho面深度(d) Fig. 9 The flexural isostatic gravity anomaly (a), Airy isostatic gravity anomaly (b), the gravity anomaly and Moho depth on the profile FF′ across the Longmen Shan (c) and EE′ across north of the Sichuan-Yunnan rhombic block (d) |
从图 9c看,沿FF′剖面挠曲均衡重力异常变化平缓、布格重力异常与实测值拟合更好,并且Moho挠曲形状较好地重现了川西高原至四川盆地的抬升过程,由约55 km变化至41 km,抬升了近14 km,与测震学等研究结果一致(嘉世旭等,2014;郝天珧等,2014),证明本文自川西高原至四川盆地岩石圈有效弹性厚度计算结果合理.
从图 9d看,沿EE′剖面,挠曲均衡重力异常量级更小、布格重力异常与实测值拟合更好,Moho挠曲形状与测震学深度拟合较好.但是,无论挠曲均衡模型还是Airy均衡模型,96°E—99°E的测震学Moho面更深,显示该区域可能是青藏高原物质东流的通道之一(Bai et al., 2010).
综上所述,本文图 8a所示的岩石圈有效弹性厚度计算结果可靠.
3 讨论 3.1 与已有岩石圈有效弹性厚度计算结果的比较已有不少学者的研究中涉及了本文研究区域的岩石圈有效弹性厚度计算.Jordan和Watts(2005)采用三维有限差分法计算了印度—青藏高原—东南亚地区岩石圈有效弹性厚度,发现松潘—甘孜地块岩石圈有效弹性厚度较小(< 25 km),四川盆地岩石圈有效弹性厚度较大(>40 km),而云南地区岩石圈有效弹性厚度总体较小(< 20 km).Fielding和McKenzie(2012)通过拟合布格重力异常剖面,认为四川盆地西部(龙门山山前)的有效弹性厚度可达54.6 km,盆地内部可能更大.Chen等(2014)采用Fan小波相干性分析方法计算了青藏高原东南缘岩石圈有效弹性厚度及其各向异性特征,发现川滇地区岩石圈有效弹性厚度总体较弱(< 40 km),川滇菱形块体北端玉树—德格地区强度较大(>60 km).姜效典等(2014)采用三维有限差分法计算了青藏高原及邻区岩石圈有效弹性厚度,发现川滇地区北部岩石圈有效弹性厚度较大(~40 km)而云南地区大部较小(~30 km),喜马拉雅东构造结和四川盆地岩石圈强度较大(>50 km).上述研究成果因数据和方法的差异,岩石圈有效弹性厚度计算数值上略有差别,但一般认为四川盆地岩石圈相对于周边地区具有更大的有效弹性厚度.
本文的计算结果,在大趋势上与前人研究结果一致,但是展现了更多的有效弹性厚度变化细节(图 8a).在龙门山断裂带两侧,从西到东,岩石圈有效弹性厚度经历了由大变小(松潘—甘孜地块西部大于15 km减小到东部小于10 km)、再由小迅速增大(龙门山西侧小于10 km迅速增大到四川盆地的50~100 km)的过程.川滇菱形块体内部岩石圈有效弹性厚度较小(一般小于10 km),而四周岩石圈呈强弱相间的态势,尤其是喜马拉雅东构造结和四川盆地岩石圈有效弹性厚度均大于50 km,对川滇菱形块体及周边呈“夹持”状态,是控制青藏高原东南缘地壳旋转运动的受力支点.
3.2 Te与岩石圈结构在青藏高原东南缘地区,岩石圈有效弹性厚度呈现如图 8a所示区域性变化特征,地壳厚度则从高原地区约70 km递减至四川盆地、云南南部的约40 km(图 10),而地震则主要发生在中上地壳(图 11).研究区域内岩石圈有效弹性厚度Te、地壳厚度Tc和地震发震深度Ts的频率分布直方图如图 12所示.

|
图 10 青藏高原东南缘地壳厚度(数据来自CRUST 1.0模型) Fig. 10 Crustal thickness in the southeastern Qinghai-Tibet Plateau (data from CRUST 1.0 model) |

|
图 11 青藏高原东南缘地震深度分布,可见地震主要发生在小于20 km的深度(地震信息来自中国地震信息网) Fig. 11 Seismic depth distribution in the southeastern Qinghai-Tibet Plateau shows that earthquakes mainly occur at depths less than 20 km (seismic information comes from China Seismic Information Network) |

|
图 12 岩石圈有效弹性厚度Te(a)、地壳厚度Tc(b)和地震发震深度Ts(c)的频率分布直方图 Fig. 12 Frequency distribution histogram of lithospheric effective elastic thickness Te (a), crustal thickness Tc (b) and seismic depth Ts (c) |
从图 8a、图 11、图 12看,青藏高原东南缘岩石圈有效弹性厚度与地壳厚度无正相关性.巴颜喀拉地块东部、川滇菱形地块大部、滇西等地区的地壳厚度达50~60 km而有效弹性厚度一般小于15 km,四川盆地地壳厚度约40 km而有效弹性厚度达50 km以上,这与研究区域的岩石圈构造、壳幔相互作用方式有关.在结构相对简单的海洋地区,根据板块冷却模型,岩石圈从洋中脊向两侧逐步冷却增厚变硬,有效弹性厚度大致分布于300~600 ℃等温线深度范围内(Watts,2001),显示地幔也对岩石圈强度有贡献.在大陆地区,岩石圈年代更老温度更低,因此地幔物质也可能对其整体强度起到部分作用(Jordan and Watts, 2005).
在四川盆地,岩石圈有效弹性厚度较地壳厚度大得多,显示地幔对其强度起到重要作用.事实上,地震波速度结构显示,与鄂尔多斯地块、塔里木盆地等类似,四川盆地为稳定的克拉通壳幔结构(嘉世旭等,2014),而稳定克拉通的岩石圈强度普遍较大(Braitenberg et al., 2003;郑勇等,2012;陈波,2013;姜效典等,2014).在川西北高原地区(巴颜喀拉地块东部),中下地壳明显增厚并出现低速层结构(楼海等,2008;Wang et al., 2010;嘉世旭等,2014),同时表现出高导/低阻的大地电磁特性(李立和金国元,1987;王绪本等,2009),推测可能存在中下地壳的部分熔融软化,再加上广泛分布的断裂带,使得岩石圈整体强度降低,因此有效弹性厚度显著小于四川盆地.
川滇菱形块体大部和滇西地区岩石圈有效弹性厚度也普遍小于10 km,这与该地区较广泛存在的壳内低速层、低阻/高导层等结构是对应的(图 13、14).地震层析成像、接收函数反演等结果显示,川滇菱形块体北部至滇中、滇西等地区均存在大范围的中、下地壳低速异常(胡家富等,2008;Yao et al., 2010;Liu et al., 2014),且这些低速区跨过了丽江—小金河断裂带延伸向滇中(王苏等,2015).Bai等(2010)根据大地电磁测深剖面结果探测到了自滇西北至滇南,埋深20~40 km的高导层.其他大地电磁测深结果也显示川滇菱形块体的北部(孙洁等,2003)、中东部(李立和金国元,1987;万战生等,2010)、中南部(孔祥儒等,1987;程远志等,2015),以及滇西地区等(孙洁等,1989)较普遍存在中、下地壳高导层,可能与岩石的部分熔融有关.

|
图 13 青藏高原东南缘岩石圈有效弹性厚度与壳内低速层分布有很好的对应关系,巴颜喀拉块体东部、川滇菱形块体等岩石圈强度较弱地区(Te < 15 km)普遍存在壳内低速层AA′、BB′为接收函数和面波联合反演的S波速度剖面(Liu et al., 2014),CC′、DD′为面波层析成像S波速扰动剖面(Yao et al., 2010),EE′为远震P波接收函数反演方法获得的S波速度结构剖面(王椿镛等,2008;Wang et al., 2010),FF′为跨龙门山的深地震宽角反/折射测深剖面(嘉世旭等,2014). Fig. 13 The lithospheric effective elastic thickness in the southeastern Qinghai-Tibet Plateau corresponds well to the distribution of low-velocity layers in the crust. Low-velocity layers in the crust are common in the eastern part of the Bayan Har Block and the Sichuan-Yunnan rhombic block where the strength of the lithosphere is weak (Te < 15 km)The AA′ and BB′ are S-wave velocity profiles jointly inversion from receiving function and surface wave (Liu et al., 2014). CC′ and DD′ are S-wave velocity disturbance profiles from surface wave tomography (Yao et al., 2010). EE′ is S-wave velocity profile obtained by inversion of teleseismic P-wave receiving function (Wang et al., 2008; Wang et al., 2010). FF′ is a wide-angle inversion/refraction sounding profile of deep earthquakes across Longmenshan fault (Jia et al., 2014). |

|
图 14 青藏高原东南缘岩石圈有效弹性厚度与壳内低阻/高导层分布有很好的对应关系,巴颜喀拉块体东部、川滇菱形块体等岩石圈强度较弱地区(Te < 15 km)普遍存在壳内低阻/高导层①为丽江—攀枝花—巧家大地电磁测深剖面(孔祥儒等,1987); ②横跨攀西裂谷带(宁蒗—泸州)和龙门山断裂带(阿坝—泸州)大地电磁测深剖面(李立和金国元,1987); ③为滇西地区大地电磁测深剖面(孙洁等,1989); ④为川滇菱形块体北部大地电磁测深剖面(孙洁等,2003); ⑤为跨龙门山断裂带的碌曲—若尔盖—北川—中江大地电磁剖面(王绪本等,2009); ⑥为冕宁—宜宾、石棉—乐山大地电磁探测剖面(万战生等,2010); ⑦为川滇菱形块体北部和南部的四条剖面(Bai et al., 2010); ⑧为云南南部孟连—罗平大地电磁测深剖面(李冉等,2014); ⑨为云南兰坪—贵州贵阳大地电磁测深剖面(程志远等,2015). Fig. 14 The lithospheric effective elastic thickness in the southeastern Qinghai-Tibet Plateau corresponds well to the distribution of low resistivity/high conductivity layers in the crust. Low resistivity/high conductivity layers are common in areas with weak lithospheric strength (Te < 15 km) such as the eastern part of the Bayan Har Block and the Sichuan-Yunnan rhombic block ① is the Lijiang-Panzhihua-Qiaojia magnetotelluric sounding profile (Kong et al., 1987); ② are the magnetotelluric sounding profiles across the Panxi rift zone (Ninglang-Luzhou) and the Longmenshan fault zone (Aba-Luzhou) (Li and Jin, 1987); ③ are the magnetotelluric sounding profiles in Western Yunnan (Sun et al., 1989); ④ are magnetotelluric sounding profiles in the northern part of the Sichuan-Yunnan rhombic block (Sun et al., 2003); ⑤ is Luqu-Zoige-Beichuan-Zhongjiang magnetotelluric profile across the Longmenshan fault zone (Wang et al., 2009); ⑥ are Mianning-Yibin and Shimian-Leshan magnetotelluric sounding profiles (Wan et al., 2010); ⑦ are the four profiles of northern and southern Sichuan-Yunnan rhombic blocks (Bai et al., 2010); ⑧ is the Menglian-Luoping magnetotelluric sounding profile in southern Yunnan (Li et al., 2014); ⑨ is Lanping-Guiyang magnetotelluric sounding profile, from Yunnan to Guizhou Province (Cheng et al., 2015). |
川滇菱形块体中部沿丽江—小金河断裂带的木里—冕宁—石棉一带有效弹性厚度发生了较大变化,由西部的约0~10 km增大至东部的约10~30 km,显示此处可能是岩石圈结构发生变化的部位.从地貌上看,此处也是川滇菱形块体出现高程陡变的部位.
羌塘块体东部玉树—德格附近地区岩石圈有效弹性厚度大于40 km,与周边岩石圈强度差别明显且内部5级以上强震较周围地区少,说明其可能是高原形成过程中的“克拉通”残留.
滇南地区(保山、大理、楚雄以南)岩石圈强度大于川滇菱形块体中北部,有效弹性厚度从川滇菱形块体内部的 < 5 km,增大至南部的10~30 km.
此外,川滇菱形块体与巴颜喀拉块体东部的岩石圈有效弹性厚度分布特征也有不同.巴颜喀拉块体东部地区仅在若尔盖—松潘—丹巴等局部地区的岩石圈有效弹性厚度小于10 km,而川滇菱形块体则是自北部至滇西、滇东等地均显示有效弹性厚度小于10 km.地震波速度结构的研究也表明巴颜喀拉块体东部地壳内低速层速度值不太低,分布范围也局限于局部地区,与川滇菱形块体明显不同(Zhang et al., 2009;Wang et al., 2010;王苏等,2015).壳内高导层目前也仅在若尔盖—松潘(王绪本等,2009)、阿坝—理县(李立和金国元,1987)等局部地区有发现.
从地震震源深度看(图 11、图 12),青藏高原地区地震主要发生在中上地壳(5~20 km),而且除龙门山断裂带等块体边界带外,发震深度一般小于15 km.从图 8a和图 12看,5级以上强震主要发生在岩石强度较弱的地区(Te < 20 km),而7级以上大震几乎都发生在活动地块边界.这可能意味着青藏高原东南缘中、下地壳因具有一定“可塑性”而不易积累构造应力,同时地壳深浅部的相互作用对地表断裂带的发育和地震的发生有重要影响.
3.3 Te与下地壳流新生代(~50 Ma)以来印度与欧亚大陆的陆-陆碰撞造成了青藏高原的剧烈隆升和地壳增厚,深刻影响了中国大陆的构造环境(Molnar and Tapponnier, 1975;England and Molnar, 1997).GNSS观测表明,青藏高原地壳正经历南北向的连续缩短和东向侧向挤出运动(Wang et al., 2001;Zhang et al., 2004).向东运动的高原地壳受阿拉善、鄂尔多斯、华南等坚硬地块的阻挡,造成高原东缘持续隆升(Liang et al., 2013; 王庆良等,2008;Hao et al., 2014),以及川滇地区的顺时针旋转运动(Gan et al., 2007).
数十年来,对于青藏高原内部形变和侧向挤出模式主要发展了“刚性块体挤出模式”(Tapponnier and Molnar, 1976;Avouac and Tapponnier, 1993;Replumaz and Tapponnier, 2003;Chen et al., 2004)和“下地壳流模式”(Royden et al, 1997; England and Molnar, 1997;Beaumont et al., 2001;Klemperer,2006;Royden et al., 2008).“下地壳流模式”认为高原中下地壳是软弱的,青藏高原东缘地壳的增厚和缩短最可能发生于中下地壳(Clark and Royden, 2000;Clark et al., 2005;Schoenbohm et al., 2006).由于能够较好地解释地表观测到的地壳形变特征,“下地壳流模式”得到了较广泛的支持.
地震学(王椿镛等, 2007, 2008, 2015;Yao et al., 2010;Bao et al., 2015;王苏等,2015;Wang et al., 2018)和大地电磁(孙洁等,2003;王绪本等,2009;Bai et al., 2010)等观测研究表明青藏高原东南缘中下地壳存在低速和高导/低阻层,支持了中下地壳流的存在,且其分布可能受到断裂带的制约.杨文采等(2015)根据重力场小波多尺度分析结果指出青藏高原下地壳低密度物质侧向挤出的路径之一是从高原南缘理塘到大理.
本文3.2节的分析表明,岩石圈强度小(Te < 15 km)的地区与壳内低速、高导/低阻层存在很好的对应关系,显示其内部可能存在下地壳流,而岩石圈强度大(Te>20 km)的地区地壳结构相对稳定,可能对下地壳流形成阻滞,如图 13、14所示.
图 13中,AA′、BB′为接收函数和面波联合反演的S波速度剖面(Liu et al., 2014),AA′剖面上鲜水河断裂带以西地区存在深度20~40 km的低速层,鲜水河断裂带至龙门山断裂带之间低速层变浅、变薄,四川盆地地壳无深部低速层,BB′剖面下的壳内低速层则从鲜水河断裂带向南延伸,跨过丽江—小金河断裂带至滇中地区;CC′、DD′为面波层析成像S波速扰动剖面(Yao et al., 2010),CC′剖面自西北至东南均存在壳内低速层,且深度逐渐变浅,DD′剖面下也普遍存在低速层,自北向南深度呈减小趋势;EE′为远震P波接收函数反演方法获得的S波速度结构剖面(王椿镛等,2008;Wang et al., 2010),自羌塘块体至巴颜喀拉块体东部地壳30~60 km深度范围内普遍存在低速异常,而四川盆地下则属于正常的速度分布;FF′为跨龙门山的深地震宽角反/折射测深剖面(嘉世旭等,2014),川西北高原下地壳介质速度大幅降低,而四川盆地地壳结构稳定.
图 14中,①为丽江—攀枝花—巧家大地电磁测深剖面(孔祥儒等,1987),地壳约33 km深处有厚度为5~12 km的低阻层,且埋深自西向东逐渐变浅;②为横跨攀西裂谷带(宁蒗—泸州)和龙门山断裂带(阿坝—泸州)大地电磁测深剖面(李立和金国元,1987),在两处剖面的断裂带西部均发现了埋藏深度11~37 km,厚度5.5~11 km的壳内低阻层,但在阿坝—泸州剖面的灌县一带低阻层消失,而在宁蒗—泸州剖面的西昌一带低阻层变浅、变薄;③为滇西地区大地电磁测深剖面(孙洁等,1989),发现普遍存在埋深几到二十几公里的地壳内低阻层;④为川滇菱形块体北部大地电磁测深剖面(孙洁等,2003),发现川滇菱形块体北部地区十几公里下存在大规模低阻体;⑤为跨龙门山断裂带的碌曲—若尔盖—北川—中江大地电磁剖面(王绪本等,2009),巴颜喀拉东部存在西倾连续展布的壳内低阻层;⑥为冕宁—宜宾、石棉—乐山大地电磁探测剖面(万战生等,2010),发现康滇地轴和大凉山地块地壳中存在向上拱起的高导层,顶面埋深为10~15 km,最浅处不足10 km,厚度大约15~25 km,可能与岩石的部分熔融有关,而四川盆地中下地壳不存在高导层;⑦为川滇菱形块体北部和南部的四条剖面(Bai et al., 2010),发现沿嘉黎—怒江断裂带、鲜水河—小江断裂带等有埋深20~40 km的壳内高导层;⑧为云南南部孟连—罗平大地电磁测深剖面(李冉等,2014),低阻层分布与大断裂关系密切,主要分布在孟连—普洱、建水等地区,也为岩石圈有效弹性厚度的低值区;⑨为云南兰坪—贵州贵阳大地电磁测深剖面(程志远等,2015),川滇菱形块体中西部存在下地壳低阻层,川滇菱形块体东部和华南块体西部存在中上地壳的低阻层.
综上所述,根据本文计算的青藏高原东南缘岩石圈有效弹性厚度分布,并结合前人地震学、大地电磁等方面的研究成果,推测认为青藏高原物质侧向挤出后受四川盆地阻挡,在理塘—稻城—丽江等地区形成堆积(表现为突出的地表地形和地壳内部大范围的低速、高导层),少部分物质可能穿过鲜水河断裂带的康定—道孚地区向北运动,但大部分物质向南运动,在受到滇南块体阻挡后一支流向西南的腾冲方向,另一支流向东南的攀枝花—东川方向,如图 13、14中红色箭头所示.
4 结论本文采用有限差分方法,利用EIGEN6C4布格重力异常和SIO V15.1地形数据,计算了青藏高原东南缘的岩石圈有效弹性厚度,结合地震学、大地电磁等观测和研究成果分析了其构造意义,并探讨了研究区域下地壳流的分布形态和运动方向问题.得到如下结论:
(1) 有限差分方法是计算岩石圈有效弹性厚度的有效方法.本文的计算结果揭示了青藏高原东南缘岩石圈有效弹性厚度的区域变化特征,表明:研究区域岩石圈有效弹性厚度为0~100 km,四川盆地和喜马拉雅东构造结两处岩石圈有效弹性厚度最大,达50~100 km;巴颜喀拉块体东部岩石圈有效弹性厚度为0~20 km,在龙门山断裂带西侧有局部低值区;川滇菱形块体大部及滇西、滇东等地区岩石圈有效弹性厚度小于10 km;羌塘块体东部的玉树—德格附近地区岩石圈有效弹性厚度大于40 km;滇南地区岩石圈有效弹性厚度显著大于滇北.
(2) 对比岩石圈有效弹性厚度、地壳厚度和震源深度,并结合地震学、大地电磁等观测和研究结果分析认为,青藏高原东南缘岩石圈有效弹性厚度与壳幔结构关系密切:四川盆地和喜马拉雅东构造结内部壳幔结构稳定,因此岩石圈强度大,对川滇地区物质旋转运动形成阻挡、夹持作用;巴颜喀拉块体东部、川滇菱形块体大部、滇西等地区岩石圈有效弹性厚度小,相应地存在壳内低速、高导层,推测可能存在岩石的熔融软化,使得岩石圈强度大为减弱.
(3) 结合本文岩石圈有效弹性厚度计算结果和前人中下地壳低速、高导层研究成果,认为青藏高原东南缘下地壳流主要分布在川滇菱形块体、滇西、滇东等地区,其流向自北部理塘地区向南,尔后在滇南块体阻挡下分叉,一支流向西南的腾冲方向,另一支流向东南的攀枝花—东川方向.
Amante C, Eakins B W. 2009. ETOPO1 1 arc-minute global relief model: procedures, data sources and analysis. Technical Memorandum NESDIS, NGDC-24, NOAA, Washington, DC.
|
An M J, Shi Y L. 2006. Review on lithospheric thickness research of the Chinese continent. Earth Science Frontiers (in Chinese), 13(3): 23-30. |
Avouac J P, Tapponnier P. 1993. Kinematic model of active deformation in central Asia. Geophysical Research Letters, 20(10): 895-898. DOI:10.1029/93GL00128 |
Bai D H, Unsworth M J, Meju M A, et al. 2010. Crustal deformation of the eastern Tibetan plateau revealed by magnetotelluric imaging. Nature Geoscience, 3(5): 358-362. DOI:10.1038/ngeo830 |
Bao X W, Sun X X, Xu M J, et al. 2015. Two crustal low-velocity channels beneath SE Tibet revealed by joint inversion of Rayleigh wave dispersion and receiver functions. Earth and Planetary Science Letters, 415: 16-24. DOI:10.1016/j.epsl.2015.01.020 |
Beaumont C, Jamiesont R A, Nguyen M H, et al. 2001. Himalayan tectonics explained by extrusion of a low-viscosity crustal channel coupled to focused surface denudation. Nature, 414(6865): 738-742. DOI:10.1038/414738a |
Biancale R. 2011. EIGEN-6-The new combined global gravity field model including GOCE from the collaboration of GFZ Potsdam and GRGS Toulouse. Archives of General Psychiatry, 36(6): 720-720. |
Braitenberg C, Wang Y, Fang J, et al. 2003. Spatial variations of flexure parameters over the Tibet-Qinghai plateau. Earth and Planetary Science Letters, 205(3-4): 211-224. DOI:10.1016/S0012-821X(02)01042-7 |
Burov E B, Diament M. 1995. The effective elastic thickness (Te) of continental lithosphere: what does it really mean? Journal of Geophysical Research: Solid Earth, 100(B3): 3905-3927.
|
Chen B. 2013. The effective elastic thickness over China and surroundings and its lithosphere dynamic implication[Ph. D. thesis] (in Chinese). Wuhan: China University of Geosciences (Wuhan).
|
Chen B, Liu J X, Kaban M K, et al. 2014. Elastic thickness, mechanical anisotropy and deformation of the southeastern Tibetan Plateau. Tectonophysics, 637: 45-56. DOI:10.1016/j.tecto.2014.09.007 |
Chen Q Z, Freymueller J T, Wang Q, et al. 2004. A deforming block model for the present-day tectonics of Tibet. Journal of Geophysical Research:Solid Earth, 109(B1). DOI:10.1029/2002JB002151 |
Chen Q. 2015. The lithosphere effective elastic thickness and its tectonic significance in central-northern segment of North-South tectonic belt and adjacent[Ph. D. thesis] (in Chinese). Xi'an: Northwest University.
|
Cheng Y Z, Tang J, Chen X B, et al. 2015. Electrical structure and seismogenic environment along the border region of Yunnan, Sichuan and Guizhou in the south of the North-South seismic belt. Chinese Journal of Geophysics (in Chinese), 58(11): 3965-3981. DOI:10.6038/cjg20151107 |
Clark M K, Royden L H. 2000. Topographic ooze:building the eastern margin of Tibet by lower crustal flow. Geology, 28(8): 703-706. DOI:10.1130/0091-7613(2000)28<703:TOBTEM>2.0.CO;2 |
Clark M K, Bush J W M, Royden L H. 2005. Dynamic topography produced by lower crustal flow against rheological strength heterogeneities bordering the Tibetan Plateau. Geophysical Journal International, 162(2): 575-590. DOI:10.1111/j.1365-246X.2005.02580.x |
England P, Molnar P. 1997. The field of crustal velocity in Asia calculated from Quaternary rates of slip on faults. Geophysical Journal International, 130(3): 551-582. DOI:10.1111/j.1365-246X.1997.tb01853.x |
Feng J K, Wang Q B, Huang J X, et al. 2017. The accuracy analysis of multiple ultra-high-degree gravity field models. Journal of Geomatics Science and Technology (in Chinese), 34(4): 359-363. |
Fielding E J, McKenzie D. 2012. Lithospheric flexure in the Sichuan Basin and Longmen Shan at the eastern edge of Tibet. Geophysical Research Letters, 39(9). DOI:10.1029/2012GL051680 |
Förste C, Bruinsma S L, Abrikosov O, et al. 2014. EIGEN-6C4: The latest combined global gravity field model including GOCE data up to degree and order 2190 of GFZ Potsdam and GRGS Toulouse. GFZ Data Services, doi: 10.5880/ICGEM.2015.1.
|
Forsyth D W. 1985. Subsurface loading and estimates of the flexural rigidity of continental lithosphere. Journal of Geophysical Research:Solid Earth, 90(B14): 12623-12632. DOI:10.1029/JB090iB14p12623 |
Gan W J, Zhang P Z, Shen Z K, et al. 2007. Present-day crustal motion within the Tibetan Plateau inferred from GPS measurements. Journal of Geophysical Research:Solid Earth, 112(B8). DOI:10.1029/2005JB004120 |
Hao M, Wang Q L, Shen Z K, et al. 2014. Present day crustal vertical movement inferred from precise leveling data in eastern margin of Tibetan plateau. Tectonophysics, 632: 281-292. DOI:10.1016/j.tecto.2014.06.016 |
Hu J F, Hu Y L, Xia J Y, et al. 2008. Crust-mantle velocity structure of S wave and dynamic process beneath Burma Arc and its adjacent regions. Chinese Journal of Geophysics (in Chinese), 51(1): 140-148. |
Jia S X, Liu B J, Xu Z F, et al. 2014. The crustal structures of the central Longmenshan along and its margins as related to the seismotectonics of the 2008 Wenchuan Earthquake. Science China Earth Sciences, 57(4): 777-790. |
Jiang X D, Li D Y, Gong W, et al. 2014. Differential deformation and uplift mechanisms of the eastern and western Tibetan plateau. Chinese Journal of Geophysics (in Chinese), 57(12): 4016-4028. DOI:10.6038/cjg20141214 |
Jiao S Q, Jin Z M. 1996. Effective elastic thickness of continental lithosphere and its geodynamical significance. Geological Science and Technology Information (in Chinese), 15(2): 8-12. |
Jordan T A, Watts A B. 2005. Gravity anomalies, flexure and the elastic thickness structure of the India-Eurasia collisional system. Earth and Planetary Science Letters, 236(3-4): 732-750. DOI:10.1016/j.epsl.2005.05.036 |
Kirby J F, Swain C J. 2011. Improving the spatial resolution of effective elastic thickness estimation with the fan wavelet transform. Computers & Geosciences, 37(9): 1345-1354. |
Kirby J F. 2014. Estimation of the effective elastic thickness of the lithosphere using inverse spectral methods:the state of the art. Tectonophysics, 631: 87-116. DOI:10.1016/j.tecto.2014.04.021 |
Klemperer S L. 2006. Crustal flow in Tibet:geophysical evidence for the physical state of Tibetan lithosphere, and inferred patterns of active flow. Geological Society, London, Special Publications, 268(1): 39. DOI:10.1144/GSL.SP.2006.268.01.03 |
Kong X R, Liu S J, Dou Q C, et al. 1987. Electrical conductivity structure in the crust and upper mantle in the region of Panxi rift. Chinese Journal of Geophysics (Acta Geophysica Sinica) (in Chinese), 30(2): 136-143. |
Li L, Jin G Y. 1987. Telluric electromagnetic sounding study of crust and upper mantle in the Panxi "rift zone" and the Longmenshan faulted zone. Geophysical & Geochemical Exploration (in Chinese), 11(3): 161-169. |
Li R, Tang J, Dong Z Y, et al. 2014. Deep electrical conductivity structure of the southern area in Yunnan Province. Chinese Journal of Geophysics (in Chinese), 57(4): 1111-1122. DOI:10.6038/cjg20140409 |
Li Y D, Zheng Y, Xiong X, et al. 2013. Lithospheric effective elastic thickness and its anisotropy in the northeast Qinghai-Tibet plateau. Chinese Journal of Geophysics (in Chinese), 56(4): 1132-1145. DOI:10.6038/cjg20130409 |
Liang S M, Gan W J, Shen C Z, et al. 2013. Three-dimensional velocity field of present-day crustal motion of the Tibetan Plateau derived from GPS measurements. Journal of Geophysical Research:Solid Earth, 118(10): 5722-5732. DOI:10.1002/2013JB010503 |
Liu Q Y, Van Der Hilst R D, Li Y, et al. 2014. Eastward expansion of the Tibetan Plateau by crustal flow and strain partitioning across faults. Nature Geoscience, 7(5): 361-365. DOI:10.1038/ngeo2130 |
Lou H, Wang C Y, Lv Z Y, et al. 2008. Deep tectonic setting of the 2008 Wenchuan MS8. 0 earthquake in southwestern China:joint analysis of teleseismic P-wave receiver functions and Bouguer gravity anomalies. Science in China Series D:Earth Sciences, 52(2): 166-179. |
McKenzie D, Fairhead J D. 1997. Estimates of the effective elastic thickness of the continental lithosphere from Bouguer and free air gravity anomalies. Journal of Geophysical Research:Solid Earth, 102(B12): 27523-27552. DOI:10.1029/97JB02481 |
McNutt M. 1979. Compensation of oceanic topography:An application of the response function technique to the Surveyor area. Journal of Geophysical Research:Solid Earth, 84(B13): 7589-7598. DOI:10.1029/JB084iB13p07589 |
Molnar P M, Tapponnier P. 1975. Cenozoic tectonics of Asia:effects of a continental collision. Science, 189(4201): 419-426. DOI:10.1126/science.189.4201.419 |
Replumaz A, Tapponnier P. 2003. Reconstruction of the deformed collision zone between India and Asia by backward motion of lithospheric blocks. Journal of Geophysical Research:Solid Earth, 108(B6): 2285. DOI:10.1029/2001JB000661 |
Royden L H, Burchfiel B C, King R W, et al. 1997. Surface deformation and lower crustal flow in eastern Tibet. Science, 276(5313): 788-790. DOI:10.1126/science.276.5313.788 |
Royden L H, Burchfiel B C, Van Der Hilst R D. 2008. The Geological evolution of the Tibetan Plateau. Science, 321(5892): 1054-1058. DOI:10.1126/science.1155371 |
Schoenbohm L M, Burchfiel B C, Chen L Z. 2006. Propagation of surface uplift, lower crustal flow, and Cenozoic tectonics of the southeast margin of the Tibetan Plateau. Geology, 34(10): 813-816. DOI:10.1130/G22679.1 |
Simons F J, Zuber M T, Korenaga J. 2000. Isostatic response of the Australian lithosphere:estimation of effective elastic thickness and anisotropy using multitaper spectral analysis. Journal of Geophysical Research:Solid Earth, 105(B8): 19163-19184. DOI:10.1029/2000JB900157 |
Sun J, Xu C F, Jiang Z, et al. 1989. The electrical structure of the crust and upper mantle in the west part of Yunnan province and its relation to crustal tectonics. Seismology and Geology (in Chinese), 11(1): 35-45. |
Tapponnier P, Molnar P. 1976. Slip-line field theory and large-scale continental tectonics. Nature, 264(25): 319-324. |
Turcotte D, Schubert G. 2014. Geodynamics. Cambridge: Cambridge University Press.
|
Van Wees J D, Cloetingh S. 1994. A finite-difference technique to incorporate spatial variations in rigidity and planar faults into 3-D models for lithospheric flexure. Geophysical Journal International, 117(1): 179-195. DOI:10.1111/j.1365-246X.1994.tb03311.x |
Walcott R I. 1970a. Flexural rigidity, thickness, and viscosity of the lithosphere. Journal of Geophysical Research, 75(20): 3941-3953. DOI:10.1029/JB075i020p03941 |
Walcott R I. 1970b. Flexure of the lithosphere at Hawaii. Tectonophysics, 9(5): 435-446. DOI:10.1016/0040-1951(70)90056-9 |
Walcott R I. 1970c. Isostatic response to loading of the crust in Canada. Canadian Journal of Earth Sciences, 7(2): 716-727. DOI:10.1139/e70-070 |
Wan Z S, Zhao G Z, Tang J, et al. 2010. The electrical structure of the crust along Mianning-Yibin profile in the eastern edge of Tibetan plateau and its tectonic implications. Chinese Journal of Geophysics (in Chinese), 53(3): 585-594. DOI:10.3969/j.issn.0001-5733.2010.03.012 |
Wang C Y, Lou H, Lv Z Y, et al. 2008. S-wave crustal and upper mantle's velocity structure in the eastern Tibetan Plateau-deep environment of lower crustal flow. Science in China Series D:Earth Sciences, 51(2): 263-274. DOI:10.1007/s11430-008-0008-5 |
Wang C Y, Lou H, Silver P G, et al. 2010. Crustal structure variation along 30°N in the eastern Tibetan Plateau and its tectonic implications. Earth and Planetary Science Letters, 289(3-4): 367-376. DOI:10.1016/j.epsl.2009.11.026 |
Wang C Y, Yang W C, Wu J P, et al. 2015. Study on the lithospheric structure and earthquakes in North-South tectonic belt. Chinese Journal of Geophysics (in Chinese), 58(11): 3867-3901. DOI:10.6038/cjg20151101 |
Wang Q, Zhang P Z, Freymueller J T, et al. 2001. Present-day crustal deformation in china constrained by global positioning system measurements. Science, 294(5542): 574-577. DOI:10.1126/science.1063647 |
Wang Q L, Cui D X, Wang W P, et al. 2008. Present-day vertical crustal motion in Western Sichuan region. Science in China Series D:Earth Sciences (in Chinese), 38(5): 598-610. |
Wang S, Xu X Y, Hu J F. 2015. Review on the study of crustal structure and geodynamic models for the southeast margin of the Tibetan Plateau. Chinese Journal of Geophysics (in Chinese), 58(11): 4235-4253. DOI:10.6038/cjg20151129 |
Wang X, Chen L, Ai Y S, et al. 2018. Crustal structure and deformation beneath eastern and northeastern Tibet revealed by P-wave receiver functions. Earth and Planetary Science Letters, 497: 69-79. DOI:10.1016/j.epsl.2018.06.007 |
Wang X B, Zhu Y T, Zhao X K, et al. 2009. Deep conductivity characteristics of the Longmen Shan, Eastern Qinghai-Tibet Plateau. Chinese Journal of Geophysics (in Chinese), 52(2): 564-571. |
Wang Y, Xu H Z. 1996. The variations of lithospheric flexural strength and isostatic compensation mechanisms beneath the continent of China and vicinity. Chinese Journal of Geophysics (Acta Geophysica Sinica) (in Chinese), 39(S1): 105-113. |
Watts A B. 2001. Isostasy and Flexure of the Lithosphere. Cambridge: Cambridge University Press.
|
Yang W C, Hou Z Z, Yu C Q. 2015. Three-dimensional density structure of the Tibetan Plateau and crustal mass movement. Chinese Journal of Geophysics (in Chinese), 58(11): 4223-4234. DOI:10.6038/cjg20151128 |
Yao H J, Van Der Hilst R D, Montagner J P. 2010. Heterogeneity and anisotropy of the lithosphere of SE Tibet from surface wave array tomography. Journal of Geophysical Research:Solid Earth, 115(12). DOI:10.1029/2009JB007142 |
Zhang P Z, Shen Z K, Wang M, et al. 2004. Continuous deformation of the Tibetan plateau from global positioning system data. Geology, 32(9): 809-812. DOI:10.1130/G20554.1 |
Zhang Z J, Wang Y H, Chen Y, et al. 2009. Crustal structure across Longmenshan fault belt from passive source seismic profiling. Geophysical Research Letters, 36(17). DOI:10.1029/2009GL039580 |
Zhao L H, Jiang X D, Jin Y, et al. 2004. Effective elastic thickness of continental lithosphere in Western China. Earth Science-Journal of China University of Geosciences (in Chinese), 29(2): 183-190. |
Zheng Y, Li Y D, Xiong X. 2012. Effective lithospheric thickness and its anisotropy in the North China Craton. Chinese Journal of Geophysics (in Chinese), 55(11): 3576-3590. DOI:10.6038/j.issn.0001-5733.2012.11.007 |
安美建, 石耀霖. 2006. 中国大陆岩石圈厚度分布研究. 地学前缘, 13(3): 23-30. DOI:10.3321/j.issn:1005-2321.2006.03.005 |
陈波. 2013.中国及邻区岩石圈有效弹性厚度及其动力学意义[博士论文].武汉: 中国地质大学.
|
陈青. 2015.南北构造带中北段及其邻区岩石圈有效弹性厚度及构造意义[博士论文].西安: 西北大学.
|
程志远, 汤吉, 陈小斌, 等. 2015. 南北地震带南段川滇黔接壤区电性结构特征和孕震环境. 地球物理学报, 58(11): 3965-3981. DOI:10.6038/cjg20151107 |
冯进凯, 王庆宾, 黄佳喜, 等. 2017. 多个超高阶重力场模型精度分析. 测绘科学技术学报, 34(4): 358-363. |
郝天珧, 胡卫剑, 邢健, 等. 2014. 中国海陆1:500万莫霍面深度图及其所反映的地质内涵. 地球物理学报, 57(12): 3869-3883. DOI:10.6038/cjg20141202 |
胡家富, 胡毅力, 夏静瑜, 等. 2008. 缅甸弧及邻区的壳幔S波速度结构与动力学过程. 地球物理学报, 51(1): 140-148. DOI:10.3321/j.issn:0001-5733.2008.01.018 |
嘉世旭, 刘保金, 徐朝繁, 等. 2014. 龙门山中段及两侧地壳结构与汶川地震构造. 中国科学:地球科学, 44(3): 497-509. |
姜效典, 李德勇, 宫伟, 等. 2014. 青藏高原东西向差异形变与隆升机制. 地球物理学报, 57(12): 4016-4028. DOI:10.6038/cjg20141214 |
焦述强, 金振民. 1996. 大陆岩石圈有效弹性厚度研究及其动力学意义. 地质科技情报, 15(2): 8-12. |
孔祥儒, 刘士杰, 窦秦川, 等. 1987. 攀西地区地壳和上地幔中的电性结构. 地球物理学报, 30(2): 136-143. DOI:10.3321/j.issn:0001-5733.1987.02.004 |
李立, 金国元. 1987. 攀西裂谷带及龙门山断裂带地壳上地幔的大地电磁测深研究. 物探与化探, 11(3): 161-169. |
李冉, 汤吉, 董泽义, 等. 2014. 云南南部地区深部电性结构特征研究. 地球物理学报, 57(4): 1111-1122. DOI:10.6038/cjg20140409 |
李永东, 郑勇, 熊熊, 等. 2013. 青藏高原东北部岩石圈有效弹性厚度及其各向异性. 地球物理学报, 56(4): 1132-1145. DOI:10.6038/cjg20130409 |
楼海, 王椿镛, 吕智勇, 等. 2008. 2008年汶川MS8. 0级地震的深部构造环境——远震P波接收函数和布格重力异常的联合解释.中国科学D辑:地球科学, 38(10): 1207-1220. |
孙洁, 徐常芳, 江钊, 等. 1989. 滇西地区地壳上地幔电性结构与地壳构造活动的关系. 地震地质, 11(1): 35-45. |
孙洁, 晋光文, 白登海, 等. 2003. 青藏高原东缘地壳、上地幔电性结构探测及其构造意义. 中国科学(D辑), 33(Z1): 173-180. |
万战生, 赵国泽, 汤吉, 等. 2010. 青藏高原东边缘冕宁-宜宾剖面电性结构及其构造意义. 地球物理学报, 53(3): 585-594. DOI:10.3969/j.issn.0001-5733.2010.03.012 |
王椿镛, 常利军, 吕智勇, 等. 2007. 青藏高原东部上地幔各向异性及相关的壳幔耦合型式. 中国科学(D辑):地球科学, 37(4): 495-503. |
王椿镛, 楼海, 吕智勇, 等. 2008. 青藏高原东部地壳上地幔S波速度结构-下地壳流的深部环境. 中国科学(D辑):地球科学, 38(2): 22-32. |
王椿镛, 杨文采, 吴建平, 等. 2015. 南北构造带岩石圈结构与地震的研究. 地球物理学报, 58(11): 3867-3901. DOI:10.6038/cjg20151101 |
王庆良, 崔笃信, 王文萍, 等. 2008. 川西地区现今垂直地壳运动研究. 中国科学(D辑):地球科学, 38(5): 598-610. |
王苏, 徐晓雅, 胡家富. 2015. 青藏高原东南缘的地壳结构与动力学模式研究综述. 地球物理学报, 58(22): 4235-4253. DOI:10.6038/cjg20151129 |
王绪本, 朱迎堂, 赵锡奎, 等. 2009. 青藏高原东缘龙门山逆冲构造深部电性结构特征. 地球物理学报, 52(2): 564-571. |
王勇, 许厚泽. 1996. 中国大陆及其邻区岩石层挠曲强度变化和均衡补偿机制. 地球物理学报, 39(S1): 105-113. |
杨文采, 侯遵泽, 于常青. 2015. 青藏高原地壳的三维密度结构和物质运动. 地球物理学报, 58(11): 4223-4234. DOI:10.6038/cjg20151128 |
赵俐红, 姜效典, 金煜, 等. 2004. 中国西部大陆岩石圈的有效弹性厚度研究. 地球科学——中国地质大学学报, 29(2): 183-190. |
郑勇, 李永东, 熊熊. 2012. 华北克拉通岩石圈有效弹性厚度及其各向异性. 地球物理学报, 55(11): 3576-3590. DOI:10.6038/j.issn.0001-5733.2012.11.007 |