2. 中国科学院大学地球与行星科学学院, 北京 100049
2. College of Earth and Planetary Sciences, University of Chinese Academy of Sciences, Beijing 100049, China
从几百米至数公里的浅层三维地震S波速度结构对场地分类、强地面震动模拟建模等防震减灾工作非常重要(王伟君等,2012;罗磊等,2019),而且还能反映浅部岩石岩性界面或地层不整合等,为深部矿产资源调查提供依据.此外,浅层速度结构变化信息可以为页岩气工业开采提供参考,规避地下注水诱发地震的潜在风险(Lee et al., 2019).
地震学中通常采用主动源探测或被动源成像的方法获取地下浅层速度结构.主动源探测是浅部结构重建的主要方法,通常利用人工震源激发的折射或反射地震波对地下浅层结构进行高分辨率成像(Bruno and Martillier, 2000;Kearey et al., 2002;Bichler et al., 2004;王伟涛等,2009).但是,该方法价格较贵,而且因为需要破坏性爆破震源而不够环保.相比之下,被动源成像通过地震仪记录到的各种地震波的走时或者波形信息来反演地下速度结构,能够克服主动源成像的弱点,比如地震Rayleigh波成像方法等.传统的地震面波成像利用Rayleigh波或Love波的频散数据来得到S波速度结构,容易受到地震事件和台站分布不均匀或高频面波的强烈衰减等因素的影响,使得反映浅部结构的高频信息不足.
地震背景噪声成像(Ambient Noise Tomography,ANT)是一种无源成像方法.该方法计算两个台站长时间地震噪声记录的互相关函数并叠加,并将其结果近似为这两个台站之间的经验格林函数以获得面波传播信息(Shapiro and Campillo, 2004).随着地震台站数量的增多,地震背景噪声成像方法广泛应用于不同尺度的地球内部结构探索中,如大陆尺度,欧洲、东亚、北美等(Yao et al., 2006;Yang et al., 2007;Zheng et al., 2008;Wang et al., 2017;Xie et al., 2018),区域尺度,如南加州、中国东北、华北地区等(Sabra et al., 2005;Liu et al., 2016;李玲利,2012).这些背景噪声成像工作主要使用5~100 s周期的Rayleigh波,研究地壳和上地幔顶部结构(Li et al., 2012).最近,利用背景噪声互相关方法研究浅地表速度结构的工作也取得了一些重要进展,Kang和Shin(2006)通过背景噪声成像的方法得到了韩国2~4 s的Rayleigh波群速度分布;Lin等(2013)对美国加州长滩的密集台阵进行了噪声成像,得到了1 km内的三维S波速度结构,该结构较好地对应了当地的地质结构;Li等(2016)通过ANT得到了合肥盆地0.5~2 s周期的S波速度结构.这些结果均表明地震背景噪声成像方法能够弥补传统面波成像方法对浅部结构分辨率不足的问题.
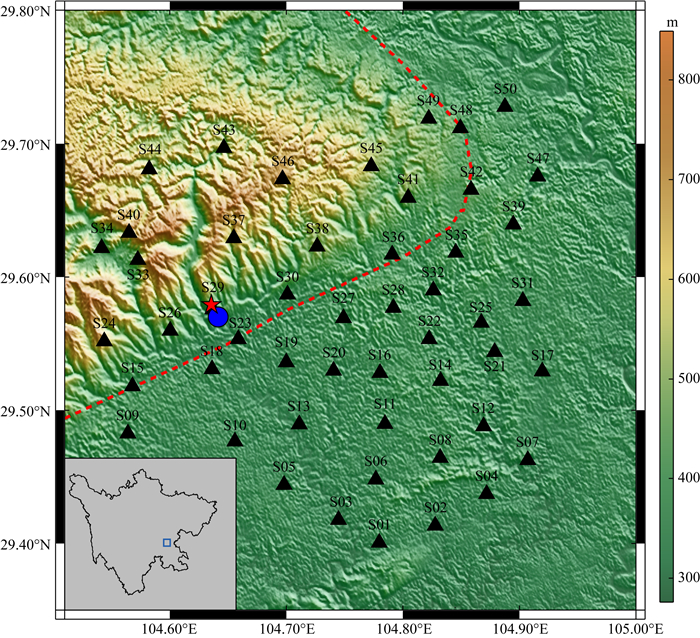
四川威远位于我国长宁—威远国家级页岩气示范区内(谢军,2018),该地区地震活动性较强,对页岩气工业开采和平台设施影响较大.例如,2016年1月7日在一口页岩气井附近发生了ML3.9地震(图 1).本文将对2015年到2016年布设在四川威远地区的50个流动台站的垂直分量连续噪声数据进行互相关计算,提取2~6 s的基阶Rayleigh波相速度频散曲线,重建该地区浅层5 km深度以内的三维S波速度结构,为相关地震研究提供输入.
|
图 1 四川威远地区地形和地震台站(黑色三角)分布图 红色五角表示2016年1月7日ML3.9地震震中位置,蓝色圆圈表示S29台站附近的一个页岩气钻井平台,红色虚线描绘了威远背斜构造的形态. Fig. 1 The topography of the Weiyuan area and distribution of seismic stations (black triangles) The red star represents the epicenter of the January 7, 2016 ML3.9 Weiyuan earthquake. The blue circle denotes a shale gas drilling platform near station S29. The tectonic morphology of the Weiyuan anticline is shown as the red dashed line. |
四川省威远县位于四川盆地低缓构造带的中南部,面积为1288 km2,地势西北高,海拔约500~800 m,东南低,海拔约300~400 m(图 1).研究区域西北部的威远构造为一巨型的穹窿背斜,长轴为北东向(朱瑜等,2010).威远背斜主要形成于新生代,在经历了加里东运动、海西运动、印支运动、燕山运动和喜马拉雅运动的叠加作用后,形成了现今的大型穹窿构造(刘顺等,2000;喻颐等,2013).其浅层构造以中生界及上古生界为主,深部构造以下古生界为主,浅层与深层构造形态几乎一致(刘顺,2001),基底为弱磁性的花岗岩类型物质(谷志东等,2013).
威远页岩气资源丰富(石强等,2017),于晚奥陶世五峰期-早志留世龙马溪期在古特提斯洋的俯冲作用下形成了富有机质的海相页岩地层(张全林等,2016),该岩层也是四川盆地页岩气开发的主要岩层(王玉满等,2012).2010年建成了威远区块的第一口页岩气井(董大忠等,2014),截至2017年5月,投入使用的页岩气井数达到了130余口,累计页岩气产量达到了40×108 m3(谢军等,2017).
为了研究该区域的浅层速度结构,我们在威远地区架设了50个短周期地震仪器,记录了2015年11月16日至2016年2月25日的连续波形数据.如图 1所示,50个流动台站密集地分布于研究区域,台间距平均在5 km左右,最大台间距为41.4 km.本次流动观测采用的地震仪器的频带范围是0.01~2 s,采样率为100 Hz,虽然仪器带宽最长周期是2 s,但是仍包含了一些更长周期的信号,可以提取大于2 s周期的频散.在50个流动台站中,台站S08和S31的数据出现问题被舍弃,其余仪器在2015年11月24日到2016年2月24日,总共93天时间段内都有连续的数据记录.
2 背景噪声数据处理我们选取了48个台站记录的垂直分量连续噪声数据进行研究,通过互相关计算获得基阶Rayleigh波的经验格林函数,然后提取相速度信息.本研究采用的数据处理步骤参考了Bensen等(2007)的数据处理流程,主要包括以下三个步骤:
第一步,单台数据预处理.首先对48个台站的原始数据去除平均值、趋势以及仪器响应,紧接着对所有台站数据进行重采样以提高计算速度.由于最终得到的互相关函数主要包含数秒周期范围内的信号,我们选取的重采样间隔为0.02 s.重采样之后,我们将原始数据裁剪为每个小时的文件并对原始数据做0.15 Hz到10 Hz的带通滤波处理,接着对数据进行时间域和频率域里的归一化处理,以削弱可能的地震事件的干扰(Bensen et al., 2007),随后在频率域对所选的滤波范围做谱白化处理.
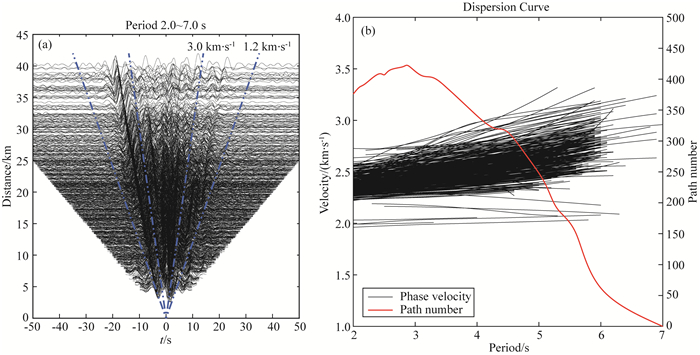
第二步,台站之间波形互相关计算.我们对两个台站记录到的小时数据进行了互相关计算,然后对所有小时数据互相关函数进行叠加以提高信噪比.本文计算了48个台的总共1128条俩俩互相关函数,并对93天的数据进行了叠加.图 2a为滤波到2.0~7.0 s信噪比较高的互相关函数结果,在正负半轴均能看到明显的基阶Rayleigh波信号(如图中蓝色虚线标出的范围),其群速度约为2 km·s-1;除了基阶Rayleigh波信号外,图中还出现了一些比较快的信号,可能为高阶面波,本文并没有对其进行深入研究.
|
图 2 (a) 2.0~7.0 s周期的噪声互相关函数, 其中对称的蓝色虚线表示群速度分别为1.2 km·s-1和3.0 km·s-1; (b) 2.0~7.0 s周期的基阶Rayleigh波相速度频散曲线(黑色实线)和每个周期的频散曲线数量(红色实线) Fig. 2 (a) Cross-correlation functions in the period of 2.0~7.0 s, the symmetric blue dashed lines are group velocities of 1.2 km·s-1 and 3.0 km·s-1, respectively; (b) Phase-velocity dispersion curves of fundamental-mode Rayleigh waves (black solid line) in the period of 2.0~7.0 s and the number of dispersion curves at each period (red solid line) |
第三步,提取频散曲线.在噪声分布比较均匀的情况下,计算得到的互相关函数正负半轴的振幅在理论上是一样的.然而图 2a中的互相关函数负半轴能量稍强,说明威远地区记录到的该频带范围内的噪声分布不均匀,为此,我们采用将互相关函数正负半轴叠加的方式,在一定程度上削弱噪声分布不均匀产生的影响(Xu et al., 2016).
随后我们利用基于多时窗的时频滤波方法(Dziewonski et al., 1969;Levshin et al., 1992;Bensen et al., 2007)来提取互相关函数的频散,由于较高频和较低频的信号来源不一致且频带间存在间断,因此这里对两个频带的信号选择分别进行带通滤波之后再进行频散曲线的提取.为了控制频散曲线的质量,这里需要考虑提取频散曲线对应的面波波长与台站间距的关系,Yao等(2011)认为台站间距大于面波信号的一倍波长即可.依此筛选规则本文提取了468条2~7 s的频散曲线,如图 2b所示.
从该频散曲线可以看出大部分相速度主要集中在2.5~3.0 km·s-1,并且一直随着周期的增加而增加,符合相速度的频散特征,在周期为7 s附近达到约3.3 km·s-1,然而也存在少部分频散曲线随着周期增加速度变化不大,并且速度主要在2.0 km·s-1. 图 2b中红色实线表示了不同周期的路径数量,周期大于6 s的路径数量不足50条,因此接下来本文只考虑2~6 s周期段的频散信息.
3 三维S波速度反演在反演三维S波速度之前,我们需要首先获得该区域的二维相速度图,而短周期面波对复杂地壳浅层结构敏感,其传播路径一般偏离大圆路径,因此这里采用考虑面波射线路径弯曲效应的快速推进面波层析成像方法(Fast Marching Surface Tomography,FMST)(Rawlinson and Sambridge, 2003)进行二维相速度的反演.
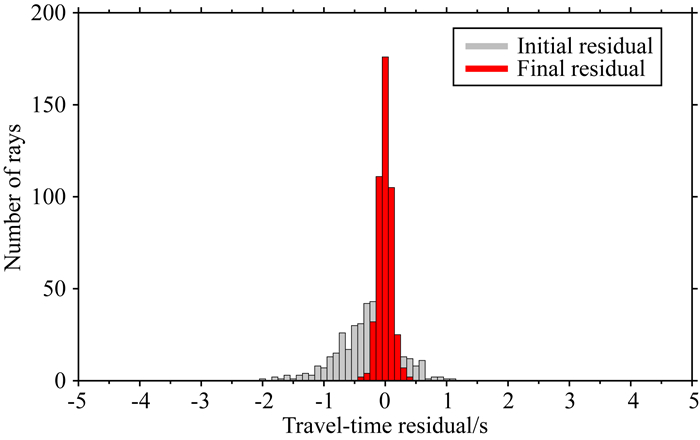
为了获得比较可信的二维相速度结构,我们需要对网格大小以及对应的周期范围进行棋盘测试,观察射线覆盖是否能够较好的恢复棋盘模型,图 3展示了不同周期的射线覆盖和网格大小选择为3 km×3 km时的棋盘测试恢复情况,可以看出对于周期为2~5 s时,大部分研究区域都能较好的恢复棋盘模型.因此,对于周期为2~5 s的频散反演,本文选择网格的大小为3 km×3 km.图 4显示了反演开始和结束时的走时残差直方图,结果表明反演后走时残差有了显著的降低,说明反演结果是可靠的;另外,影响分辨率的一个主要因素是由于噪声源分布不均,射线较多从东南指向西北方向,这在一定程度上影响了东北-西南方向上的路径约束,降低了成像分辨率.

|
图 3 反演结果分辨率的检测板测试 (a)—(e)分别为2.0 s、3.0 s、4.0 s、5.0 s和6.0 s的检测板恢复结果和射线覆盖. Fig. 3 Checkerboard resolution test of the inversion results (a)—(e) The ray coverage along with the recovered checkerboard results at 2.0 s, 3.0 s, 4.0 s, 5.0 s, and 6.0 s respectively. |
|
图 4 周期3.0 s基阶Rayleigh波反演前(灰色)、后(红色)走时残差的直方图 Fig. 4 Histogram of travel-time residuals before (gray) and after (red) the inversion for fundamental-mode Rayleigh waves with a period of 3.0 s |
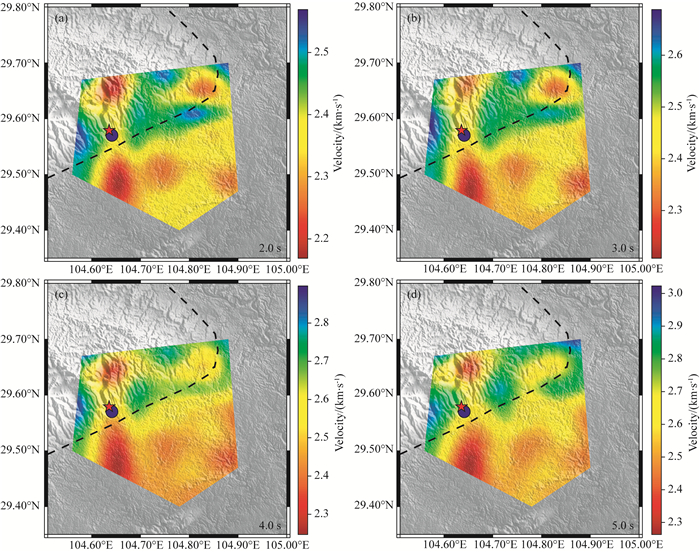
确定了二维相速度图反演的合适网格大小后,我们通过反演得到了不同周期的相速度图(图 5),周期越长的结构对应的深度越深.随着周期的增加,可以观察到该研究区域的相速度整体上有一直上升的趋势,伴随着局部有一些速度异常,这些异常体现了研究区域速度结构的横向变化.
|
图 5 不同周期的相速度图像 (a—d)分别对应于2.0 s、3.0 s、4.0 s和5.0 s的相速度图.灰色背景表示地质背景,多边形区域表示可信度较高的反演区域,黑色虚线表示威远背斜的边界.红色五角星和蓝色圆圈与图 1相同. Fig. 5 Phase velocity maps at different periods (a—d) The phase velocity maps at 2.0 s, 3.0 s, 4.0 s, and 5.0 s, respectively. The gray area shows the geological background and the polygon shows area with reliable inversion results. The boundary of the Weiyuan anticline is shown as black dashed line. The red star and the blue circle are the same as those in Fig. 1. |
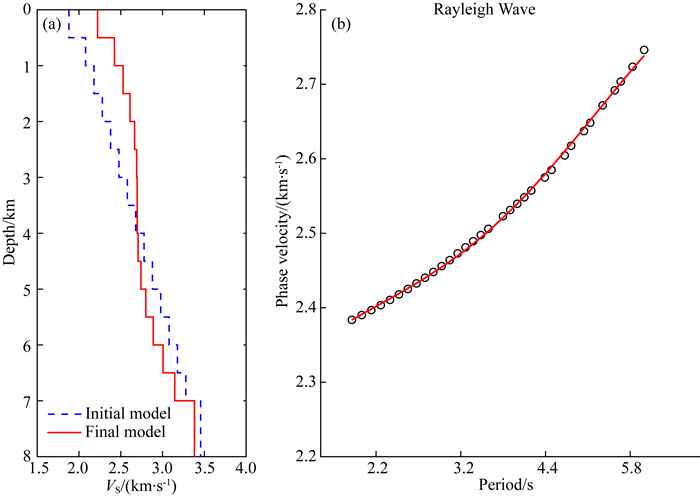
在得到了区域不同周期的二维相速度结果后,我们需要反演区域内每个网格点上的频散来获得一维S波速度结构,以此重建三维速度结构.本文首先对区域的平均频散曲线(图 6)反演得到平均一维S波速度模型,这里采用Hermann和Ammon(2002)的线性反演程序(surf96)以及给予不同层不同的反演权重(Chen et al., 2014),初始速度模型由CRUST1.0模型(Laske et al., 2013)插值得到,密度模型结合CRUST1.0以及当地的岩性资料给出(武恒志等,2019).然后以得到的平均一维S波速度为初始模型,反演得到研究区域的三维的S波速度结构(图 7).
|
图 6 (a) 反演过程中一维平均速度结构初始模型与最终模型对比图,(b)平均相速度频散(黑色圆圈)和反演得到的模型对应的频散曲线(红色实线)对比图 Fig. 6 (a) Comparison of the average 1D shear velocity model and the final inversion result. (b) Comparison of the average dispersion curve (black circles) and the forward dispersion curve of the final model (red solid line) |

|
图 7 威远地区三维S波速度结构 (a—d)分别为对应2.0 km、3.0 km、4.0 km和5.0 km深度的S波速度图像,灰色表示地质背景,多边形区域表示可信度较高的反演区域,黑色虚线表示威远背斜的边界.红色五角星和蓝色圆圈与图 1相同. Fig. 7 3D VS structures beneath the Weiyuan area (a—d) VS structures at the depth of 2.0 km, 3.0 km, 4.0 km, and 5.0 km, respectively. The gray area shows the geological background and the polygon shows area with reliable inversion results. The boundary of the Weiyuan anticline is shown as the black dashed line. The red star and the blue circle are the same as those in Fig. 1. |
为了了解不同周期的相速度对S波速度在深度上的约束效果,我们利用Herrmann和Ammon(2002)计算敏感核函数的程序srfker96,对加密的平均一维S波速度初始模型以及平均相速度频散曲线计算了不同周期的基阶Rayleigh波相速度的敏感核函数(图 8),可以看出2~5 s的S波速度成像结果能够对深度范围为1.5~5 km的结构提供较好的约束.

|
图 8 不同周期基阶Rayleigh波相速度对S波速度的深度敏感核函数(dC/db,C和b分别为相速度和S波速度) Fig. 8 Depth sensitivity kernels (dC/db, C and b are phase and shear velocities) to shear wave velocities for fundamental-mode Rayleigh wave phase velocities at different periods |
位于研究区域西北部的威远背斜形成于新生代喜山运动时期,主要的构造运动是较为强烈的挤压褶皱,造成了古老沉积地层的弯曲(徐炳高,1997).而地层的弯曲作用也使得研究区域的沉积盖层起伏变化较大,其中威远背斜内基底顶面深度约为3~4 km,研究区域东南部约为4~6 km(谷志东等,2013).地层研究结果表明,威远背斜的原始地层为古生代地层组合,其经历过古生代前寒武纪到志留纪沉积作用,再到泥盆纪抬升剥蚀作用和晚古生代二叠(P)、三叠(T)沉积作用,而后整体经历抬升作用(刘顺,2001);王贝(2017)则通过三维人工地震反射剖面分析了位于威远背斜内的岩石分层情况,地层从上到下依次是:三叠系须家河组(T3x)、雷口坡组(T2l)、嘉陵江组(T1j)以及飞仙关组(T1f),厚度约1600 m;二叠系龙潭组(P2l)以及梁山组(P1l),厚度约600 m;奥陶系五峰组(O2w),厚度约600 m;寒武系龙王庙组(ε1l),厚度约200 m;震旦系陡山沱组(Z2d),厚度约500 m.其中0~3000 m主要为页岩层,3000~3500 m主要为白云岩,而3500 m以下为黑云母花岗岩基底.
由地震背景噪声三维成像的结果(图 7)看,研究区域内S波速度在深度2.0 km以内整体较小,大部分区域介于2.2~2.7 km·s-1之间,少部分位于背斜内部的S波速度大于2.6 km·s-1;而对于深度为3.0~5.0 km的结果,背斜轮廓内大部分大于2.7 km·s-1,沉积盆地的速度在2.3~2.8 km·s-1之间.横向上分布主要为西北高东南低,这与研究区域西北高东南低的地势对应得很好,低速对应着研究区域东南部的沉积盆地区域,高速区域对应着西北部的威远背斜.此前,谢军等(2012)通过地震数据反演得到的四川盆地中部近地表S波速度约为2 km·s-1,并且随着深度逐渐增加;李建有等(2018)利用远震接收函数得到威远地区深度4 km的S波波速约为3 km·s-1.这些结果都与本文反演的S波速度结果比较接近.
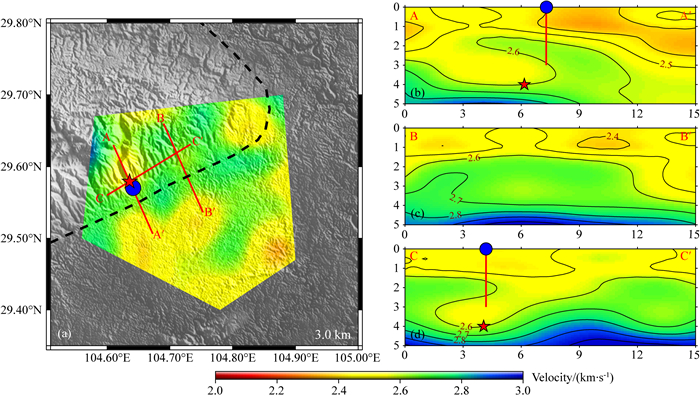
为了研究三维速度结构在深度上的变化,我们沿着AA′、BB′以及CC′三个剖面做出了对应的S波速度图(图 9),整体上S波速度随深度的增加而增大;图 9b和9c中AA′与BB′两条剖面中水平距离约10 km内是威远背斜,可以看出位于背斜分界线左右的S波速度变化趋势具有很明显的差异,威远背斜内部S波速度随着深度增加的幅度比盆地区域大,这可能与背斜内地层的弯曲作用有关.研究区域页岩的剪切模量约为10000~17000 MPa,对应的岩石密度大约为2.5 g·cm-3 (潘涛等,2016),据此可以粗略估计S波速度约为2.00~2.60 km·s-1,这与反演得到的S波速度结构有较好的对应关系.结合基底在研究区域的分布信息可以大致估计,该区域沉积盖层底部速度大约为2.6~2.7 km·s-1.因此剖面CC′(图 9d)的结果很好地给出了位于威远背斜内部沉积盖层的变化情况,可以看出位于背斜核部的沉积盖层相对更浅,这与王贝(2017)的地震剖面结果相似,体现了基底向上的抬升作用.另一方面,图 9a展示了在该区域的某一页岩气钻井平台(蓝色圆圈)以及2016年1月7日在附近发生的ML3.9地震(红色五角星),钻井平台井深约3 km,震源深度约为4 km.其中,钻井平台底部与震源位置对应的S波速度均约为2.6 km·s-1, 表明它们可能处于同一岩层内,而该深度上正好对应着松散的沉积层盖层与较为坚硬的花岗岩基底的分界处,这在一定程度上说明了页岩气钻井平台与该地震的联系.
|
图 9 AA′,BB′以及CC′剖面S波速度结构 (a)中红色实线为AA′,BB′以及CC′剖面位置; (b)(c)(d)分别为AA′,BB′以及CC′剖面0~5 km深度的S波速度结构.红色五角星和蓝色圆圈与图 1相同. Fig. 9 VS structures along the cross-sections AA′, BB′, and CC′ (a) The locations of AA′, BB′, and CC′ (red lines). (b)(c)(d) Shear wave velocity structures at the depth of 0~5 km along the AA′, BB′, and CC′ cross-sections, respectively. The red star and the blue circle are the same as those in Fig. 1. |
此外,岩石的各向异性会导致面波速度的频散依赖于波的传播方向,根据Chen等(2015)的研究,在反演介质的速度结构时加入各向异性反演能够增加反演结果的拟合度.对于威远地区的页岩层,岩石物理实验发现SV波的各向异性较小,而SH波和P波的各向异性较大(邓继新等, 2015),因此,本研究中利用Rayleigh波的频散反演SV波的速度结构并没有考虑页岩层的各向异性的影响.然而,对于威远背斜这种复杂构造背景,页岩的各向异性对反演结果的影响还需要进一步评估.为了得到更精确的速度结构信息,加入页岩层的各向异性信息能够获得更为准确的速度结构.
5 结论本文利用背景噪声成像方法处理了2015年11月到2016年2月布设在四川威远地区的50个流动台站的连续波形数据,提取了2~6 s的基阶Rayleigh波相速度频散曲线,并据此重建了研究区域5 km深度以内的三维S波速度结构.其中深度2 km以内的S波速度值整体较小,大部分区域介于2.0~2.7 km·s-1之间,少部分位于背斜内部的S波速度大于2.6 km·s-1;而对于深度为3.0~5.0 km的结果,背斜轮廓内大部分大于2.7 km·s-1,沉积盆地的速度在2.3~2.8 km·s-1之间,速度分布很好地对应了威远背斜与沉积盆地的结构,这表明了威远背斜构造中古老沉积地层的弯曲作用.从纵剖面结果来看,速度随深度有逐渐增大的趋势,位于威远背斜内的剖面显示速度随深度变化较背斜外更快,推测可能是背斜内的花岗岩基底岩层更浅导致;此外,S29台站附近的钻井底部与2016年1月7日威远ML3.9地震的震源位置可能在同一岩层内,并且都处于松散的沉积盖层与较为坚硬的花岗岩基底的分界处,推测它们之间可能存在一定的联系,确切的关系需要在接下来的工作中结合钻井平台位置、S波速度结构与地震震源参数进行综合研究.
Bensen G D, Ritzwoller M H, Barmin M P, et al. 2007. Processing seismic ambient noise data to obtain reliable broad-band surface wave dispersion measurements. Geophysical Journal of the Royal Astronomical Society, 169(3): 1239-1260. DOI:10.1111/j.1365-246X.2007.03374.x |
Bichler A, Bobrowsky P, Best M, et al. 2004. Three-dimensional mapping of a landslide using a multi-geophysical approach:the Quesnel Forks landslide. Landslides, 1(1): 29-40. DOI:10.1007/s10346-003-0008-7 |
Bruno F, Martillier F. 2000. Test of high-resolution seismic reflection and other geophysical techniques on the Boup Landslide in the Swiss Alps. Surveys in Geophysics, 21(4): 335-350. |
Cao C H, Zhang M J, Tang Q Y, et al. 2016. Geochemical Characteristics and Implications of Shale Gas in Longmaxi Formation, Sichuan Basin, China. Natural Gas Geoscience, 26(8): 1604-1612. |
Chen H P, Zhu L B, Wang Q D, et al. 2014. S-wave velocity structure of the North China from inversion of Rayleigh wave phase velocity. Journal of Asian Earth Sciences, 88: 178-191. |
Chen H P, Zhu L B, Ye Q D, et al. 2015. Azimuthal anisotropy of the crust and uppermost mantle in northeast north china craton from inversion of Rayleigh wave phase velocity. Geophysical Journal International, 202(1): 624-639. |
Deng J X, Wang H, Zhou H, et al. 2015. Microtexture, seismic rock physical properties and modeling of Longmaxi formation shale. Chinese Journal of Geophysics (in Chinese) (in Chinese), 58(6): 2123-2136. |
Deng Y, Zeng Q C, Chen S, et al. 2019. Seismic quantitative prediction method and application of TOC content in Wufeng-Longmaxi Formations shale reservoirs in Weiyuan area, Sichuan Basin. Natural Gas Geoscience (in Chinese) (in Chinese), 30(3): 414-422. |
Dong D Z, Gao S K, Huang J L, et al. 2014. A discussion on the shale gas exploration & development prospect in the Sichuan basin. Natural Gas Industry (in Chinese) (in Chinese), 31(12): 1-15. |
Dziewonski A, Bloch S, Landisman M. 1969. A technique for the analysis of transient seismic signals. Bulletin of the Seismological Society of America, 59(1): 427-444. |
Gu Z D, Zhai X F, Jiang X F, et al. 2013. Geochemical characteristics and tectonic environment of basal granite in Weiyuan structure, Sichuan basin. Earth Science-Journal of China University of Geosciences (in Chinese) (in Chinese), 38(S1): 31-42. |
Hermann R B, Ammon C J. 2002. Computer Programs in Seismology Version 3.30: Surface Waves, Receiver Functions, and Crustal Structure. St Louis, Missouri: Department of Earth and Atmospheric Sciences, St Louis University: 66-70.
|
Kang T S, Shin J S. 2006. Surface-wave tomography from ambient seismic noise of accelerograph networks in southern Korea. Geophysical Research Letters, 33(17): L17303. |
Kearey P, Brooks M, Hill I. 2002. An Introduction to Geophysical Exploration. 3rd ed. Oxford: Wiley-Blackwell: 262.
|
Laske G, Masters G, Ma Z T, et al. 2013. Update on CRUST1.0-A 1-degree Global Model of Earth's Crust. Geophysical Research Abstracts, 15: EGU2013-2658. |
Lee K K, Ellsworth W L, Giardini D, et al. 2019. Managing injection-induced seismic risks. Science, 364(6442): 730-732. |
Levshin A, Ratnikova L, Berger J. 1992. Peculiarities of surface-wave propagation across central Eurasia. Bulletin of the Seismological Society of America, 82(6): 2464-2493. |
Li C, Yao H J, Fang H J, et al. 2016. 3D near-surface shear-wave velocity structure from ambient-noise tomography and borehole data in the Hefei Urban Area, China. Seismological Research Letters, 87(4): 882-892. |
Li H Y, Li S, Song X D, et al. 2012. Crustal and uppermost mantle velocity structure beneath northwestern China from seismic ambient noise tomography. Geophysical Journal International, 188(1): 131-143. |
Li J Y, Shi B W, Xu X Y, et al. 2018. Crustal structure beneath the Sichuan basin and adjacent regions revealed by teleseismic receiver functions. Chinese Journal of Geophysics (in Chinese) (in Chinese), 61(7): 2719-2735. |
Li L L. 2012. Passive imaging of ambient seismic noise and its application in North China[Ph. D. thesis] (in Chinese). Beijing: China University of Science and Technology.
|
Lin F C, Li D Z, Clayton R W, et al. 2013. High-resolution 3D shallow crustal structure in Long Beach, California:Application of ambient noise tomography on a dense seismic array. Geophysics, 78(4): Q45-Q56. |
Liu S, Luo Z L, Xiong Z G, et al. 2000. On formation mechanism of Caledonian Paleoswell in Sichuan basin from experimental rocks deformational process. Journal of Chengdu University of Technology (in Chinese) (in Chinese), 27(4): 343-347. |
Liu S. 2001. Formation time and formation mechanism of the Weiyuan anticline in Sichuan basin. Journal of Chengdu University of Technology (in Chinese) (in Chinese), 28(4): 340-343. |
Liu Z K, Huang J L, Yao H J. 2016. Anisotropic Rayleigh wave tomography of northeast China using ambient seismic noise. Physics of the Earth and Planetary Interiors, 256: 37-48. |
Luo L, Liang F, Fu G M, et al. 2019. Current status and prospects of noise correlation imaging method in shallow structure exploration. Contributions to Geology and Mineral Resources Research (in Chinese) (in Chinese), 34(1): 140-144. |
Pan T, Jiang G, Sun W H. 2016. Shale reservoir heterogeneity of Longmaxi formation, Weiyuan area, Sichuan basin. Fault-Block Oil & Gas Field (in Chinese) (in Chinese), 23(4): 423-428. |
Rawlinson N, Sambridge M. 2003. Seismic traveltime tomography of the crust and lithosphere. Advances in Geophysics, 46: 81-198. |
Sabra K, Gerstoft P, Roux P, et al. 2005. Surface wave tomography from seismic ambient noise in southern California. The Journal of the Acoustical Society of America, 117(4): 2431-2432. |
Shapiro N M, Campillo M. 2004. Emergence of broadband Rayleigh waves from correlations of the ambient seismic noise. Geophysical Research Letters, 31(7): L07614. |
Shi Q, Chen P, Wang X Q, et al. 2017. A method for identifying high-productivity intervals in a horizontal shale gas well and its application:A case study of the Lower Silurian Longmaxi Fm in Weiyuan-shale gas demonstration area, Sichuan Basin. Natural Gas Industry (in Chinese) (in Chinese), 37(1): 60-65. |
Wang B. 2017. Multi-phase rifting and its formation mechanism during Sinian-early Cambrian in central Sichuan Basin[Master's thesis] (in Chinese). Beijing: China University of Geosciences (Beijing).
|
Wang Q, Song X D, Ren J Y. 2017. Ambient noise surface wave tomography of marginal seas in East Asia. Earth and Planetary Physics, 1(1): 13-25. |
Wang W J, Chen Q F, Chen L. 2012. Review on near-surface soft structure investigation with seismic noise. Earthquake Research in China (in Chinese) (in Chinese), 28(4): 335-350. |
Wang W T, Wang B S, Ge H K, et al. 2009. Using active source to monitor velocity variation in shallow sediment caused by the Wenchuan earthquake. Earthquake Research in China (in Chinese) (in Chinese), 25(3): 223-233. |
Wang Y M, Dong D Z, Li J Z, et al. 2012. Reservoir characteristics of shale gas in Longmaxi formation of the lower Silurian, southern Sichuan. Acta Petrolei Sinica (in Chinese) (in Chinese), 33(4): 551-561. |
Wu Z H, Xiong L, Ge Z W, et al. 2019. Fine characterization and target window optimization of high-quality shale gas reservoirs in the Weiyuan area, Sichuan Basin. Natural Gas Industry (in Chinese) (in Chinese), 39(3): 11-20. |
Xie J, Ni S D, Zeng X F. 2012. 1D shear wave velocity structure of the shallow upper crust in central Sichuan Basin. Earthquake Research in Sichuan (in Chinese), (2): 20-24. |
Xie J, Zhao S X, Shi X W, et al. 2017. Main geological factors controlling high production of horizontal shale gas wells in the Sichuan Basin. Natural Gas Industry (in Chinese) (in Chinese), 37(7): 1-12. |
Xie J, Chu R S, Yang Y J. 2018. 3-D upper-mantle shear velocity model beneath the contiguous United States based on broadband surface wave from ambient seismic noise. Pure and Applied Geophysics, 175(10): 3403-3418. |
Xie J. 2018. Practices and achievements of the Changning-Weiyuan shale gas national demonstration project construction. Natural Gas Industry (in Chinese) (in Chinese), 38(2): 1-7. |
Xu B G. 1997. Tectonic inversion in Weiyuan region, Sichuan in early Yanshanian epoch and formation of Weiyuan anticline embryo. Acta Geologica Sichuan (in Chinese) (in Chinese), 17(2): 96-102. |
Xu H R, Luo Y H, Chen C, et al. 2016. 3D shallow structures in the Baogutu area, Karamay, determined by eikonal tomography of short-period ambient noise surface waves. Journal of Applied Geophysics, 129: 101-110. |
Yang Y J, Ritzwoller M H, Levshin A L, et al. 2007. Ambient noise Rayleigh wave tomography across Europe. Geophysical Journal International, 168(1): 259-274. |
Yao H J, Van Der Hilst R D, De Hoop M V. 2006. Surface-wave array tomography in SE Tibet from ambient seismic noise and two-station analysis:I-Phase velocity maps. Geophysical Journal International, 166(2): 732-744. DOI:10.1111/j.1365-246X.2006.03028.x |
Yao H J, Gouédard P, Collins J A, et al. 2011. Structure of young East Pacific Rise lithosphere from ambient noise correlation analysis of fundamental-and higher-mode Scholte-Rayleigh waves. Comptes Rendus Geoscience, 343(8-9): 571-583. |
Yu Y, Li Z Q, Yang Y Y, et al. 2013. Characteristics of tectonic evolution of Weiyuan area in Sichuan basin and its effect on lower Paleozoic oil and gas reservoirs. Natural Gas Exploration and Development (in Chinese) (in Chinese), 36(2): 1-4, 16. |
Zeng Q C, Chen S, He P, et al. 2018. Quantitative seismic prediction of shale gas sweet spots in Lower Silurian Longmaxi formation, Weiyuan area, Sichuan Basin, SW China. Petroleum Exploration and Development (in Chinese) (in Chinese), 45(3): 406-414. |
Zhang Q L, Deng H C, Liang X, et al. 2016. Analysis of shale reservoir difference of Longmaxi formation in Sichuan basin-by taking Weiyuan and Fuling areas for example. Journal of Yangtze University (Natural Science Edition) (in Chinese) (in Chinese), 13(17): 1-7. |
Zheng S H, Sun X L, Song X D, et al. 2008. Surface wave tomography of China from ambient seismic noise correlation. Geochemistry, Geophysics, Geosystems, 9(5): Q05020. |
Zhu Y, Sang Q, Wu C L, et al. 2010. Reservoir Characteristics of the Sinian Dengying Formation in the Weiyuan gasfield, Sichuan. Journal of Chongqing University of Science and Technology (Natural Sciences Edition) (in Chinese) (in Chinese), 12(5): 11-13, 45. |
曹春辉, 张铭杰, 汤庆艳, 等. 2016. 四川盆地志留系龙马溪组页岩气气体地球化学特征及意义. 天然气地球科学, 26(8): 1604-1612. |
邓继新, 王欢, 周浩, 等. 2015. 龙马溪组页岩微观结构、地震岩石物理特征与建模. 地球物理学报, 58(6): 2123-2136. DOI:10.6038/cjg20150626 |
邓宇, 曾庆才, 陈胜, 等. 2019. 四川盆地威远地区五峰组-龙马溪组页岩TOC含量地震定量预测方法及应用. 天然气地球科学, 30(3): 414-422. DOI:10.11764/j.issn.1672-1926.2018.10.026 |
董大忠, 高世葵, 黄金亮, 等. 2014. 论四川盆地页岩气资源勘探开发前景. 天然气工业, 34(12): 1-15. |
谷志东, 翟秀芬, 江兴福, 等. 2013. 四川盆地威远构造基底花岗岩地球化学特征及其构造环境. 地球科学——中国地质大学学报, 38(S1): 31-42. |
李建有, 石宝文, 徐晓雅, 等. 2018. 利用远震接收函数探测四川盆地及周边地区的地壳结构. 地球物理学报, 61(7): 2719-2735. DOI:10.6038/cjg2018L0652 |
李玲利. 2012.地震背景噪声理论研究及在华北地区的应用[博士论文].北京: 中国科学技术大学.
|
刘顺, 罗志立, 熊荣国, 等. 2000. 从实验岩石变形过程探讨四川盆地加里东古隆起的形成机制. 成都理工大学学报, 27(4): 343-347. |
刘顺. 2001. 四川盆地威远背斜的形成时代及形成机制. 成都理工大学学报, 28(4): 340-343. |
罗磊, 梁锋, 付光明, 等. 2019. 噪声互相关成像方法在浅层结构勘查研究现状及展望. 地质找矿论丛, 34(1): 140-144. |
潘涛, 姜歌, 孙王辉. 2016. 四川盆地威远地区龙马溪组泥页岩储层非均质性. 断块油气田, 23(4): 423-428. |
石强, 陈鹏, 王秀芹, 等. 2017. 页岩气水平井高产层段判识方法及其应用——以四川盆地威远页岩气示范区下志留统龙马溪组为例. 天然气工业, 37(1): 60-65. DOI:10.3787/j.issn.1000-0976.2017.01.007 |
王贝. 2017.四川盆地中部震旦纪-早寒武世多幕裂陷作用及其成因机制[硕士论文].北京: 中国地质大学(北京).
|
王伟君, 陈棋福, 陈凌. 2012. 松散浅层结构的地震噪声探测综述. 中国地震, 28(4): 335-350. |
王伟涛, 王宝善, 葛洪魁, 等. 2009. 利用主动震源检测汶川地震余震引起的浅层波速变化. 中国地震, 25(3): 223-233. |
王玉满, 董大忠, 李建忠, 等. 2012. 川南下志留统龙马溪组页岩气储层特征. 石油学报, 33(4): 551-561. |
武恒志, 熊亮, 葛忠伟, 等. 2019. 四川盆地威远地区页岩气优质储层精细刻画与靶窗优选. 天然气工业, 39(3): 11-20. |
谢军, 倪四道, 曾祥方. 2012. 四川盆地中部浅层地壳一维剪切波速度结构初步研究. 四川地震, (2): 20-24. |
谢军, 赵圣贤, 石学文, 等. 2017. 四川盆地页岩气水平井高产的地质主控因素. 天然气工业, 37(7): 1-12. |
谢军. 2018. 长宁-威远国家级页岩气示范区建设实践与成效. 天然气工业, 38(2): 1-7. |
徐炳高. 1997. 四川省威远地区燕山早期的构造反转及威远背斜雏形的形成. 四川地质学报, 17(2): 96-102. |
喻颐, 李忠权, 杨渊宇, 等. 2013. 四川盆地威远地区构造演化特征及其对下古生界油气富集的控制作用. 天然气勘探与开发, 36(2): 1-4, 16. |
曾庆才, 陈胜, 贺佩, 等. 2018. 四川盆地威远龙马溪组页岩气甜点区地震定量预测. 石油勘探与开发, 45(3): 406-414. |
张全林, 邓虎成, 熊亮, 等. 2016. 四川盆地龙马溪组页岩储层特征差异性探讨——以威远与涪陵地区为例. 长江大学学报(自科版), 13(17): 1-7. |
朱瑜, 桑琴, 吴昌龙, 等. 2010. 威远气田震旦系灯影组储层特征研究. 重庆科技学院学报(自然科学版), 12(5): 11-13, 45. |
 2020, Vol. 63


