2. 中国科学技术大学地球和空间科学学院, 合肥 230026;
3. 宁夏回族自治区地震局, 银川 750001
2. School of Earth and Space Sciences, University of Science and Technology of China, Hefei 230026, China;
3. Earthquake Agency of Ningxia Hui Autonomous Region, Yinchuan 750001, China
海原弧形构造区位于我国青藏高原东北缘,处于鄂尔多斯地块、阿拉善地块、走廊过渡带、祁连造山带以及秦岭造山带多个地质单元的拼合处(李天斌,1999),是青藏高原NE方向扩展的前缘地区(图 1).该区发育众多中大断裂带,如海原—六盘山断裂带、六盘山西缘断裂带、青铜峡—固原断裂带等,晚新生代以来构造变形十分强烈.其中海原—六盘山断裂带是研究区内最重要的活动构造带之一,同时也是青藏高原东北缘重要的边界断裂带;青铜峡—固原断裂是鄂尔多斯块体西南缘的一条南北走向的基底断裂,向下延伸可能至下地壳中(李天斌,1999).构造区内中强地震频发,历史上曾发生过近30次7级以上强震,其中包括我国历史记载最大的1920年海原M8.5大地震、1739年银川M8大震以及1927年的古浪M8大震(林吉焱和段永红,2016).该区是研究青藏高原NE向发展动力学机制的天然场所,也是研究大陆强震机理的重要之地,对认识我国大陆地壳变形动力学、地震灾害发生机制以及灾害趋势预测具有十分重要的科学意义(Deng et al., 1986;徐锡伟等,2003).

|
图 1 研究区地形和构造背景 F1六盘山西缘断裂带;F2海原—六盘山断裂带;F3清水河断裂;F4烟筒山—窑山断裂带; F5青铜峡—固原断裂带;F6韦州—安国断裂;F7青龙山—平凉断裂;F8惠安堡—沙井子断裂(修自Cheng et al., 2014).图中红色矩形框表示研究区域,黑色圆圈表示历史强震MS≥7.0,绿色五角星表示1920年海原MS8.5强震.黑色线表示断裂,白色短划线表示块体分界. Fig. 1 Topography and tectonic setting of the research area F1 Western margin fault of Liupanshan; F2 Haiyuan-Liupanshan fault; F3 Qingshuihe fault; F4 Yantongshan-Yaoshan fault; F5 Qingtongxia-Guyuan fault; F6 Weizhou-Anguo fault; F7 Qinglongxia-Pingliang fault; F8 Huianbu-Shajingzi fault (Modified from Cheng et al., 2014). Red rectangle in map represent the study area, black circles denote the large historic earthquakes (MS≥7.0), green star denotes the 1920 Haiyuan MS8.5 earthquake. Black lines denote faults and white dash lines denote block boundaries. |
自1920年海原8.5级大地震发生以后,许多学者对区域内断裂活动特征与强震活动特点进行了广泛的研究.断裂构造研究方面,周俊喜等(1983)、环文林等(1991)对海原大地震发震断层带及多重破裂特点与更新世以来的活动特征进行了阐述;田勤俭和丁国瑜(1998)对海原—银川附近的青藏高原东北缘似三联点构造进行了分析.强震活动规律方面,冉勇康和邓起东(1998)以及张培震等(2003)讨论了海原断裂古地震的强度与活动习性等问题;傅征祥等(2001)研究了海原、古浪、昌马3次历史大地震之间的相互关系.关于研究区的深部结构方面, 大量的人工地震测深剖面(周民都等,2000;李松林等,2002;樊计昌等,2004;王海燕等,2012;林吉焱和段永红,2016;赵金仁等, 2017, 王帅军等,2019)与大地电磁测深剖面(詹艳等, 2004, 2005, 2017;汤吉等,2005;尹秉喜等,2013;闵刚等,2014;韩松等,2016)给出了穿过研究区多个不同位置剖面的基底埋深、壳幔速度与电性结构,以及研究区莫霍界面的三维构造图像;众多的天然地震体波成像结果(金延龙等,1999;周民都等, 2006, 2012;郭慧丽等,2017; 郭慧丽和丁志峰,2018;肖卓和高原,2017;Cheng et al., 2014, 2016;Ding et al., 2017;董兴朋和滕吉文,2018)从不同尺度显示了研究区及邻区深部地壳P波速度结构横向的不均匀性;而面波频散与接收函数反演结果(Pan and Niu, 2011;Shen et al., 2011;Zhang et al., 2011;Li et al., 2014;范文渊等,2015;Zheng et al., 2016;钟世军等,2017;王兴臣等,2017;Wang et al., 2017a, 2017b;潘佳铁等,2017;Shen et al., 2017;杨志高和张雪梅,2018;郑晨等,2018)则给出了相关区域地壳、上地幔S波速度结构的基本特征,以及下地壳的低速异常、地壳厚度分布等;各向异性(王琼等,2013;王琼和高原,2018;Shen et al., 2015;Ye et al., 2016)结果揭示了该区地壳及上地幔的各向异性分布特点.前人的研究成果,对深入分析海原弧形构造区的深部构造环境、孕震背景提供了良好的基础,但是关于深部结构成像方面,由于地震数据有限以及台站的分布不均和成像方法的局限等,所获得的结果分辨率仍然较低,采用先进的地震成像方法获得研究区地壳精细结构特征和深部构造信息,对我们进一步了解青藏高原东北缘地区强震活动特性以及深部孕震环境具有重要的意义.
本文将利用区域地震台网多年来记录到的地震到时资料,使用近些年来成熟的双差地震层析成像技术(Zhang and Thurber, 2003)对海原弧形构造区地壳速度结构与地震震源参数进行联合反演计算,以获得高分辨的三维地壳速度结构,为进一步深入研究该区强震发生机理和深部介质条件提供参考.
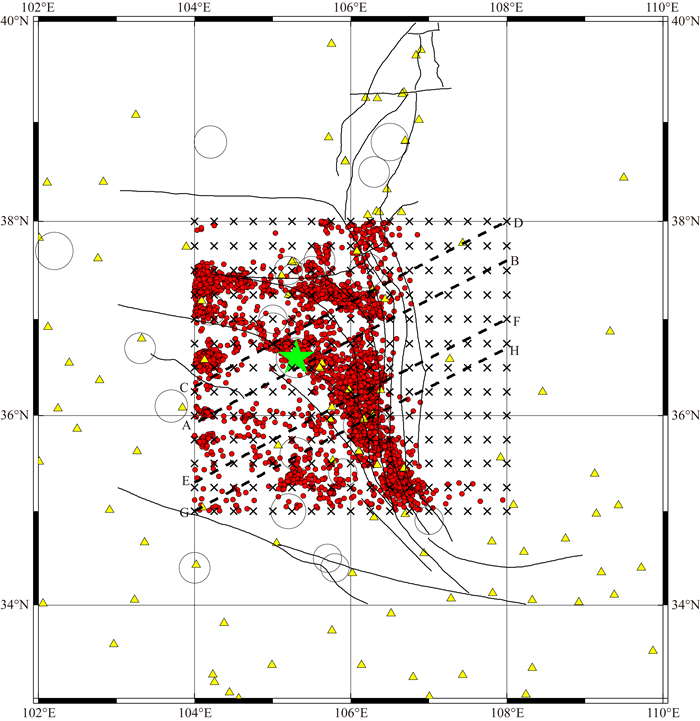
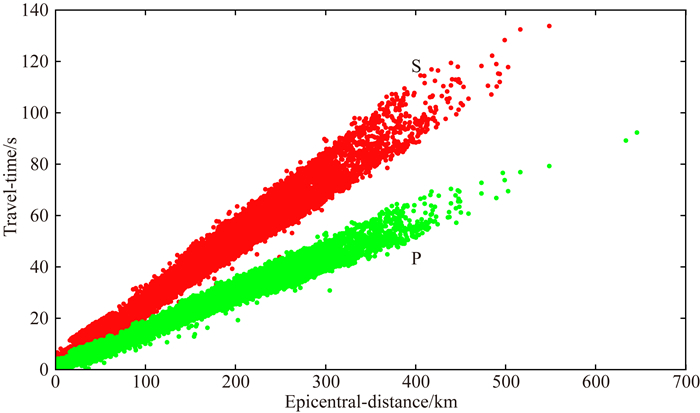
1 方法与资料 1.1 地震资料本文收集了由中国地震台网中心提供的海原弧形构造区及其邻区(35°N—38°N,104°E—108°E)1970年1月至2015年1月的初至P、S波震相到时资料.为了尽可能多的使用区域地震震相数据,我们扩大了台站记录范围(33°N—40°N,102°E—110°E),共包含101个区域地震台站(图 2).为了保证反演结果的质量,首先对使用的地震震相数据进行严格的筛选:挑选出被四个以上台站记录的地震事件,然后使用和达曲线进行震中距与走时的拟合,删除误差较大的值(图 3);其次,由于地震数据包含年代时间较长,约30%的数据没有初始深度值,我们使用Hypo2000地震定位程序对筛选后的数据进行了初步的绝对定位.最终获得4423个地震事件参与联合反演计算,其中包含绝对到时P波24590条,S波23817条,相对到时数据P波655892条,S波634061条.依据初始数据中P和S震相读取的相对可靠程度,将初至P波权重设为1,初至S波权重设为0.5.
|
图 2 地震、台站、反演网格点与速度剖面位置分布图 红色点表示地震,黄色三角表示台站,黑色斜十字表示反演的网格节点,黑色圆圈表示历史大震,黑色短划线表示速度剖面位置, 绿色五角星代表海原大地震震中. Fig. 2 Map showing distribution of events (red dots), stations (yellow triangles), inversion grid nodes (black oblique crosses) and velocity profiles (black bars) in the research area. Green star denotes the 1920 Haiyuan M8.5 earthquake |
|
图 3 P、S波时距曲线图(绿点表示P波,红点表示S波) Fig. 3 Time distance curve of P (green dots) and S (red dots) wave |
在双差地震定位法(Waldhauser and Ellsworth, 2000)的基础上,Zhang和Thurber (2003)提出了可用于同时进行速度结构反演与地震精确定位的双差地震层析成像方法(Tomodd).Tomodd及其扩展系列(Zhang and Thurber, 2005,2006;Zhang et al., 2009, 2012;Pesicek et al., 2010)可以同时使用绝对走时和相对走时(包括波形互相关走时)资料以提高震源位置和速度结构的反演精度,可运用于不同尺度的壳幔结构研究.双差地震层析成像方法可采用规则网格节点(Zhang and Thurber, 2003)或者自适应网格剖分技术(Zhang and Thurber, 2005)进行初始模型的网格化,正演走时计算可使用伪弯曲射线追踪技术也可使用有限差分算法,反演采用阻尼最小二乘分解算法(LSQR)进行求解,反演结果可使用棋盘检测板测试、恢复性实验以及节点周围射线的空间分布DWS(Derivate Weight Sum)值来进行评估.
本文利用区域尺度双差地震层析成像方法进行计算,该方法采用规则网格节点构建初始模型,使用伪弯曲射线追踪技术与阻尼最小二乘分解算法进行正反演计算,可以使用Pg、Sg、Pn、Sn以及P、S等震相.前人在不同地区使用该方法获得了较好的成像结果(肖卓等,2017;李敏娟等,2018;刘白云等,2018;左可桢和陈继锋,2018;Xin et al., 2018).
1.3 初始模型与参数选取初始速度模型对于层析成像反演结果具有较大的影响,因此需要选择合适的初始模型.依据穿过研究区的多条人工地震测深剖面(周民都等,2000;李松林等,2002;Zhang et al., 2013;林吉焱等,2016)与前人地震层析成像研究使用的初始模型与结果(Cheng et al., 2016;肖卓和高原等, 2017, 李敏娟等,2018)综合进行分析,建立本文研究使用的初始一维速度模型见表 1.通过和达法拟合P、S走时曲线,得到波速比平均值约为1.70,与肖卓和高原等(2017)结果一致.
|
|
表 1 初始一维速度模型 Table 1 Initial velocity model used |
反演过程中采用多重网格反演策略(Xin et al., 2018),即水平方向最初使用1°×1°网格间隔,经过数次迭代计算后将所得速度结果插值为0.5°×0.5°,然后将其作为初始速度模型再进行反演,将得到的模型插值为0.25°×0.25°网格间隔,作为最终的输入速度模型.这样可以同时保证射线稀疏与相对密集区域地壳结构的反演精度.
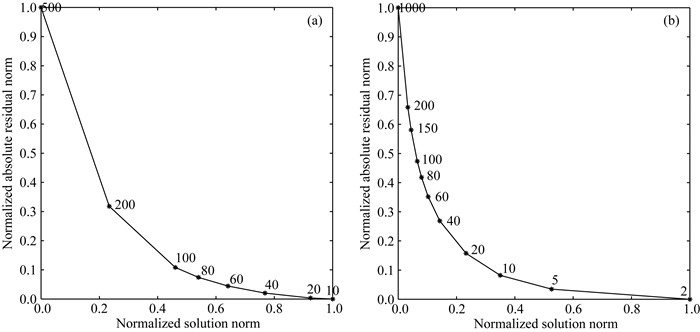
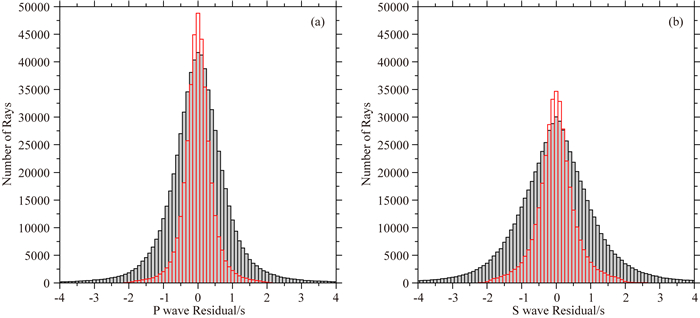
双差地震层析成像方法采用LSQR算法求解反演方程,其中阻尼因子及平滑权重的大小控制反演结果的稳定性,因此需要进行权衡分析,选取合适的值(Eberhart-Phillips, 1986).根据L-curve均衡曲线(Hansen and O′Leary,1993)经过不同值的计算(图 4),最终选取的阻尼因子与平滑权重的最优值分别为200和40.通过10次迭代,数据总的均方根残差从1.77 s降低到0.36 s,P、S波反演后的走时残差相比初始有着明显的降低(图 5).
|
图 4 利用L-curve均衡曲线选择最佳的阻尼(a)与光滑权重参数(b) Fig. 4 Damping (a) and smoothing (b) factors were selected by L-curve |
|
图 5 P波走时残差(a)、S波走时残差(b)反演前后直方图(灰色为初始残差,红色为结果残差) Fig. 5 Residual histograms of P (a) and S (b) phase before and after inversion. Gray vertical lattices denote initial residuals and red vertical lattices denote final residuals |
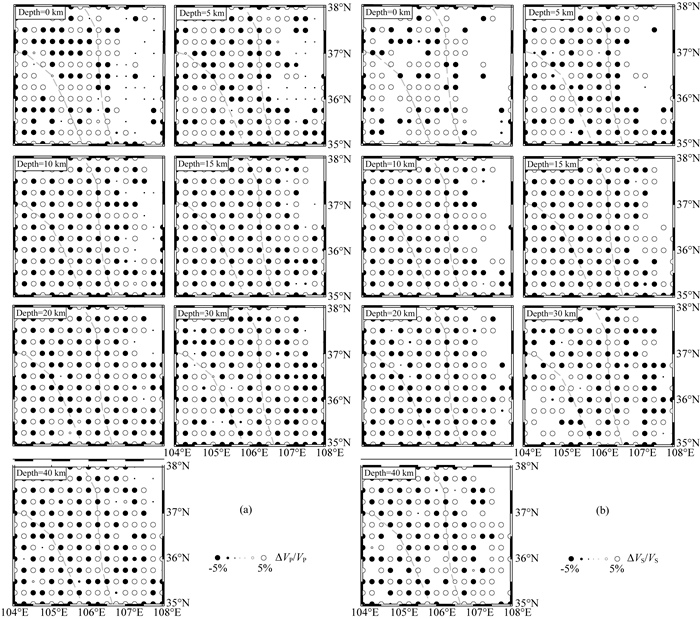
采用棋盘检测板测试(Zhao et al., 1992)的方法,使用实际反演的地震和台站,在初始速度模型基础上增加±5%的正反相间的速度扰动,对模型的质量进行评价.棋盘测试结果如图 6所示.结果显示在5~30 km深度范围内,数据得到了较好的恢复,反演结果分辨较好,0和40 km深度层由于地震射线穿过较少,分辨率相对较差.
|
图 6 研究区域不同深度水平切片VP(a)、VS(b)检测板结果分布 Fig. 6 Checkerboard test results of different depths of VP (left) and VS (right) in the study area |
除检测板测试外,双差层析成像反演结果的可靠性还可以采用DWS(Derivate Weight Sum)值来判定.Thurber和Eberhart-Phillips (1999)研究表明DWS值由于对每一段射线路径进行了距离加权,因而反映的模型节点周围的相对射线密度比不加权的射线总和更具可靠性.研究结果(Thurber et al., 2007)表明当DWS大于100时,反演结果具有高的可靠性.图 7为反演得到的速度结果,其中白线表示DWS>100.

|
图 7 不同深度层的水平切片VP(左)、VS(中)、VP/VS(右)层析成像结果 白色线表示DWS值为100,15 km深度层黑色大圆圈表示发生在该区域的历史上大于7级的强震, 黑色五角星表示海原强震震中位置,黑色小圆圈表示重新定位后的地震. Fig. 7 Map views of the VP, VS and VP/VS models at different depth slices The white contours enclose the areas where the derivative weight sum is greater than 100. The crosses denote the relocated earthquakes, the big black circles in the 15 km depth slices are the historical large earthquakes with magnitude greater than 7.0, black star denotes the Haiyuan strong historic earthquake and black small circles denote relocated earthquakes. |
图 7给出了在不同深度处的P波速度结构、S波速度结构水平切片分布以及二者对应的波速比分布,同时分别投影了相邻深度层上下距离一半深度范围内的地震.由图可以看出位于研究区域范围内地壳的P、S波速度结构都存在相对明显的横向不均匀性.
0和5 km深度层速度分布反映了地表地质、地形的变化.研究区东部鄂尔多斯盆地显示速度较低,即定边—环县—灵台一带往东地区(速度分辨相对较差),表明鄂尔多斯盆地下方存在较厚的沉积层(林吉焱和段永红,2016;郑晨等,2018);研究区中部走廊过渡带的兴仁—海原盆地(平凉—固原)显示低速异常;研究区西部祁连造山带的陇中盆地(靖远—定西—西吉)同样显示低速异常;5 km深度层显示断裂穿过区域P、S波速度相对较高,断裂的走向和高低速条带分布有着较好的对应.波速比分布图整体显示研究区大部分区域位于1.70值以下.
10 km和15 km深度层速度分布反映了研究区上地壳的结构变化.P波速度分布显示相比浅层结构,鄂尔多斯盆地与陇中盆地(靖远—定西—西吉)显示高速异常;15 km深度层走廊过渡带VP、VS均显示速度较低,研究区东缘环县—灵台波速比相对增大,略大于1.70;研究区大部分区域整体显示波速比分布仍位于1.70值以下.
20 km深度层速度分布反映了研究区中上地壳的结构特征.区域内大致以青铜峡—固原断裂F5为分界,东部地区定边—环县—灵台所在的鄂尔多斯盆地显示VP、VS与VP/VS均相对较高;西部地区整体显示相对低速,同时沿着海原断裂F2也显示其两侧速度有着差异.
30 km和40 km深度层速度分布反映了研究区中下地壳的结构变化.从速度分布图像可以看出研究区中下地壳具有明显的横向不均匀性.研究区东部鄂尔多斯盆地仍旧显示VP、VS与VP/VS均相对较高,VP/VS值在1.75左右;中间地区大概以多条大型断裂为分界作为高低速异常的过渡,与该区重力梯度带变化较为一致(王椿镛等,2016).研究区西部整体显示VP、VS均相对较低,这与前人研究结果一致(涂毅敏等,2000);郑晨等(2018)使用面波频散数据与接收函数对S波速度结构进行联合反演获得了类似的速度分布特征.
2.3 垂直切片速度分布为了更好地分析研究区深部速度结构的横向变化特征,我们沿着不同位置横跨断裂给出了四条垂直切片的速度分布结果(图 8),同时为了进一步分析地震活动性与速度结构之间的关系,将沿着切片两侧各20 km范围内重新定位后的地震投影在了速度切片上.其中AB剖面穿过了海原8.5级强震震中区,同时与玛沁—靖边地震测深剖面(李松林等,2002;林吉焱和段永红,2016)大致重合.

|
图 8 不同位置AB、CD、EF以及GH的垂直切片速度结构与地震切片图像 黑色小圆圈表示重定位后的地震,黑色大圆圈表示历史上大于7级的强震,黑色五角星表示海原强震,黑色短划线表示推测的断裂位置,黑色粗线表示上下地壳分界.纵坐标与横坐标比例为3:1. VP垂直切片中黑色粗线为VP=6.3 km·s-1,VS垂直切片中黑色粗线为VS=3.7 km·s-1. Fig. 8 VP, VS and VP/VS models and relocated events along four cross sections at different locations The black small circles denote relocated earthquakes, the black large circles are the historical strong earthquakes with magnitude greater than 7.0, black star denotes the Haiyuan strong historic earthquake and black dash lines are the presumed location of faults. The ratio of ordinate to abscissa is 3:1. Black thick lines denote the VP=6.3 km·s-1 and VS=3.7 km·s-1 in the vertical section of VP and VS, respectively. |
图 8显示四条速度剖面均呈现出研究区深部VP、VS以及VP/VS的横向不均匀性.研究区地壳具有明显的分层结构,0~6 km深度层约为地表至结晶基底的范围,其中鄂尔多斯盆地下方显示结晶基底最深(林吉焱和段永红,2016);VP、VS以及VP/VS剖面均显示速度结构呈现明显的横向差异,前人研究认为这些差异是由于造山带的强烈隆升造成的, 可作为相邻断裂带在地震学上的体现(赵金仁等,2017).10~15 km深度层在隆中盆地与兴仁—海原盆地下方显示了速度横向差异较大,而随着剖面向东北进入鄂尔多斯盆地,VP、VS变化则变得相对平缓.20~40 km深度层展示了同样类似的速度变化,其中特别是在走廊过渡带下方,速度横向变化较大,而在鄂尔多斯盆地下方,速度则相对均匀,表明走廊过渡带中下地壳相对破碎而鄂尔多斯块体地壳结构的非均匀尺度变化微弱,结构完整且相对稳定的特征(张先康等,2003;赵金仁等,2005).
剖面显示在深度25~30 km范围,祁连造山带的下方,存在低的VP、VS条带异常,其中EF、GH剖面比AB、CD剖面更为明显,这与前人所得结果相一致(涂毅敏等,2000),但是比人工地震剖面结果相对略深(李松林等,2002);AB剖面中显示震源深度约17 km的海原大震(顾功叙,1983)正好位于该低速异常的上方,GH剖面中也显示有类似的强震发生特征.然而由于该区域靠近研究区的边缘,检测板结果显示该深度范围分辨相对较差,从而上述的低速条带可靠性相对较低.
赵金仁等(2005)利用深地震测深资料反演获得了青藏高原东北缘地区莫霍界面的深部分布形态,结果显示弧形构造区内的莫霍界面深度为47~51 km,鄂尔多斯地块莫霍界面深度范围为43~47 km,莫霍界面由西南向东北方向呈逐渐上倾趋势;玛沁—靖边地震测深剖面结果也显示地壳厚度由西南向东北方向逐渐减薄(李松林等,2002);海原弧形构造区的平均地壳厚度约为47 km(许英才等,2018).本文四条速度剖面显示下地壳速度横向分布变化具有和莫霍面变化一致的特点.
3 讨论 3.1 地震、断裂与速度分布关系图 7、图 8均显示了地震活动分布与速度异常分布之间的关系.水平切片速度分布图显示地震主要沿断裂呈弧状展布,并且深度范围主要分布在5~20 km,与肖卓和高原(2017)利用同样的方法研究青藏高原东北缘地区地震深度分布所得结果一致;垂直切片显示沿着不同剖面的不同位置比如海原以及同心等地下方,地震垂向分布具有近似直立的特征,个别地震深度分布位于30~40 km的下地壳,推测这些地震活动可能与附近存在深大断裂有关,前人研究结果也显示了类似的地震分布特征(Cheng et al., 2014;杜方等,2018).区域内主要的大型走滑断裂,如海原—六盘山断裂带与青铜峡—固原断裂带位于高速与低速的过渡带,断裂两侧地震波速横向差异较大.垂直速度切片图 7中我们根据地震分布以及速度异常分布推测了相关断裂的深部展布,图中显示海原—六盘山断裂带F2倾向西南,倾角比较直立,可能延伸到下地壳;六盘山西缘断裂带F1、烟筒山—窑山断裂带F4、青铜峡—固原断裂带F5等或直立或较陡的倾角,可能延伸到中下地壳.深地震测深结果(李松林等,2002;樊计昌等,2004)推测海原断裂为一条倾角直立的超壳断裂,但是王海燕等(2012)使用临夏—景泰的深地震反射剖面资料获得海原断裂(震区西北约200 km)的几何形态随着深度变化,而不是简单的陡立或者较缓的结果,该断裂深部被错断莫霍面的剪切带所截断,并非切穿莫霍面,属于壳内深大断裂.曾宪伟等(2012)利用地震分布和区域构造应力场确定了海原大地震断层面参数,显示断层倾角较大.综合分析前人的结果与本文结果,我们认为海原断裂为壳内高角度直立深大断裂更为可能.赵金仁等(2005)指出青铜峡—固原断裂为深大断裂可能延伸至莫霍面,我们推测该断裂至少延伸到了中下地壳.
强震是地壳介质应力积累发生瞬间断错的产物, 其发生机制应与介质的不均匀性有关(金延龙等,1999).将研究区域内的所发生中强地震投影到15 km深度层的水平速度切片与邻近的垂直切片上,可以看出:研究区内的中强地震的分布主要与速度高低过渡带有关.中强地震基本分布于地壳中速度高梯度区附近, 在高低速过渡带上,应力分布相当集中,因此容易发生大地震.这与众多研究得到的强震震源区深部结构特征有较好的一致性(金延龙等,1999;李松林等,2002;于湘伟等,2010;Cheng et al., 2014, 2016;王小娜等,2015;李敏娟等,2018;左可桢和陈继峰,2018).另外海原强震下方下地壳存在低速的薄弱层,该薄弱层的驰豫作用很可能把应力传递到上地壳, 造成应力相对积累增加,是强震及浅源地震的频发的成因(Kenner and Segal, 2000).
3.2 电性结构与速度分布关系大地电磁测深法(MT)对低阻介质反应灵敏同时不受高阻层屏蔽,因而能有效地反映深部构造形态及高导层分布,因此该方法是探测深部结构的有效手段(Jones,1999).为了深入研究海原弧形构造区不同块体特别是中间交汇复杂结构区的深部电性结构,前人在该区开展了多条不同位置的MT剖面研究工作(赵国泽等, 2004;詹艳等, 2004, 2005, 2017;汤吉等,2005;尹秉喜等,2013;闵刚等,2014;韩松等,2016),结果整体显示不同块体之间电性结构具有明显的横向差异,上地壳存在高阻体;海原大震区下方下地壳呈现局部低阻特征,存在一规模较大的高导体;海原断裂带两侧电性结构差异非常明显, 东北部为低阻,西南部相反为高阻, 海原大震发震位置正好处于电性结构突变带(詹艳等,2004;汤吉等,2005);其他大型断裂带两侧电性差异也十分明显(詹艳等,2004).
对比玛沁—兰州—靖边大地电磁测深剖面(汤吉等,2005)和相同位置的本文结果AB速度垂直切片,可以得到海原大震区下方下地壳30 km深度范围呈现局部低阻的位置大致对应于速度剖面上的低速层;而海原断裂带两侧西南部为高阻正好对应高速异常体, 东北部为低阻的地方也对应着相应的低速异常区;在兴仁—海原盆地下方浅部沉积层显示为低速,对应着比较厚的低阻层;剖面进入鄂尔多斯西缘地块,中下地壳显示为高阻层,对应速度也相对较高.
对于类似海原大震区下方下地壳电性结构表现的低速、高导特征,顾芷娟等(1995)研究认为本质的原因是由于在相应高的温、压条件下组成岩石的含水矿物的脱水作用.赵国泽等(2004)通过对大地电磁剖面电性结构的研究,分析认为青藏高原东北缘地区地壳中下部出现的低阻层主要是由于含盐流体引起的.另外汪洋等(2001)研究了中国大陆的整体热流平均值,其中海原弧形构造区的平均热流值约为60 mW·m-2(刘明军,2008),略低于全球大陆平均值65 mW·m-2,从另一方面推测了下地壳高导特征为流体作用所致,而并非岩浆底侵作用和地壳部分熔融所致.
3.3 波速比分布特征我们反演获得VP、VS的同时也给出了研究区的波速比VP/VS分布(图 7, 8).由图可以看出研究区地壳VP/VS值整体位于1.6~1.8之间,平均值约为1.7,与前人研究结果较为一致(刘宝峰等,2003;李永华等,2006;肖卓和高原,2017),都接近或略低于全球VP/VS平均值1.77(Christensen,1996).将本文结果(AB剖面)与刘宝峰等(2003)沿着玛沁—靖边人工剖面的S波速度结果进行对比分析,显示沿着剖面波速比分布形态具有一致性,比如海原强震位于波速比变化相对较大的位置,其下方下地壳波速比相对较高;剖面下地壳底部波速比值相对增高,整体呈塑性;剖面海原—同心之间波速比横向变化较大,对应地震发生频繁;多条断裂(海原—六盘山断裂带F2、烟筒山—窑山断裂带F4、青铜峡—固原断裂带F5)处于波速比横向变化较大位置.
本文研究区地壳波速比变化范围为1.6~1.8,平均值约为1.70,根据泊松比与波速比的对应关系(Christensen,1996),获得泊松比对应变化范围为0.18~0.28,平均泊松比值为0.235,该值低于泊松介质的平均值和大陆地壳的平均值(Christensen,1996;肖卓和高原,2017),与利用接收函数获得的结果较为一致(李永华等,2006;Pan and Niu, 2011;刘启民等,2014;Wang et al., 2017;潘佳铁等,2017).较低的波速比与泊松比表明研究区地壳组成可能为整体呈酸性的长英质,同时也表明该区铁镁质的下地壳相对较薄或者存在缺失的可能(Zandt and Ammon, 1995;刘明军,2008).前人研究(Watanabe, 1993)表明P波和S波速度比受部分熔融影响较大, 该比值与熔融体熔融程度成正比.比如未熔融的花岗岩泊松比约为0.24, 而当部分熔融程度达到5%时,其泊松比值可达到0.31.因此, 当泊松比高于0.30时, 一般被解释为地壳存在部分熔融(Owens and Zandt, 1997),而本文研究区地壳泊松比整体较低,表明了地壳内部几乎不存在部分熔融(肖卓和高原, 2017, 王兴臣等,2017).
3.4 研究区地壳增厚模式对于青藏高原东北缘地壳增厚模式前人有大量的讨论,主要分为两种,一种是下地壳流模式(Royden et al., 1997;Clark and Royden, 2000),另一种是地壳挤压缩短模式(England et al., 1988;Dewey et al., 1988).下地壳流模型认为地壳物质以中下地壳流的方式从青藏高原内部向高原边缘流动,从而导致高原的边缘地壳增厚,因此处于熔融状态或者部分熔融状态的地壳流定然会使地壳具有较高的泊松比,进而会导致高原边缘地壳物质的泊松比增加.本文及前人的研究结果显示青藏髙原东北缘具有较低的泊松比(刘宝峰等,2003;李永华等,2006;Pan and Niu, 2011;刘启民等,2014;Zheng et al., 2016, 肖卓和高原,2017;王兴臣等,2017;Wang et al., 2017a, 2017b),因而不支持青藏高原的“地壳流”模型.Lease等(2012)利用平衡剖面方法分析计算了青藏高原东北缘新生代的地壳缩短速度, 认为新生代以来的地壳增厚主要是由地壳缩短造成的.然而对于广泛接受的岩石圈水平挤压地壳缩短增厚模式,则存在高原边缘上地壳与下地壳是否一同增厚的问题.
李永华等(2006)接收函数结果显示青藏高原东北缘镁铁质下地壳的厚度远小于长英质上地壳的厚度,认为地壳可能主要是通过上地壳的叠置形成的,因而推测青藏高原东北缘地壳缩短和增厚主要发生在上地壳;Tian和Zhang(2013)利用远震数据提取接收函数,通过地壳厚度估算了青藏高原东北缘地壳的缩短率,认为该区的地壳增厚机制主要是上地壳的作用;张洪双等(2015)通过接收函数所得结果分析认为东北缘地区的上地壳变形与下地壳存在解耦,从滑脱层的深度分布可以推测青藏高原东北缘的现今的地壳缩短以上地壳增厚为主.然而,人工地震测深研究结果(李松林等,2002;刘宝峰等,2003;刘明军等,2008)显示青藏高原东北缘壳内存在一组强反射震相,该震相可被认为是康氏不连续面存在的反映,进而该区地壳被分成两层,即上地壳和下地壳,上层地壳平均厚度约20 km,下地壳厚度由东北鄂尔多斯地块下方的21~22 km逐渐增加到西南巴颜喀拉地块下方的36~38 km;刘明军等(2008)通过人工地震测深剖面结果,进一步分析了地壳结构组成,认为青藏高原东北缘地壳增厚主要发生在下地壳;嘉世旭等(2013)通过人工地震宽角折射方法对青藏高原东北缘高原盆地与外围鄂尔多斯、四川稳定盆地地壳结构的对比分析,认为下地壳的大幅增厚(约10 km)和介质低速(相对降低达0.7%)塑性流变性揭示了地壳增厚改造主要发生在下地壳.Cheng等(2016)结果显示在祁连造山带和西秦岭下方的下地壳存在明显的低泊松比异常,认为下地壳增厚也可以减少整个地壳的泊松比.肖卓和高原(2017)依据地震层析成像结果认为祁连地块可能是青藏高原东北缘区域地壳缩短变形最强烈的地区,地壳增厚主要发生在30 km深度左右的中下地壳.
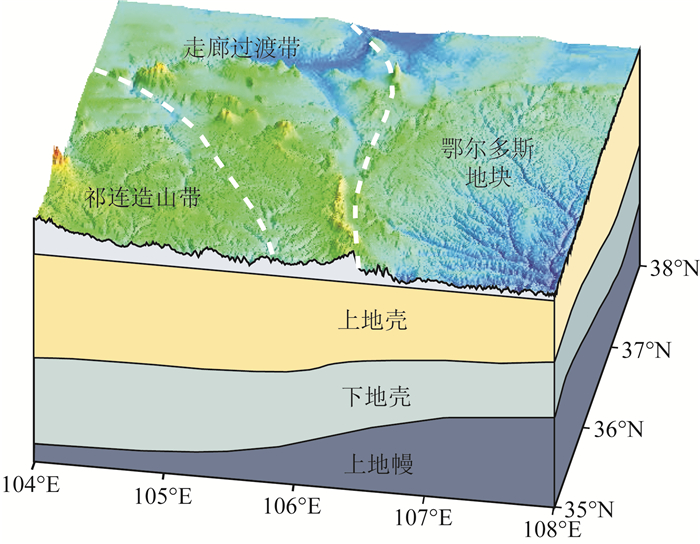
Wang等(2017b)S波二维速度结构显示以3.7 km·s-1为界,青藏高原东北缘地壳分为上下两层,其结果认为青藏高原东北缘的地壳增厚可能是由于中上地壳的加厚以及下地壳的拆沉共同影响所致;王帅军等(2019)对兰州—惠安堡—榆林地震测深剖面进行了重构,剖面显示地壳可分为上中下三层,其中上地壳与中下地壳分界约以P波速度6.3 km·s-1为界线,结果表明海原弧形构造区及邻区地壳厚度表现为上地壳和下地壳同时增厚;上述两个速度分界线的比值恰好为本文研究区地壳波速比平均值(约为1.70).我们分别将以上两个速度分界线标明在速度剖面结果上(图 8), 由图 8可以看出沿着剖面上地壳自西南的祁连块体厚度由约30 km向东北的鄂尔多斯块体逐渐减薄至20 km,变化幅值约为10 km;结合研究区Moho的分布特征(刘明军等,2008;张洪双等,2015;Wang et al., 2017b;王帅军等,2019),可以看出剖面西南的祁连块体下地壳深度范围约为30~55 km,剖面东北的鄂尔多斯块体下地壳深度范围约为20~40 km,沿着剖面自西南向东北,下地壳减薄的幅度约为10~15 km;上下地壳减薄变化的幅度较为相近,因此,我们更倾向于支持青藏高原东北缘在海原弧形构造区的区域以上、下地壳共同增厚的变形机制(图 9).
|
图 9 海原弧形构造区上、下地壳共同增厚机制卡通图 (改自Pan和Niu,2011)白色短划线表示块体分界线. Fig. 9 Cartoon map shows the crust thickening model at Haiyuan arcuate tectonic zone. This cartoon map was modified from Pan and Niu (2011) White dash lines denote block boundaries. |
本研究使用区域地震台网多年来记录到的大量P波、S波初至到时数据,利用双差地震层析成像技术获得了海原弧形构造区高分辨率的三维VP、VS以及VP/VS结构.分析讨论了速度、波速比分布与强震发生以及断裂等之间的关系,获得的主要结论如下:
(1) 反演结果显示了海原弧形构造区内更为精细的地震震源分布图像,地震主要沿断裂呈弧状展布,垂向上海原、同心等附近的地震具有近似直立的分布特征.大型断裂诸如海原—六盘山断裂带、青铜峡—固原断裂带等位于高速与低速的过渡带,断裂两侧地震波速差异较大.
(2) 三维速度结构图像整体显示速度在横向上具有较大的差异,波速比平均值约为1.70,平均泊松比值为0.235.浅层速度分布很好地反映了地表地质、地形的特征;随着深度增加到20 km至中下地壳,中下地壳速度分布显示具有与上地壳及浅层相反的特点,即大致以青铜峡—固原断裂为分界,研究区东部地区的鄂尔多斯盆地显示VP、VS与VP/VS均相对较高;西部地区整体呈现相对低速的特征,表明鄂尔多斯地块具有稳定、坚硬的中下地壳,而祁连构造带与走廊过渡带地壳内则发生了相对挤压、增厚变形、介质破碎与断裂带发育,分析均与青藏高原北东向的持续挤压及刚性的鄂尔多斯块体阻挡有关.
(3) 震源深度约为17 km的1920年海原大地震位于速度与电性结构变化较大的地方, 地表对应着较大规模断裂带;其他强震也均处于高低速过渡区域,同时研究区莫霍面具有强烈的倾斜趋势和急剧起伏变化,可见存在低速、高导层的复杂的深部结构决定了海原弧形构造区内强震发生的深部动力学环境.
(4) 通过对比分析本文结果与前人相关研究成果,基于地壳整体较低的VP、VS与VP/VS,以及相对较低的大地热流值与低速、高导的下地壳结构特征,推测研究区下地壳岩浆底侵作用和部分熔融的可能性很小,下地壳低速、高导特征主要为流体作用所致;在海原弧形构造区地壳增厚成因上,我们更加倾向于支持上、下地壳共同增厚的模式机制.
致谢 本文使用了GMT绘图软件,中国地震台网中心提供了地震观测数据,两位审稿专家对本文提出了宝贵的修改意见和建议,在此深表感谢.
Cheng B, Cheng S Y, Zhang G W, et al. 2014. Seismic structure of the Helan-Liupan-Ordos western margin tectonic belt in North-Central China and its geodynamic implications. Journal of Asian Earth Sciences, 87: 141-156. DOI:10.1016/j.jseaes.2014.01.006 |
Cheng B, Zhao D P, Cheng S Y, et al. 2016. Seismic tomography and anisotropy of the Helan-Liupan tectonic belt:Insight into lower crustal flow and seismotectonics. Journal of Geophysical Research:Solid Earth, 121(4): 2608-2635. DOI:10.1002/2015JB012692 |
Christensen N I. 1996. Poisson's ratio and crustal seismology. Journal of Geophysical Research:Solid Earth, 101(B2): 3139-3156. DOI:10.1029/95JB03446 |
Clark M K, Royden L H. 2000. Topographic ooze:building the eastern margin of Tibet by lower crustal flow. Geology, 28(8): 703-706. DOI:10.1130/0091-7613(2000)28<703:TOBTEM>2.0.CO;2 |
Deng Q D, Chen S F, Song F N, et al. 1986. Variations in the geometry and amount of slip on the Haiyuan (Nanxihuashan) fault zone, China, and the surface rupture of the 1920 Haiyuan earthquake. Earthquake Source Mechanics, Geophys. Monogr. Ser, 37: 169-182. |
Dewey J F, Shackleton R M, Chang C F, et al. 1988. The tectonic evolution of the Tibetan Plateau. Philosophical Transactions of the Royal Society A:Mathematical, Physical and Engineering Sciences, 327(1594): 379-413. DOI:10.1098/rsta.1988.0135 |
Ding Z T, Cheng B, Dong Y P, et al. 2017. Seismic imaging of the crust and uppermost mantle beneath the Qilian Orogenic Belt and its geodynamic implications. Tectonophysics, 705: 63-79. DOI:10.1016/j.tecto.2017.03.016 |
Dong X P, Teng J W. 2018. Traveltime tomography using teleseismic P wave in the northeastern Tibetan plateau. Chinese Journal of Geophysics (in Chinese), 61(5): 2066-2074. DOI:10.6038/cjg2018K0214 |
Du F, Wen X Z, Feng J G, et al. 2018. Seismo-tectonics and seismic potential of the Liupanshan fault zone (LPSFZ), China. Chinese Journal of Geophysics (in Chinese), 61(2): 545-559. DOI:10.6038/cjg2018L0181 |
Eberhart-Phillips D. 1986. Three-dimensional velocity structure in Northern California Coast Ranges from inversion of local earthquake arrival times. Bulletin of the Seismological Society of America, 76(4): 1025-1052. |
Fan J C, Li S L, Zhang X K, et al. 2004. Geometric form of haiyuan fault zone in the crustal interior and dynamics implications. Acta Seismologica Sinica (in Chinese), 26(S1): 42-49. |
Fan W Y, Chen Y S, Tang Y C, et al. 2015. Crust and upper mantle velocity structure of the eastern Tibetan Plateau and adjacent regions from ambient noise tomography. Chinese Journal of Geophysics (in Chinese), 58(5): 1568-1583. DOI:10.6038/cjg20150510 |
Fu Z X, Liu G P, Cheng Q F. 2001. Dynamic analysis on interaction between the Haiyuan-Gulang-Changma great earthquake in the north boundary of the Tibetan Plateau. Seismology and Geology (in Chinese), 23(1): 35-42. |
Gu G X. 1983. Chinese Earthquake Catalog (in Chinese). Beijing: Science Press: 1-226.
|
Guo H L, Ding Z F, Xu X M. 2017. Upper mantle structure beneath the northern South-Nouth Seismic Zone from teleseismic traveltime data. Chinese Journal of Geophysics (in Chinese), 60(1): 86-97. DOI:10.6038/cjg20170108 |
Guo H L, Ding Z F. 2018. Crustal velocity structure beneath the northern North-South Seismic Zone from local seismic tomography and its tectonic implications. Acta Seismologica Sinica (in Chinese), 40(5): 547-562. DOI:10.11939/jass.20180006 |
Han S, Han J T, Liu G X, et al. 2016. Crust and upper mantle electrical structure and tectonic deformation of the northeastern margin of the Tibetan Plateau and the adjacent Ordos Block. Chinese Journal of Geophysics (in Chinese), 59(11): 4126-4138. DOI:10.6038/cjg20161116 |
Hansen P C, O'Leary D P. 1993. The use of the L-curve in the regularization of discrete ill-posed problems. SIAM Journal on Scientific Computing, 14(6): 1487-1503. DOI:10.1137/0914086 |
Huan W L, Ge L, Chang X D. 1991. Multiple rupture characteristics of the 1920 Haiyuan M8(1/2) earthquakes. Acta Seismologica Sinica (in Chinese), 13(1): 21-31. |
Jia S X, Xu C F, Liu Z, et al. 2013. Study on the crustal structure and thickening mechanism of plateau basin in the northeastern margin of the Tibetan Plateau. Acta Geologica Sinica (in Chinese), 87(z1): 8. |
Jones A G. 1999. Imaging the continental upper mantle using electromagnetic methods. Developments in Geotectonics, 24: 57-80. DOI:10.1016/S0419-0254(99)80005-6 |
Kenner S J, Segall P. 2000. A mechanical model for intraplate earthquakes:Application to the New Madrid Seismic zone. Science, 289(5488): 2329-2332. DOI:10.1126/science.289.5488.2329 |
Lease R O, Burbank D W, Zhang H P, et al. 2012. Cenozoic shortening budget for the northeastern edge of the Tibetan Plateau:Is lower crustal flow necessary?. Tectonics, 31(3): TC3011. DOI:10.1029/2011TC003066 |
Li H Y, Shen Y, Huang Z X, et al. 2014. The distribution of the mid-to-lower crustal low-velocity zone beneath the northeastern Tibetan Plateau revealed from ambient noise tomography. Journal of Geophysical Research:Solid Earth, 119(3): 1954-1970. DOI:10.1002/2013JB010374 |
Li M J, Shen X Z, Zhang Y S, et al. 2018. Fine crustal structures of northeast margin of the Tibetan Plateau and structural features of Jiuzhaigou earthquake focal area constrained by the data from a high-density seismic array. Chinese Journal of Geophysics (in Chinese), 61(5): 2075-2087. DOI:10.6038/cjg2018L0720 |
Li S L, Zhang X K, Zhang C K, et al. 2002. A preliminary study on the crustal velocity structure of Maqin-Lanzhou-Jingbian by means of deep seismic sounding profile. Chinese Journal of Geophysics (in Chinese), 45(2): 210-217. |
Li T B. 1999. The feature and formation mechanism of arciform thrust-nappe structure zone of the southern Ningxia. Journal of Geomechanics (in Chinese), 5(3): 22-27. |
Li Y H, Wu Q J, An Z H, et al. 2006. The Poisson ratio and crustal structure across the NE Tibetan Plateau determined from receiver functions. Chinese Journal of Geophysics (in Chinese), 49(5): 1359-1368. |
Lin J Y, Duan Y H. 2016. Upper crustal structure of Haiyuan tectonic zone and its surrounding areas. Acta Seismologica Sinica (in Chinese), 38(2): 179-187. DOI:10.11939/jass.2016.02.003 |
Liu B F, Li S L, Zhang X K, et al. 2003. Study of crustal structure with s-wave data from Maqin-Jingbian profile. Acta Seismologica Sinica (in Chinese), 25(1): 82-88. |
Liu B Y, Wang X N, Yin Z W, et al. 2018. 3D P-wave crustal velocity structure of the 1927 Gulang M8 earthquake and its adjacent area. Chinese Journal of Geophysics (in Chinese), 61(10): 3980-3993. DOI:10.6038/cjg2018K0582 |
Liu M J, Li S L, Fang S M, et al. 2008. Study on crustal composition and geodynamics using seismic velocities in the northeastern margin of the Tibetan Plateau. Chinese Journal of Geophysics (in Chinese), 51(2): 412-430. |
Liu Q M, Zhao J M, Lu F, et al. 2014. Crustal structure of northeastern margin of the Tibetan Plateau by receiver function inversion. Science China Earth Sciences, 57(4): 741-750. DOI:10.1007/s11430-013-4772-5 |
Min G, Cheng J H, Yin B X, et al. 2014. The conductivity characteristics of Dagou-Luanjing middle and upper crust in Southern Ningxia arc structure. Geology in China (in Chinese), 41(5): 1464-1475. |
Owens T J, Zandt G. 1997. Implications of crustal property variations for models of Tibetan plateau evolution. Nature, 387(6628): 37-43. DOI:10.1038/387037a0 |
Pan J T, Li Y H, Wu Q J, et al. 2017. Phase velocity maps of Rayleigh wave based on a dense coverage and portable seismic array in NE Tibetan plateau and its adjacent regions. Chinese Journal of Geophysics (in Chinese), 60(6): 2291-2303. DOI:10.6038/cjg20170621 |
Pan S Z, Niu F L. 2011. Large contrasts in crustal structure and composition between the Ordos plateau and the NE Tibetan plateau from receiver function analysis. Earth and Planetary Science Letters, 303(3-4): 291-298. DOI:10.1016/j.epsl.2011.01.007 |
Pesicek J D, Thurber C H, Zhang H J, et al. 2010. Teleseismic Double-difference relocation of earthquakes along the Sumatra-Andaman subduction zone using a 3-D model. Journal of Geophysical Research:Solid Earth, 115(B10): B10303. DOI:10.1029/2010JB007443 |
Ran Y K, Deng Q D. 1998. Paleoearthquakes along Haiyuan fault and discussion of grading on rupture of large earthquakes. Quaternary Sciences (in Chinese), (3): 271-278. |
Royden L H, Burchfiel B C, King R W, et al. 1997. Surface deformation and lower crustal flow in eastern Tibet. Science, 276(5313): 788-790. DOI:10.1126/science.276.5313.788 |
Scarfì L, Giampiccolo E, Musumeci C, et al. 2007. New insights on 3D crustal structure in southeastern Sicily (Italy) and tectonic implications from an adaptive mesh seismic tomography. Physics of the Earth and Planetary Interiors, 161(1-2): 74-85. DOI:10.1016/j.pepi.2007.01.007 |
Shen X Z, Mei X P, Zhang Y S. 2011. The crustal and upper-mantle structures beneath the northeastern margin of Tibet. Bulletin of the Seismological Society of America, 101(6): 2782-2795. DOI:10.1785/0120100112 |
Shen X Z, Yuan X H, Ren J S. 2015. Anisotropic low-velocity lower crust beneath the northeastern margin of Tibetan Plateau:Evidence for crustal channel flow. Geochemistry, Geophysics, Geosystems, 16(12): 4223-4236. DOI:10.1002/2015GC005952 |
Shen X Z, Liu M, Gao Y, et al. 2017. Lithospheric structure across the northeastern margin of the Tibetan Plateau:Implications for the plateau's lateral growth. Earth and Planetary Science Letters, 459: 80-92. DOI:10.1016/j.epsl.2016.11.027 |
Tang J, Zhan Y, Zhao G Z, et al. 2005. Electrical conductivity structure of the crust and upper mantle in the northeastern margin of the Qinghai_Tibet plateau along the profile Maqên-Lanzhou-Jingbian. Chinese Journal of Geophysics (in Chinese), 48(5): 1205-1216. DOI:10.1002/cjg2.776 |
Thurber C H, Eberhart-Phillips D. 1999. Local earthquake tomography with flexible gridding. Computers & Geosciences, 25(7): 809-818. |
Thurber C H, Brocher T M, Zhang H J, et al. 2007. Three-dimensional P wave velocity model for the San Francisco Bay region, California. Journal of Geophysical Research:Solid Earth, 112(B7): B07313. DOI:10.1029/2006JB004682 |
Tian Q J, Ding G Y. 1998. The tectonic feature of a quasi trijunction in the northeastern corner of Qinghai Xizang plateau. Earthquake Research in China (in Chinese), 14(4): 27-35. |
Tian X B, Zhang Z J. 2013. Bulk crustal properties in NE Tibet and their implications for deformation model. Gondwana Research, 24(2): 548-559. DOI:10.1016/j.gr.2012.12.024 |
Tu Y M, Li Q H, Cheng J. 2000. Seismic velocity structure and electric resistivity on north segment of the north-south seismic zone. Northwestern Seismological Journal (in Chinese), 22(4): 353-360. |
Waldhauser F, Ellsworth W L. 2000. A double-difference earthquake location algorithm:method and application to the northern Hayward Fault, California. Bulletin of the Seismological Society of America, 90(6): 1353-1368. DOI:10.1785/0120000006 |
Wang C Y, Li Y H, Lou H. 2016. Issues on crustal and upper-mantle structures associated with geodynamics in the northeastern Tibetan Plateau. Chinese Science Bulletin (in Chinese), 61(20): 2239-2263. DOI:10.1360/N972016-00160 |
Wang H Y, Gao R, Yin A, et al. 2012. Deep structure geometry features of Haiyuan Fault and deformation of the crust revealed by deep seismic reflection profiling. Chinese Journal of Geophysics (in Chinese), 55(12): 3902-3909. DOI:10.6038/j.issn.0001-5733.2012.12.003 |
Wang Q, Gao Y, Shi Y T, et al. 2013. Seismic anisotropy in the uppermost mantle beneath the northeastern margin of Qinghai-Tibet plateau:evidence from shear wave splitting of SKS, PKS and SKKS. Chinese Journal of Geophysics (in Chinese), 56(3): 892-905. DOI:10.6038/cjg20130318 |
Wang Q, Gao Y. 2018. Rayleigh wave phase velocity and azimuthal anisotropy in the northeastern margin of the Tibetan plateau derived from seismic ambient noise. Chinese Journal of Geophysics (in Chinese), 61(7): 2760-2775. DOI:10.6038/cjg2018L0509 |
Wang S J, Liu B J, Tian X F, et al. 2018. Crustal P-wave velocity structure in the northeastern margin of the Qinghai-Tibetan Plateau and insights into crustal deformation. Science China Earth Sciences, 61(9): 1221-1237. DOI:10.1007/s11430-017-9227-7 |
Wang W L, Wu J P, Fang L H, et al. 2017a. Sedimentary and crustal thicknesses and Poisson's ratios for the NE Tibetan Plateau and its adjacent regions based on dense seismic arrays. Earth and Planetary Science Letters, 462: 76-85. DOI:10.1016/j.epsl.2016.12.040 |
Wang X C, Ding Z F, Wu Y, et al. 2017. Crustal thicknesses and Poisson's ratios beneath the northern section of the north-south seismic belt and surrounding areas in China. Chinese Journal of Geophysics (in Chinese), 60(6): 2080-2090. DOI:10.6038/cjg20170605 |
Wang X C, Li Y H, Ding Z F, et al. 2017b. Three-dimensional lithospheric S wave velocity model of the NE Tibetan Plateau and western North China Craton. Journal of Geophysical Research:Solid Earth, 122(8): 6703-6720. DOI:10.1002/2017JB014203 |
Wang X N, Yu X W, Zhang W B. 2015. 3D P-wave velocity structure of the crust and relocation of earthquakes in the Lushan source area. Chinese Journal of Geophysics (in Chinese), 58(4): 1179-1193. DOI:10.6038/cjg20150408 |
Wang X S, Lü J, Xie Z J, et al. 2015. Focal mechanisms and tectonic stress field in the North-South Seismic Belt of China. Chinese Journal of Geophysics (in Chinese), 58(11): 4149-4162. DOI:10.6038/cjg20151122 |
Wang Y, Deng J F, Wang J Y, et al. 2001. Terrestrial heat flow pattern and thermo-tectonic domains in the continental area of China. Journal of the Graduate School of the Chinese Academy of Sciences (in Chinese), 18(2): 51-58. |
Watanabe T. 1993. Effects of water and melt on seismic velocities and their application to characterization of seismic reflectors. Geophysical Research Letters, 20(24): 2933-2936. DOI:10.1029/93GL03170 |
Xiao Z, Gao Y. 2017. Crustal velocity structure beneath the northeastern Tibetan plateau and adjacent regions derived from double difference tomography. Chinese Journal of Geophysics (in Chinese), 60(6): 2213-2225. DOI:10.6038/cjg20170615 |
Xin H L, Zhang H J, Kang M, et al. 2018. High-resolution lithospheric velocity structure of continental china by double-difference seismic travel-time tomography. Seismological Research Letters, 90(1): 229-241. |
Xu X W, Yu G H, Ma W T, et al. 2003. Model of latest crustal tectonic motion of the central tectonic zone on the mainland of China. Earth Science Frontiers (in Chinese), 10(S1): 160-167. |
Xu Y C, Zeng X W, Xu W J, et al. 2018. Research on crustal structure of the Haiyuan-Liupanshan fault zone and its adjacent areas in northeastern Qinghai-Tibetan plateau based on seismic array. Earthquake Research in China (in Chinese), 34(3): 484-497. |
Yang Z G, Zhang X M. 2018. Ambient noise Rayleigh wave tomography in the northeastern Tibetan Plateau. Acta Seismologica Sinica (in Chinese), 40(1): 1-12. DOI:10.11939/jass.20170050 |
Ye Z, Li Q S, Gao R, et al. 2016. Anisotropic regime across northeastern Tibet and its geodynamic implications. Tectonophysics, 671: 1-8. DOI:10.1016/j.tecto.2016.01.011 |
Yin B X, Cheng J H, Min G, et al. 2013. The conductivity characteristics of middle and upper crust of Jingyuan-Yanchi, Southern Ningxia arc structure. Earth Science Frontiers (in Chinese), 20(4): 332-339. |
Yu X W, Chen Y T, Zhang H. 2010. Three-dimensional crustal P-wave velocity structure and seismicity analysis in Beijing-Tianjin-Tangshan Region. Chinese Journal of Geophysics (in Chinese), 53(8): 1817-1828. DOI:10.3969/j.issn.0001-5733.2010.08.007 |
Zandt G, Ammon C J. 1995. Continental crust composition constrained by measurements of crustal Poisson's ratio. Nature, 374(6518): 152-154. DOI:10.1038/374152a0 |
Zeng X W, Diao G L, Feng X D, et al. 2012. Determining fault plane parameters of the Haiyuan earthquake using small earthquake distribution and regional stress field. Recent Developments in World Seismology (in Chinese), (6): 80. |
Zeng X W, Xin H L, Chen C M, et al. 2005. Characteristics research of tectonic stress in southern Ningxia and its adjacent areas by focal mechanisms of small earthquakes. Journal of Seismological Research (in Chinese), 38(1): 51-57. |
Zhan Y, Zhao G Z, Chen X B, et al. 2004. Crustal structure from magnetotelluric profiling in the Haiyuan earthquake area, Ningxia Hui Autonomous Region, China. Chinese Journal of Geophysics (in Chinese), 47(2): 274-281. |
Zhan Y, Zhao G Z, Wang J J, et al. 2005. Crustal electric structure of Haiyuan arcuate tectonic region in the northeastern margin of Qinghai-Xizang Plateau, China. Acta Seismologica Sinica (in Chinese), 27(4): 431-440. DOI:10.1007/s11589-005-0024-x |
Zhan Y, Yang H, Zhao G Z, et al. 2017. Deep electrical structure of crust beneath the Madongshan step area at the Haiyuan fault in the northeastern margin of the Tibetan plateau and tectonic implications. Chinese Journal of Geophysics (in Chinese), 60(6): 2371-2384. DOI:10.6038/cjg20170627 |
Zhang H, Gao Y, Shi Y T, et al. 2012. Tectonic stress analysis based on the crustal seismic anisotropy in the northeastern margin of Tibetan plateau. Chinese Journal of Geophysics (in Chinese), 55(1): 95-104. DOI:10.6038/j.issn.0001-5733.2012.01.009 |
Zhang H J, Roecker S, Thurber C H, et al. 2012. Seismic imaging of microblocks and weak zones in the crust beneath the southeastern margin of the Tibetan Plateau. Earth Sciences: 159-202. |
Zhang H J, Thurber C H. 2003. Double-difference tomography:The method and its application to the Hayward Fault, California. Bulletin of the Seismological Society of America, 93(5): 1875-1889. DOI:10.1785/0120020190 |
Zhang H J, Thurber C. 2005. Adaptive mesh seismic tomography based on tetrahedral and Voronoi diagrams:Application to Parkfield, California. Journal of Geophysical Research:Solid Earth, 110(B4): B04303. DOI:10.1029/2004JB003186 |
Zhang H J, Thurber C. 2006. Development and applications of double-difference Seismic tomography. Pure and Applied Geophysics, 163(2-3): 373-403. DOI:10.1007/s00024-005-0021-y |
Zhang H J, Thurber C H, Bedrosian P. 2009. Joint inversion for VP, VS, and VP/VS at SAFOD, Parkfield, California. Geochemistry, Geophysics, Geosystems, 10(11): Q11002. DOI:10.1029/2009GC002709 |
Zhang H S, Gao R, Tian X B, et al. 2015. Crustal Swave velocity beneath the northeastern Tibetan plateau inferred from teleseismic Pwave receiver functions. Chinese Journal of Geophysics (in Chinese), 58(11): 3982-3992. DOI:10.6038/cjg20151108 |
Zhang Q, Sandvol E, Ni J, et al. 2011. Rayleigh wave tomography of the northeastern margin of the Tibetan Plateau. Earth and Planetary Science Letters, 304(1-2): 103-112. DOI:10.1016/j.epsl.2011.01.021 |
Zhang X K, Li S L, Wang F Y, et al. 2003. Differences of crustal structures in northeastern edge of Tibet plateau, Ordos and Tangshan earthquake region in North China-results of deep seismic sounding. Seismology and Geology (in Chinese), 25(1): 52-60. |
Zhang Z J, Bai Z M, Klemperer S L, et al. 2013. Crustal structure across northeastern Tibet from wide-angle seismic profiling:constraints on the Caledonian Qilian orogeny and its reactivation. Tectonophysics, 606: 140-159. DOI:10.1016/j.tecto.2013.02.040 |
Zhao D P, Hasegawa A, Horiuchi S. 1992. Tomographic imaging of P and S wave velocity structure beneath northeastern Japan. Journal of Geophysical Research:Solid Earth, 97(B13): 19909-19928. DOI:10.1029/92JB00603 |
Zhao J R, Li S L, Zhang X K, et al. 2005. Three dimensional moho geometry at northeast edge of Qinghai-Tibet plateau. Chinese Journal of Geophysics (in Chinese), 48(1): 78-85. |
Zhao J R, Fan Z Y, Liu B J, et al. 2017. Velocity structure of the western North China basement from high-resolution wide-angle reflection/refraction profiles. Chinese Science Bulletin (in Chinese), 62(36): 4294-4306. DOI:10.1360/N972017-00562 |
Zheng C, Ding Z F, Song X D. 2018. Joint inversion of surface wave dispersion and receiver functions for crustal and uppermost mantle structure beneath the northern north-south seismic zone. Chinese Journal of Geophysics (in Chinese), 61(4): 1211-1224. DOI:10.6038/cjg2018L0443 |
Zheng D, Li H Y, Shen Y, et al. 2016. Crustal and upper mantle structure beneath the northeastern Tibetan Plateau from joint analysis of receiver functions and Rayleigh wave dispersion. Geophysical Journal International, 204(1): 583-590. DOI:10.1093/gji/ggv469 |
Zhong S J, Wu J P, Fang L H, et al. 2017. Surface wave Eikonal tomography in and around the northeastern margin of the Tibetan plateau. Chinese Journal of Geophysics (in Chinese), 60(6): 2304-2314. DOI:10.6038/cjg20170622 |
Zhou M D, Lü T Y, Zhang Y S, et al. 2000. The geological structure background and the crustal structure in the northeastern margin of the Qinghai-Tibetan Plateau. Acta Seismologica Sinica (in Chinese), 22(6): 645-653. DOI:10.1007/s11589-000-0071-2 |
Zhou M D, Zhang Y S, Shi Y L, et al. 2006. Three-dimensional crustal velocity structure in the northeastern margin of the Qinghai-Tibetan plateau. Progress in Geophysics (in Chinese), 21(1): 127-134. |
Zhou M D, Wang C Y, Zeng R S. 2012. Seismic tomography of the velocity structure of the crust and upper mantle in northeastern margin of the Qinghai-Tibet Plateau. Northwestern Seismological Journal (in Chinese), 34(3): 224-233. |
Zuo K Z, Chen J F. 2018. 3D body-wave velocity structure of crust and relocation of earthquakes in the Menyuan area. Chinese Journal of Geophysics (in Chinese), 61(7): 2788-2801. DOI:10.6038/cjg2018L0537 |
董兴朋, 滕吉文. 2018. 青藏高原东北缘远震P波走时层析成像研究. 地球物理学报, 61(5): 2066-2074. DOI:10.6038/cjg2018K0214 |
杜方, 闻学泽, 冯建刚, 等. 2018. 六盘山断裂带的地震构造特征与强震危险背景. 地球物理学报, 61(2): 545-559. DOI:10.6038/cjg2018L0181 |
樊计昌, 李松林, 张先康, 等. 2004. 海原断裂在地壳深处的几何形态及其动力学意义. 地震学报, 26(S1): 42-49. |
范文渊, 陈永顺, 唐有彩, 等. 2015. 青藏高原东部和周边地区地壳速度结构的背景噪声层析成像. 地球物理学报, 58(5): 1568-1583. DOI:10.6038/cjg20150510 |
傅征祥, 刘桂萍, 陈棋福. 2001. 青藏高原北缘海原、古浪、昌马大地震间相互作用的动力学分析. 地震地质, 23(1): 35-42. DOI:10.3969/j.issn.0253-4967.2001.01.004 |
顾功叙. 1983. 中国地震目录. 北京: 科学出版社: 226.
|
顾芷娟, 郭才华, 李彪, 等. 1995. 壳内低速高导层成因初步探讨. 中国科学(B辑), 25(1): 108-112. |
郭慧丽, 丁志峰, 徐小明. 2017. 南北地震带北段的远震P波层析成像研究. 地球物理学报, 60(1): 86-97. DOI:10.6038/cjg20170108 |
郭慧丽, 丁志峰. 2018. 南北地震带北段的地壳速度结构及其构造启示. 地震学报, 40(5): 547-562. DOI:10.11939/jass.20180006 |
韩松, 韩江涛, 刘国兴, 等. 2016. 青藏高原东北缘至鄂尔多斯地块壳幔电性结构及构造变形研究. 地球物理学报, 59(11): 4126-4138. DOI:10.6038/cjg20161116 |
环文林, 葛民, 常向东. 1991. 1920年海原8(1/2)级大地震的多重破裂特征. 地震学报, 13(1): 21-31. |
嘉世旭, 徐朝繁, 刘志, 等. 2013. 青藏高原东北缘高原盆地地壳结构与增厚机制探测研究. 地质学报, 87(z1): 8. |
金延龙, 杨明芝, 赵卫明, 等. 1999. 利用区域台网记录的直达、反射和折射波反演宁夏及邻区地壳P波三维速度结构. 地震学报, 21(4): 394-402. DOI:10.3321/j.issn:0253-3782.1999.04.009 |
李敏娟, 沈旭章, 张元生, 等. 2018. 基于密集台阵的青藏高原东北缘地壳精细结构及九寨沟地震震源区结构特征分析. 地球物理学报, 61(5): 2075-2087. DOI:10.6038/cjg2018L0720 |
李松林, 张先康, 张成科, 等. 2002. 玛沁-兰州-靖边地震测深剖面地壳速度结构的初步研究. 地球物理学报, 45(2): 210-217. DOI:10.3321/j.issn:0001-5733.2002.02.007 |
李天斌. 1999. 宁夏南部弧形推覆构造带特征及演化. 地质力学学报, 5(3): 22-27. DOI:10.3969/j.issn.1006-6616.1999.03.004 |
李永华, 吴庆举, 安张辉, 等. 2006. 青藏高原东北缘地壳S波速度结构与泊松比及其意义. 地球物理学报, 49(5): 1359-1368. DOI:10.3321/j.issn:0001-5733.2006.05.015 |
林吉焱, 段永红. 2016. 海原构造区及其周缘上部地壳结构研究. 地震学报, 38(2): 179-187. DOI:10.11939/jass.2016.02.003 |
刘宝峰, 李松林, 张先康, 等. 2003. 玛沁-靖边剖面S波资料研究与探讨. 地震学报, 25(1): 82-88. DOI:10.3321/j.issn:0253-3782.2003.01.010 |
刘白云, 王小娜, 尹志文, 等. 2018. 1927年古浪8级大震及其周边地区三维地壳P波速度结构特征. 地球物理学报, 61(10): 3980-3993. DOI:10.6038/cjg2018K0582 |
刘明军, 李松林, 方盛明, 等. 2008. 利用地震波速研究青藏高原东北缘地壳组成及其动力学. 地球物理学报, 51(2): 412-430. DOI:10.3321/j.issn:0001-5733.2008.02.014 |
刘启民, 赵俊猛, 卢芳, 等. 2014. 用接收函数方法反演青藏高原东北缘地壳结构. 中国科学:地球科学, 44(4): 668-679. |
闵刚, 程建华, 尹秉喜, 等. 2014. 宁南弧形构造带甘肃大沟-内蒙古乱井中上地壳电性结构. 中国地质, 41(5): 1464-1475. DOI:10.3969/j.issn.1000-3657.2014.05.005 |
潘佳铁, 李永华, 吴庆举, 等. 2017. 基于密集流动地震台阵的青藏高原东北缘及邻区Rayleigh波相速度层析成像. 地球物理学报, 60(6): 2291-2303. DOI:10.6038/cjg20170621 |
冉勇康, 邓起东. 1998. 海原断裂的古地震及特征地震破裂的分级性讨论. 第四纪研究, (3): 271-278. DOI:10.3321/j.issn:1001-7410.1998.03.011 |
汤吉, 詹艳, 赵国泽, 等. 2005. 青藏高原东北缘玛沁-兰州-靖边剖面地壳上地幔电性结构研究. 地球物理学报, 48(5): 1205-1216. DOI:10.3321/j.issn:0001-5733.2005.05.032 |
田勤俭, 丁国瑜. 1998. 青藏高原东北隅似三联点构造特征. 中国地震, 14(4): 27-35. |
涂毅敏, 李清河, 成瑾. 2000. 南北地震带北段速度结构与电阻率特性. 西北地震学报, 22(4): 353-360. |
王椿镛, 李永华, 楼海. 2016. 与青藏高原东北部地球动力学相关的深部构造问题. 科学通报, 61(20): 2269-2263. DOI:10.1360/N972016-00160 |
王海燕, 高锐, 尹安, 等. 2012. 深地震反射剖面揭示的海原断裂带深部几何形态与地壳形变. 地球物理学报, 55(12): 3902-3909. DOI:10.6038/j.issn.0001-5733.2012.12.003 |
王琼, 高原, 石玉涛, 等. 2013. 青藏高原东北缘上地幔地震各向异性:来自SKS、PKS和SKKS震相分裂的证据. 地球物理学报, 56(3): 892-905. DOI:10.6038/cjg20130318 |
王琼, 高原. 2018. 基于背景噪声研究青藏高原东北缘瑞利波相速度和方位各向异性. 地球物理学报, 61(7): 2760-2775. DOI:10.6038/cjg2018L0509 |
王帅军, 刘保金, 田晓峰, 等. 2019. 青藏高原东北缘地壳P波速度结构及其对地壳变形研究的启示. 中国科学:地球科学, 49(2): 368-382. DOI:10.1360/N072017-00357 |
王兴臣, 丁志峰, 武岩, 等. 2017. 中国南北地震带北段及其周缘地壳厚度与泊松比研究. 地球物理学报, 60(6): 2080-2090. DOI:10.6038/cjg20170605 |
王小娜, 于湘伟, 章文波. 2015. 芦山震区地壳三维P波速度精细结构及地震重定位研究. 地球物理学报, 58(4): 1179-1193. DOI:10.6038/cjg20150408 |
王晓山, 吕坚, 谢祖军, 等. 2015. 南北地震带震源机制解与构造应力场特征. 地球物理学报, 58(11): 4149-4162. DOI:10.6038/cjg20151122 |
汪洋, 邓晋福, 汪集肠, 等. 2001. 中国大路热流分布特征及热-构造分区. 中国科学院研究生院学报, 18(2): 51-58. DOI:10.3969/j.issn.1002-1175.2001.01.008 |
肖卓, 高原. 2017. 利用双差成像方法反演青藏高原东北缘及其邻区地壳速度结构. 地球物理学报, 60(6): 2213-2225. DOI:10.6038/cjg20170615 |
许英才, 曾宪伟, 许文俊, 等. 2018. 基于台阵的青藏高原东北缘海原-六盘山断裂带及邻区地壳结构研究. 中国地震, 34(3): 484-497. DOI:10.3969/j.issn.1001-4683.2018.03.010 |
徐锡伟, 于贵华, 马文涛, 等. 2003. 中国大陆中轴构造带地壳最新构造变动样式及其动力学内涵. 地学前缘, 10(S1): 160-167. |
杨志高, 张雪梅. 2018. 青藏高原东北缘噪声层析成像研究. 地震学报, 40(1): 1-12. DOI:10.11939/jass.20170050 |
尹秉喜, 程建华, 闵刚, 等. 2013. 宁南弧形构造带甘肃靖远-宁夏盐池剖面中上地壳电性结构特征. 地学前缘, 20(4): 332-339. |
于湘伟, 陈运泰, 张怀. 2010. 京津唐地区地壳三维P波速度结构与地震活动性分析. 地球物理学报, 53(8): 1817-1828. DOI:10.3969/j.issn.0001-5733.2010.08.007 |
曾宪伟, 莘海亮, 陈春梅, 等. 2005. 利用小震震源机制解研究宁夏南部及邻区构造应力场. 地震研究, 38(1): 51-57. |
曾宪伟, 刁桂苓, 冯向东, 等. 2012. 利用小震分布和区域应力场确定海原大地震断层面参数. 国际地震动态, (6): 80. |
詹艳, 赵国泽, 陈小斌, 等. 2004. 宁夏海原大震区西安州-韦州剖面大地电磁探测与研究. 地球物理学报, 47(2): 274-281. DOI:10.3321/j.issn:0001-5733.2004.02.014 |
詹艳, 赵国泽, 王继军, 等. 2005. 青藏高原东北缘海原弧形构造区地壳电性结构探测研究. 地震学报, 27(4): 431-440. DOI:10.3321/j.issn:0253-3782.2005.04.010 |
詹艳, 杨皓, 赵国泽, 等. 2017. 青藏高原东北缘海原构造带马东山阶区深部电性结构特征及其构造意义. 地球物理学报, 60(6): 2371-2384. DOI:10.6038/cjg20170627 |
张辉, 高原, 石玉涛, 等. 2012. 基于地壳介质各向异性分析青藏高原东北缘构造应力特征. 地球物理学报, 55(1): 95-104. DOI:10.6038/j.issn.0001-5733.2012.01.009 |
张洪双, 高锐, 田小波, 等. 2015. 青藏高原东北缘地壳S波速度结构及其动力学含义——远震接收函数提供的证据. 地球物理学报, 58(11): 3982-3992. DOI:10.6038/cjg20151108 |
张培震, 闵伟, 邓起东, 等. 2003. 海原活动断裂带的古地震与强震复发规律. 中国科学(D辑), 33(8): 705-713. |
张先康, 李松林, 王夫运, 等. 2003. 青藏高原东北缘、鄂尔多斯和华北唐山震区的地壳结构差异——深地震测深的结果. 地震地质, 25(1): 52-60. DOI:10.3969/j.issn.0253-4967.2003.01.006 |
赵国泽, 汤吉, 詹艳, 等. 2004. 青藏高原东北缘地壳电性结构和地块变形关系的研究. 中国科学D辑:地球科学, 34(10): 908-918. |
赵金仁, 李松林, 张先康, 等. 2005. 青藏高原东北缘莫霍界面的三维空间构造特征. 地球物理学报, 48(1): 78-85. DOI:10.3321/j.issn:0001-5733.2005.01.013 |
赵金仁, 范振宇, 刘保金, 等. 2017. 爆破地震揭示的华北西部高分辨基底速度结构. 科学通报, 62(36): 4294-4306. DOI:10.1360/N972017-00562 |
郑晨, 丁志峰, 宋晓东. 2018. 面波频散与接收函数联合反演南北地震带北段壳幔速度结构. 地球物理学报, 61(4): 1211-1224. DOI:10.6038/cjg2018L0443 |
钟世军, 吴建平, 房立华, 等. 2017. 青藏高原东北缘及周边地区基于程函方程的面波层析成像. 地球物理学报, 60(6): 2304-2314. DOI:10.6038/cjg20170622 |
周俊喜, 刘百篪, 李玉龙. 1983. 1920年海原8.5级地震断层晚更新世以来活动特征的初步研究. 西北地震学报, (S1): 59-64. |
周民都, 吕太乙, 张元生, 等. 2000. 青藏高原东北缘地质构造背景及地壳结构研究. 地震学报, 22(6): 645-653. DOI:10.3321/j.issn:0253-3782.2000.06.011 |
周民都, 张元生, 石雅鏐, 等. 2006. 青藏高原东北缘地壳三维速度结构. 地球物理学进展, 21(1): 127-134. DOI:10.3969/j.issn.1004-2903.2006.01.019 |
周民都, 王椿镛, 曾融生. 2012. 青藏高原东北缘地壳上地幔速度结构的地震层析成像研究. 西北地震学报, 34(3): 224-233. |
左可桢, 陈继锋. 2018. 门源地区地壳三维体波速度结构及地震重定位研究. 地球物理学报, 61(7): 2788-2801. DOI:10.6038/cjg2018L0537 |
 2020, Vol. 63

