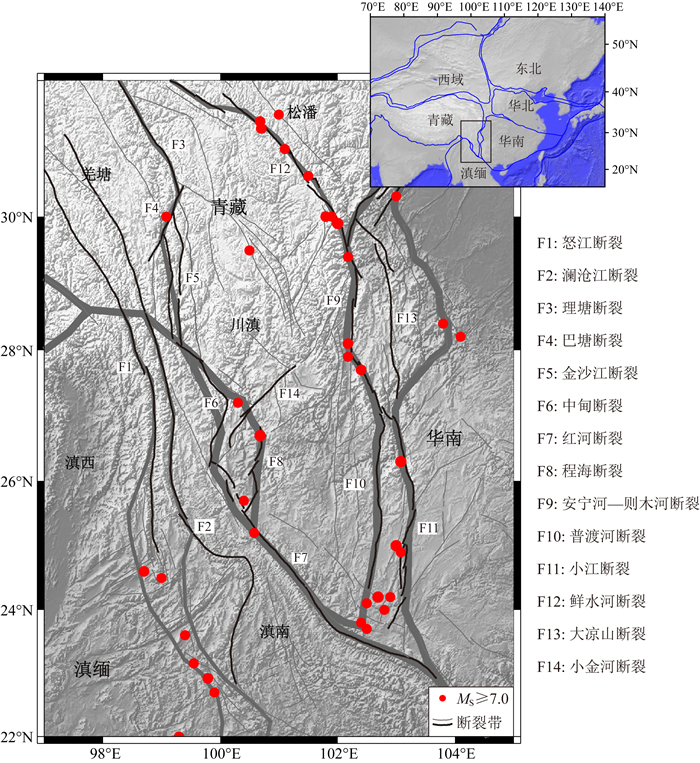
青藏高原平均海拔超过4000 m,虽然青藏高原的隆升与印度板块对欧亚大陆的碰撞挤压有关,但地壳与上地幔物质的运移和深部动力学过程是更重要的原因.研究显示,青藏高原深部物质向东迁移,比较有代表性的物质向东迁移逃逸模式有刚性挤出模式(Tapponnier et al., 1982, 2001)、连续变形模式(England and Houseman, 1986; England and Molnar, 1997)、下地壳流或下地壳管道流模式(Royden et al., 1997; Clark and Royden, 2000; Clark et al., 2005).这些研究认识虽然有差异,但都一致地认为青藏高原的隆升起因于非常复杂的构造变形和深部物质运动.青藏高原向东迁移的物质在东部遇到四川盆地坚硬块体的阻挡,在青藏东南缘向东南方向折转,进入川滇南部地区后,运动方向很快转为向南,导致了青藏高原东南缘的地表运动方向的顺时针变化,大地测量资料清楚地呈现出这种地表运动现象(Wang et al., 2001; Zhang et al., 2004; Jin et al., 2019).地震层析成像得到深部高、低速度异常分布,提出青藏高原东缘存在“大地幔楔”深部构造(Lei et al., 2009, 2019; Lei and Zhao, 2016).青藏东南缘地形起伏变化很大,地壳变形强烈,地震非常活跃(图 1),该区分布有丰富的金属矿床,这些现象揭示了青藏东南缘复杂的壳幔结构,存在剧烈的深部物质运动(Wang et al., 2008;Bai et al., 2010;王琼和高原,2014;王琼等,2015;范莉苹等, 2015;李秋生等,2018;Jin et al., 2019;Liu et al., 2019).
|
图 1 青藏东南缘构造背景与历史地震活动背景 历史地震(震级大于等于7)目录来自中国地震台网中心.图中的灰色粗线是块体边界,块体划分依据张培震等(2003)的研究结果. Fig. 1 Tectonic settings and historic earthquakes in the southeastern margin of the Tibetan Plateau The historic earthquakes of magnitudes larger than 7 are from the China Earthquake Networks Center. The grey thick lines denote boundaries of the major tectonic blocks from Zhang et al. (2003). |
地壳电性结构研究认为,青藏东南缘可能有两条下地壳流通道,沿着两个块体边界往东南方向延伸(Bai et al., 2010).地震学的结构反演,显示出在下地壳深度存在较大范围的低速区,但不同的研究者给出的低速分布形态并不一样(Huang et al., 2002, 2015; Yao et al., 2006; 2010;Wang et al., 2008, 2010; Zhao et al., 2013; Sun et al., 2014; Chen et al., 2014; Bao et al., 2015; Yang et al., 2020).在挤压作用和深部构造的综合作用下,上地壳物质的变形与深部壳幔物质的运移,必然会在地球物理资料上留下印迹,而能够揭示这种变形与运动形态有效的研究方法就是地震各向异性(Crampin et al., 1980; Vinnik et al., 1989; Silver and Chan, 1991; 郑斯华和高原,1994;滕吉文等,2000;高原和滕吉文,2005;Crampin and Gao, 2018; Wu et al., 2015, 2019; Shi et al., 2020).在青藏东南缘,已经有一些关于地壳与上地幔各向异性的研究成果(Wang et al., 2008; Chen et al., 2009, 2013; Yao et al., 2010; Sun et al., 2012; Yao, 2012; 孙长青等,2013;鲁来玉等,2014;常利军等,2015;Huang et al., 2015; Cai et al., 2016; Chen et al., 2016; Kong et al., 2018;朱涛,2018;Liu et al., 2019).由于资料的不同,方法的不同,研究的具体对象不同,得到的结果也不同,该区域缺乏一个区域性的各向异性的整体图像.此外,以上的这些研究主要使用的是远震资料和背景噪声面波资料,没有使用近震资料,而近场地震资料反映的上地壳各向异性与应力、断裂和局部构造密切相关(高原等, 1995, 2018;Cochran et al., 2006; Gao and Crampin, 2006; Wu et al., 2009; Gao et al., 2011; Shi et al., 2009, 2012, 2020; Li and Peng, 2017).因此,整理和分析近震、远震和连续记录的背景噪声资料得到的各向异性结果具有重要意义.本研究收集整理了近年来本研究组在青藏东南缘开展的地震各向异性研究的资料(Shi et al., 2009, 2012; 王琼等,2015;太龄雪等,2015;张艺和高原,2017),增加计算了一些新的数据,结合其他研究者的结果(例如:常利军等,2015),重建了青藏高原东南缘的壳幔地震各向异性图像,并进行各向异性区域构造意义的讨论,其结果可为深部构造与动力模式研究提供更详细的地震学观测资料和有益的科学参考.
1 区域小震资料揭示的青藏东南缘上地壳地震各向异性地壳介质的地震各向异性特性与地壳结构、应力状态、断裂性质等密切相关(Crampin, 1981; Crampin et al., 1980, 2008; 高原等,1995;2010;2018;Zinke and Zoback, 2000; Tadokoro and Ando, 2002; Boness and Zoback, 2006; Gao et al., 2011; Crampin and Gao, 2018),下地壳的各向异性还可能与矿物晶体的定向排列或物质流动有关(例如:Yao et al., 2006, 2010; Sun et al., 2012, 2014; 王琼和高原, 2014; Chen et al., 2016; Xie et al., 2017).虽然地震学家对造成地壳介质的地震各向异性有多种解释,岩石的节理或特定结构的排列方式、水平分层结构、应力的作用等都会造成各向异性,但地壳中广泛存在的EDA(Extensive-DilatancyAnisotropy,“广泛扩容各向异性”,也有称为“大范围扩容各向异性”、“张性扩容各向异性”)微裂隙是地壳各向异性的主要原因(Crampin and Peacock, 2005;Crampin and Gao, 2014).研究表明,地壳(特别是上地壳)中广泛存在着大量直立的近似平行排列的含有流体的EDA微裂隙,地震波穿过这种各向异性的EDA裂隙结构传播时会发生剪切波分裂(Shear-wave splitting,以下简记为SWS)现象.在剪切波入射角小于全反射角的情况下,不同射线方向快剪切波偏振方向(以下简称快波方向)在水平方向上近似平行,该方向平行于原地水平主压应力方向(Tadokoro and Ando, 2002; Crampin and Peacock, 2005;Gao et al., 2011;高原等, 1995, 2018),并被用来推演区域的主压应力方向,与其他地震学方法应力反演、地应力测量和GPS地表观测等结果有很好的一致性(高原和吴晶,2008).理论与观测都发现应力变化会改变岩石中EDA微裂隙的几何形体,进而导致SWS参数的变化(Zatsepin and Crampin, 1997; Crampin and Zatsepin, 1997; Gao et al., 1998; Gao and Crampin, 2004; Gerst and Savage, 2004),本文仅讨论SWS参数的静态分布及其构造问题.
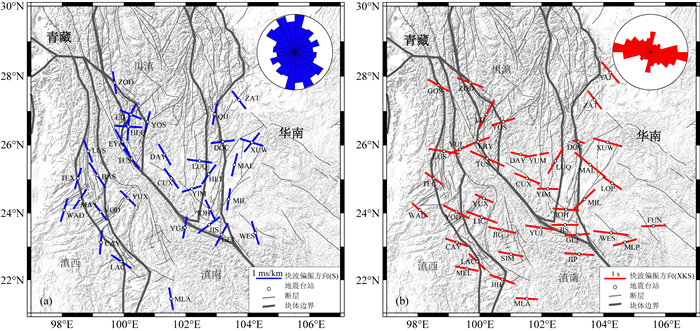
云南地区位于青藏高原的东南缘,使用区域地震台网固定地震台站2000年1月—2010年10月的区域小地震的波形记录,采用高原等(2004)提出的SWS分析技术,获得了云南地区的SWS快波方向分布(Shi et al., 2009, 2012);同时,使用该地震台网2007年8月—2010年10月的远震波形记录,采用XKS震相(SKS、PKS和SKKS三种震相的统称)分裂分析技术,获得了云南地区的XKS快波方向分布(Shi et al., 2012).图 2给出了基于固定地震台网资料得到的青藏东南缘壳幔快波方向的空间分布,揭示了区域岩石圈方位各向异性特征,图 2中的SWS与XKS数据皆使用Shi等(2012)的结果重新绘制.
|
图 2 青藏东南缘壳幔方位各向异性快波方向的空间分布基本形态 左图的蓝色短线段表示SWS平均快波方向,反映了上地壳方位各向异性;右图的红色短线段表示XKS平均快波方向,反映了岩石圈方位各向异性.两张图的右上角,分别是汇集全部台站资料的等面积投影玫瑰图.据Shi等(2012)重绘. Fig. 2 Fast orientations of azimuthal anisotropy in the crust and the upper mantle in the southeastern margin of the Tibetan Plateau The left is azimuthal anisotropy in the upper crust. The blue short lines are average fast polarizations of SWS (shear-wave splitting). The right is azimuthal anisotropy in the lithosphere. The red short lines are average fast orientations of XKS (means three phases of SKS, PKS and SKKS). The upper-right in each plot is the equal area projection rose diagrams of all fast orientations. |
根据图 2a,从整个区域来看,可以看到SWS的优势快波方向为NNW近NS方向,根据震源机制反演以及其他数据得到的区域应力研究结果(程万正等,2003;吴建平等,2004;刘平江等,2007;钱晓东等,2011),这个优势快波方向与区域主压应力方向在趋势上是一致的,反映了SWS可以用于应力分析.一些快波方向为NW的台站大都在红河断裂或澜沧江断裂与怒江断裂周围,反映了由于地壳运动和应力作用,在这些断裂周围形成了一个变形一致的小区域,这可能揭示了红河断裂作为一个可能贯穿地壳的深断裂对周围介质物性有很强的控制作用.在小江断裂带周围,一些台站快波方向平行于小江断裂走向,但也有几个台站快波方向近似垂直于小江断裂走向,暗示了在小江断裂带可能存在局部的分层结构,揭示了小江断裂受到了华南块体东西向的强烈作用.还有一个重要现象,区域SWS的快波方向虽然有优势方向,但比较离散,显然与区域内存在大量走向与性质都有差异的断裂有关,而这些复杂的断裂分布实际上反映了深部物质运动的复杂性.
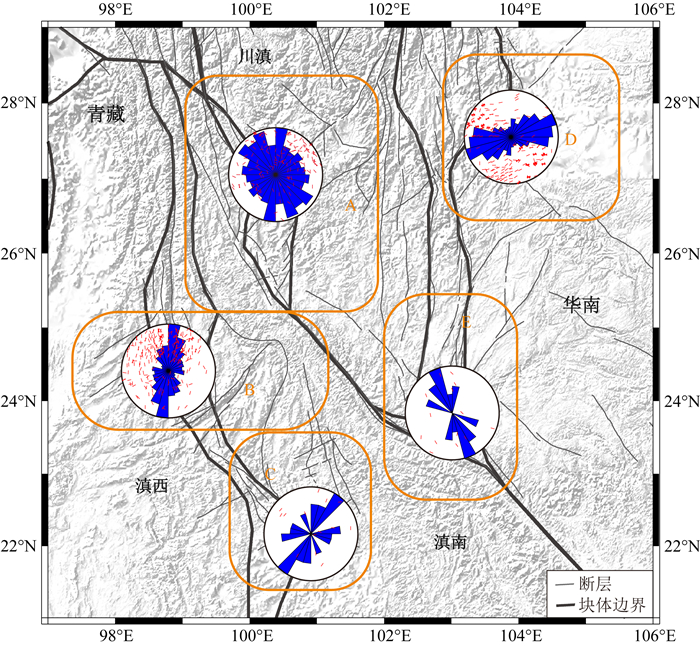
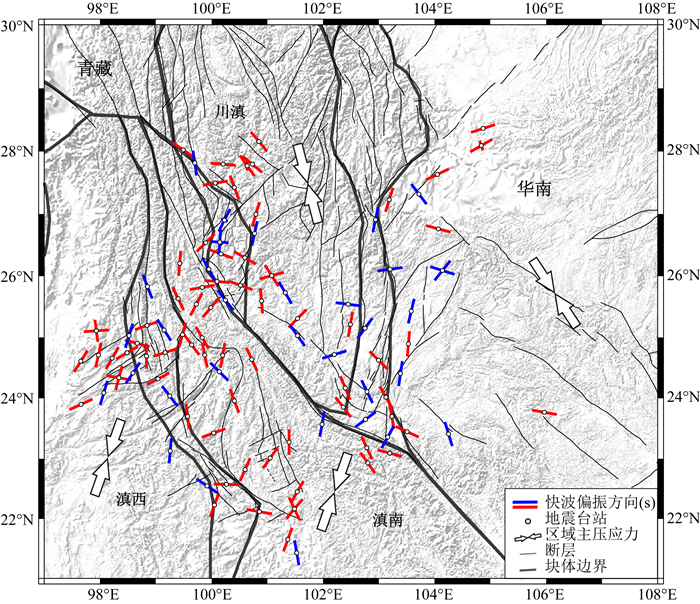
中国地震科学台阵(也称喜马拉雅台阵计划)第Ⅰ期观测覆盖了青藏东南缘地区,该流动地震台站的观测时间为2011年1月至2014年6月,比固定地震台网更为密集,台间距约~40 km.采用同样的SWS分析技术(高原等,2004),我们获得了比之前的结果更密集的青藏东南缘地区SWS快波方向空间分布(图 3).图 3使用了张艺和高原(2017)中的SWS数据进行重绘,其中包含了太龄雪等(2015)使用该台阵观测资料的SWS数据.结果显示,SWS快波方向分布具有分区性,不同分区的特征与构造密切相关.在川滇块体中部西侧,三江侧向碰撞带区域(图 3中的A区),SWS的优势快波方向为NNW近NS方向,与固定台站资料得到的结果类似.但往南大约在23°N—25°N范围,优势快波方向呈现变化,西侧为近NNE方向(图 3中的B区),东侧为近NW方向(图 3中的E区).这个形态从空间上看,与GPS获得的地表运动及变形特征相符(Jin et al., 2019).继续往南,在滇西与滇南交界区,断裂(及块体分界线)走向被扭弯的地方,优势快波方向也与北部的不同,变为NE方向.在研究区的东北,位于华南块体内的区域,优势快波方向非常独特,呈NEE方向,进一步揭示了华南块体东西向作用的强烈影响.每个地震台站(包括固定台与流动台)的平均快波偏振方向在区域上的分布特征则展示了更多的局部细节(图 4).
|
图 3 青藏东南缘上地壳快剪切波偏振方向的空间分区特征 使用中国地震科学台阵(喜马拉雅计划)Ⅰ期的资料,SWS数据来自张艺和高原(2017).图中的A、B、C、D和E是分区的标识符. Fig. 3 Spatial subzone distribution of fast polarizations in the upper crust in the southeastern margin of the Tibetan Plateau The SWS data are from Zhang and Gao (2017), initial seismic data are from ChinaArray Phase Ⅰ. The subzones are marked A, B, C, D, and E. |
|
图 4 青藏东南缘上地壳快剪切波平均偏振方向的空间分布综合结果 成对的白色箭头代表主压应力方向.蓝色数据来自Shi等(2012),红色数据来自张艺和高原(2017). Fig. 4 Comprehensive spatial distribution of average fast polarizations in the upper crust in the southeastern margin of the Tibetan Plateau The pairs of white arrows stand for directions of principal compressive stress. The SWS data in blue are from Shi et al. (2012) and the SWS data in red Zhang and Gao (2017). |
利用密集流动地震台阵(SL Array)获得的最新结果也显示,在三江侧向碰撞带靠近澜沧江断裂与怒江断裂的周围,红河断裂西北端部位置,SWS的优势快波方向为近NS方向,但由西往东显示了从NNW到NS再到NNE的渐变态势(Gao et al., 2019),该研究还发现了个别台站存在双重优势方向,与本研究得到的结果类似(图 2).
2 远震资料揭示的青藏东南缘岩石圈地震各向异性使用区域固定地震台站(2007年8月—2010年10月)远震波形记录得到的云南地区的XKS快波方向,展现出非常强烈的近EW方向的优势分布,但也显示出一个近NS方向的优势方向(图 2b).图 2b中XKS快波方向近似为NS方向的台站都位于区域的北部,大致在26°N以北;换一个角度看,XKS快波方向近似为EW或WNW方向的台站基本上都位于区域的南部,大致在26°N以南.早先的研究曾发现该区域XKS特征出现南、北分区的现象,但限于有效数据较少,没能给出更清晰的南、北分界的位置(Lev et al., 2006; Wang et al., 2008; Shi et al., 2012).
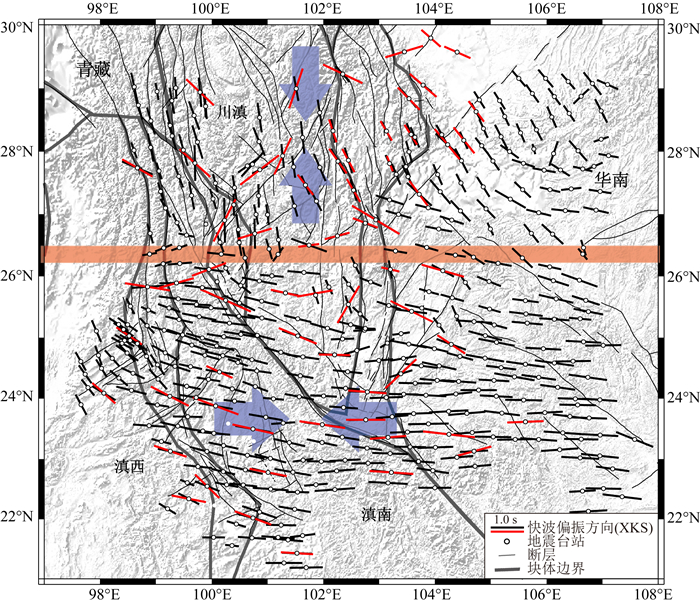
使用中国地震科学台阵第Ⅰ期流动地震台站的地震资料(观测时段2011年8月至2013年9月),得到青藏东南缘地区XKS快波方向分布结果(常利军等,2015).由于研究区域上的重合,我们把固定地震台网得到的XKS快波方向(Shi et al., 2012)结果合并一起,绘制成青藏东南缘地区更全面的XKS快波方向区域分布图(图 5).在图 5中,增加了本研究对位于四川行政区域内的23个固定台站资料开展XKS分裂分析的新结果(表 1).图 5清楚地显示,XKS快波方向明显地分为两个子区,每个子区的XKS快波方向特征截然不同.在研究区域的北部(北区),由于位于不同的构造部位,不同的台站虽然显示出一些方向上的差异,但整体上看,XKS快波方向大致为NS方向.在研究区域的南部(南区),不同的台站虽然也显示出有方向上的差异,但XKS快波方向总体上大致为EW方向,且趋势上具有非常一致的连贯性.XKS快波方向从北部的NS方向突然改变为南部的EW方向,分界大致在26°20′N(图 5).显然,更多的观测资料凸显了更清晰的深部构造信息.
|
图 5 青藏东南缘穿透岩石圈与上地幔软流圈的XKS平均快波方向空间分布综合结果 红色线段的数据来自固定地震台站(Shi et al. 2012),这里增加了研究区北部四川地震台网(2007年8月到2010年10月)的新结果(见表 1).黑色线段的数据来自流动地震台站(常利军等,2015).两对淡蓝色粗箭头分别是的两个分区的优势快波方向.图中的灰色粗线是块体边界,含义同图 1. Fig. 5 Comprehensive spatial distribution of average XKS fast orientations in the southeastern margin of the Tibetan Plateau The red short lines are XKS data recorded by permanent seismic stations, including data from Shi et al. (2012) and new increased data (August 2007 to October 2010) in north part of the study area in this paper (see Table 1). The black short lines are XKS data recorded by ChinaArray Phase Ⅰ from Chang et al. (2015). Two pairs of thick arrows in light blue are dominant XKS fast orientations in two subzones, respectively. The grey thick lines denote boundaries of the major tectonic blocks, same as in Fig. 1. |
|
|
表 1 青藏东南缘新增23个固定地震台站XKS分裂参数 Table 1 The XKS (SKS, PKS and SKKS) split parameters of 23 permanent seismic stations in the southeastern margin of the Tibetan Plateau, new increased in this paper |
从图像上看,这种XKS快波方向的突然改变是发生在川滇块体下方和其西侧的三江碰撞带下方的区域,这个区域处于喜马拉雅东构造结的东南前缘.GPS资料揭示的地表运动(以欧亚大陆为参照)在这里从SE方向顺时针旋转为NS方向,往南更趋近于SSW方向(Jin et al., 2019).由GPS资料计算得到的上地壳介质的主压应变方向(Jin et al., 2019)与上地壳各向异性展现的快波优势方向有很好的一致性(太龄雪等,2015;张艺和高原,2017;Gao et al., 2019),但与主要反映岩石圈方位各向异性的XKS快波方向有特征上的差异(Shi et al., 2012; 常利军等,2015).在大约26°20′N以南区域(南区),地壳(至少中上地壳)的介质变形与地表特征有很好的一致,但是与岩石圈介质变形的整体特征不一致,这种现象揭示了深部的岩石圈地幔物质的变形与浅部的岩石圈地壳截然不同.
在青藏东南缘下方,不同的层析成像结果显示的中下地壳低速层分布形态差异较大(Yao et al., 2006; Wang et al., 2010; Chen et al., 2014; Huang et al., 2015; Bao et al., 2015; 王琼等,2015),并且与XKS快波近EW方向的分布区域明显不同.因此,下地壳流不能解释这种XKS方位各向异性分布南北变化剧烈的特征.
印度板块北部下插到欧亚大陆下方(Chen et al., 2015),但印度板块东北部缅甸板块可能往东下插到缅甸弧下方的上地幔过渡带,这种下插或后撤运动可能造成腾冲火山下方的软流圈热物质上涌,该高波速异常在地幔转换带内往东到达小江断裂带下方(Li et al., 2008; Lei et al., 2009, 2019; Lei and Zhao, 2016).这种深部过程,同时也可能造成上地幔热物质在东西方向上的流动(Li et al., 2008; Lei and Zhao, 2016).上地幔层析成像得到,在150~200 km深度范围,S波速度与P波速度都显示有大范围的低速区存在于红河断裂带与小江断裂带南段的下方(Li et al., 2008; Wang et al., 2010),低速区的形态与XKS快波近EW方向的分布区域有很好的一致性.层析成像与各向异性研究结果都显示川滇块体壳幔结构和物性存在显著的空间不均匀性.接收函数结果显示,地壳厚度变化剧烈,由北往南大约在26°N附近,地壳厚度和泊松比都显示出快速变小的特征(Wang et al., 2017; Zhang and Gao, 2019).岩石圈厚度研究结果也显示,大约在26°N以南的岩石圈厚度为80~100 km,较薄;以北的岩石圈厚度为120~140 km,更厚(Yang et al., 2017).综合这些地震学观测结果,我们推测青藏东南缘上地幔高速体至少到200 km深度范围,北部有相对坚硬的高速物质,而南部则为相对软弱的低速物质,深部物性明显不同的南、北两个部分的分界线,大致就在26°20′N附近.
在研究区东部的华南块体里,XKS快波方向显示出一定的趋势性的渐变特点,呈现出华南块体与青藏高原接触作用下岩石圈物质的变形特点.虽然地幔物质运动的动力来源还不清楚,但是根据已有的地球物理资料,我们推测在川滇块体下方,北部有厚而坚硬岩石圈,其岩石圈南侧边缘形成了一个近EW走向的近直立的类似墙面构造,造成南部软弱的上地幔物质只能沿着北侧岩石圈边缘墙面运移,从而造成该区域岩石圈方位各向异性独特的图像.
3 背景噪声资料揭示的青藏东南缘方位各向异性基本特征连续记录的背景噪声资料用于开展层析成像以来,区域性的地壳结构与各向异性研究有了快速的发展.背景噪声层析成像不需要地震信号,有益于更清晰的区域地壳浅层结构的获得,作为一种面波反演技术,在垂向上具有一定的分辨能力,可用于探讨不同深度范围的结构.在青藏东南缘,背景噪声资料反演结果显示了地壳中的低速异常分布(Yao et al., 2006; Chen et al., 2014; 王琼和高原,2014;范莉苹等,2015),在各向异性研究中取得了重要的科学认识(Yao et al., 2010;鲁来玉等,2014;王琼等,2015;Liu et al., 2019).
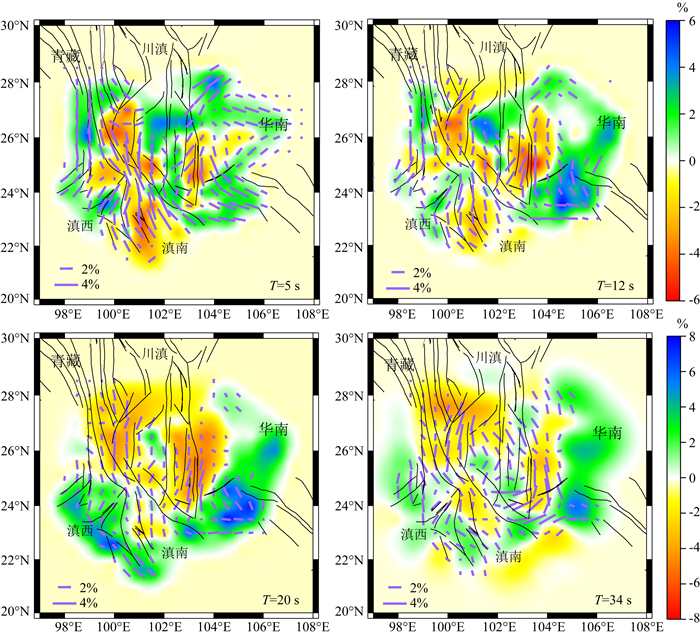
利用区域地震台网台站资料,使用55个宽频带地震台站2009年1月至2011年10月记录的连续34个月的背景噪声波形记录,通过提取瑞利(Rayleigh)波相速度频散曲线反演方位各向异性(Yao et al., 2010),计算了青藏东南缘地区瑞利面波相速度方位各向异性(王琼等,2015),得到了瑞利面波相速度方位各向异性的区域分布图(图 6).
|
图 6 背景噪声资料反演的不同周期瑞利面波相速度方位各向异性分布图像 底图为相对各向同性平均相速度的横向变化率,最右侧给出了变化率图例,短线段表示方位各向异性快波方向与强度.数据来自王琼等(2015). Fig. 6 Azimuthal anisotropy of Rayleigh surface wave from ambient noise data at different periods The colored base maps are the rate of change of isotropic Rayleigh phase velocity. The labels are shown at the right column. Short lines stand for fast direction and magnitude of azimuthal anisotropy. The data are from Wang et al. (2015). |
从图 6可以发现,短周期(5 s和12 s)方位各向异性分布,在特征上与近场小震SWS资料揭示的上地壳地震各向异性特征类似,反映了背景噪声资料在上地壳各向异性反演中非常有效.在20 s的方位各向异性分布图上,可以看到方位各向异性强度相对较弱,既弱于更短周期5 s和12 s的结果,也弱于更长周期34 s的结果,但是快波方向却显示出更加一致的NS方向优势取向,这反映了中下地壳介质结构的特点,从各向异性角度支持在小江断裂带和红河断裂带北段下方存在NS方向流动的下地壳流.而对于34 s的反演结果,需要按南、北分区讨论.根据地壳厚度分布(Wang et al., 2017; Zhang and Gao, 2019),北区的地壳厚度明显大于南区,其地壳厚度快速变化的分界大致在26°N附近.因此,34 s的反演结果在研究区北部(北区)更可能反映了下地壳介质结构,在研究区南部(南区)则更可能反映了上地幔顶层的介质结构特征.在34 s的方位各向异性分布图上,南区出现了明显的近EW方向的各向异性快波方向,且具有较强的各向异性强度,而北区依然是NS方向为优势方向,这个特征与XKS的结果相符(王琼等,2015).
最近的三维面波方位各向异性反演取得了新进展,清楚地显示方位各向异性深度分布情况(Liu et al., 2019).在5~30 km深度的地壳范围,S波的快波方向以NS方向为优势方向;大约在35~40 km深度,S波快波方向在24°N以南开始出现EW方向的苗头,随着深度的增加,EW方向的方位各向异性越来越强,范围也往北扩;在55~60 km深度范围,EW方向的方位各向异性最强,范围北扩到达25°N附近,S波快波方向的总体展布与XKS的方位各向异性图像一致性较好,大约在25°N—26.5°N范围,两者一致性较差.这个现象同样表明,青藏东南缘的深部结构存在南北分界,同时揭示了研究区南部的上地幔顶部存在着很强的EW方向的方位各向异性.
根据方位各向异性的分布,青藏东南缘下地壳流的可能位置、范围与形态可以被勾画出来(Liu et al., 2019),这个范围与强方位各向异性指示的位置相符(王琼等,2015).这些研究表明,各向异性结合速度分布可以很好地揭示出物质流动的位置与形态.
4 结论与讨论青藏高原物质东流受到四川盆地坚硬岩石圈阻挡后,其中转向东南方向的这一支到达青藏东南缘.虽然物质流动的通道、深度、形态还未形成共识,但各种证据已经证实了物质流动的存在.在印度板块推挤下插和华南地块的阻挡的地质构造背景下,深部地壳物质的运移与上地幔物质的运动,导致青藏东南缘的岩石圈各向异性呈现复杂的分布形态,既有空间分布的分区性,也有深度分布的垂向层次性.根据多种地震学观测资料计算结果,青藏东南缘的方位各向异性主要表现以下几个特征.
(1) 整体图像上,青藏东南缘上地壳各向异性的优势快剪切波偏振方向(即优势快波方向)呈现与地表位移一致的发散性特征.地震学测量显示,上地壳各向异性与地表运动测量指示的变形特征契合,优势快波方向与主压应力方向一致.局部地区的快波方向受到台站下方(或紧邻)断裂或地质构造的影响,断裂或构造的影响范围实质上反映了断裂的深部构造的规模.地震各向异性特征携带了区域深部构造与介质变形的信息.
在小江断裂带以东,优势快波方向近似为EW方向,展现了华南地块的控制作用.该现象表明,无论华南地块过去的西边界是否在小金河—红河断裂带一线,但小江断裂带应该是华南地块现今的地壳西边界.
(2) 青藏东南缘岩石圈方位各向异性呈现南、北分区特征,南北分界线大致在26°20′N.从大约29°N以南到26°20′N的北部地区(北区),XKS优势快波方向近似为NS方向;在26°20′N以南地区(南区),XKS优势快波方向近似为EW方向.这条泾渭分明的26°20′N分界线,揭示了青藏东南缘独特的区域深部构造特征.
综合各种地震学深部结构资料,本研究推测,研究区北部上地幔有较厚的高速体,在这条分界线下方附近形成一个EW走向的直立的墙形构造,该高速体的厚度至少~50 km,分界线南侧的软弱的上地幔物质主要是EW方向的横向流动.
在川滇次级块体东部的华南块体里,XKS快波方向表现出趋势性的渐变特点,显示了上地幔岩石圈变形具有同一块体内的一致性特征,从岩石圈尺度上揭示了华南地块与青藏地块接触碰撞造成的岩石圈物质变形和上地幔软流圈物质运移的深部图像.
(3) 青藏东南缘下地壳方位各向异性相对较弱.固定地震台网背景噪声资料反演结果显示,青藏东南缘下地壳方位各向异性延续了上地壳各向异性的特点,但下地壳各向异性的方向性更趋于一致.总体上,方位各向异性程度下地壳弱于上地壳,但在两个下地壳低速区,一个是红河断裂带、小金河断裂与中甸断裂的交汇区下方,另一个是小江断裂带下方,下地壳的方位各向异性程度与上地壳相当.
许多研究认为,青藏东南缘存在下地壳流,但不同研究者给出的下地壳流可能形态与位置存在较大差异.关于这个科学问题,更多更密集的观测资料和三维反演技术的有效应用能够给出答案,地震各向异性会起到重要作用,本研究展示的瑞利面波相速度方位各向异性的高度一致性与方位各向异性强度,揭示出下地壳流的可能位置与流向,与三维面波方位各向异性反演得到的S波各向异性结果一致.
(4) 不同观测数据和多种反演技术的有效应用,可以呈现出区域地壳-上地幔各向异性的完整图像.本文只选用了小震资料的剪切波分裂、远震XKS资料的分裂、背景噪声资料的方位各向异性反演三种资料,获得了青藏东南缘方位各向异性的区域分布和深部分层的基本结构.其他各向异性分析技术及研究结果,如接收函数各向异性反演、地震面波各向异性、Pn与射线追踪各向异性等研究结果会带来更多有用的深部各向异性信息(Liang et al., 2004; 徐震等,2006;易桂喜等,2010;孙长青等,2011;Sun et al., 2012; Chen et al., 2013; Cai et al., 2016; Zhou and Lei, 2016),包括对分层各向异性的进一步探索(Gao and Liu, 2009; Shi et al., 2020),这都是我们下一步继续研究的任务.
Bai D H, Unsworth M J, Meju M A, et al. 2010. Crustal deformation of the eastern Tibetan plateau revealed by magnetotelluric imaging. Nature Geoscience, 3(5): 358-362. DOI:10.1038/ngeo830 |
Bao X W, Sun X X, Xu M J, et al. 2015. Two crustal low-velocity channels beneath SE Tibet revealed by joint inversion of Rayleigh wave dispersion and receiver functions. Earth and Planetary Science Letters, 415: 16-24. DOI:10.1016/j.epsl.2015.01.020 |
Boness N L, Zoback M D. 2006. Mapping stress and structurally controlled crustal shear velocity anisotropy in California. Geology, 34(10): 825-828. DOI:10.1130/G22309.1 |
Cai Y, Wu J P, Fang L H, et al. 2016. Crustal anisotropy and deformation of the southeastern margin of the Tibetan Plateau revealed by Pms splitting. Journal of Asian Earth Sciences, 121: 120-126. DOI:10.1016/j.jseaes.2016.02.005 |
Chang L J, Ding Z F, Wang C Y. 2015. Upper mantle anisotropy beneath the southern segment of North-South tectonic belt, China. Chinese Journal of Geophysics (in Chinese), 58(11): 4052-4067. |
Chen H P, Zhu L B, Su Y J. 2016. Low velocity crustal flow and crust-mantle coupling mechanism in Yunnan, SE Tibet, revealed by 3D S-wave velocity and azimuthal anisotropy. Tectonophysics, 685: 8-20. DOI:10.1016/j.tecto.2016.07.007 |
Chen M, Huang H, Yao H J, et al. 2014. Low wave speed zones in the crust beneath SE Tibet revealed by ambient noise adjoint tomography. Geophysical Research Letters, 41(2): 334-340. DOI:10.1002/2013GL058476 |
Chen Y, Badal J, Zhang Z J. 2009. Radial anisotropy in the crust and upper mantle beneath the Qinghai-Tibet Plateau and surrounding regions. Journal of Asian Earth Sciences, 36(4-5): 289-302. DOI:10.1016/j.jseaes.2009.06.011 |
Chen Y, Zhang Z J, Sun C Q, et al. 2013. Crustal anisotropy from Moho converted Ps wave splitting analysis and geodynamic implications beneath the eastern margin of Tibet and surrounding regions. Gondwana Research, 24(3-4): 946-957. DOI:10.1016/j.gr.2012.04.003 |
Chen Y, Li W, Yuan X H, et al. 2015. Tearing of the Indian lithospheric slab beneath southern Tibet revealed by SKS-wave splitting measurements. Earth and Planetary Science Letters, 413: 13-24. DOI:10.1016/j.epsl.2014.12.041 |
Cheng W Z, Diao G L, Lv G P, et al. 2003. Focal mechanisms, displacement rate and mode of motion of the Sichuan-Yunnan block. Seismology and Geology (in Chinese), 25(1): 71-87. |
Clark M K, Royden L H. 2000. Topographic ooze:building the eastern margin of Tibet by lower crustal flow. Geology, 28(8): 703-706. DOI:10.1130/0091-7613(2000)28<703:TOBTEM>2.0.CO;2 |
Clark M K, Bush J W M, Royden L H. 2005. Dynamic topography produced by lower crustal flow against rheological strength heterogeneities bordering the Tibetan Plateau. Geophysical Journal International, 162(2): 575-590. DOI:10.1111/j.1365-246X.2005.02580.x |
Cochran E S, Li Y G, Vidale J E. 2006. Anisotropy in the shallow crust observed around the San Andreas Fault before and after the 2004 M6.0 Parkfield earthquakes. Bulletin of the Seismological Society of America, 96(4B): S364-S375. DOI:10.1785/0120050804 |
Crampin S, Evans R, Vçer B, et al. 1980. Observations of dilatancy-induced polarization anomalies and earthquake prediction. Nature, 286(5776): 874-877. DOI:10.1038/286874a0 |
Crampin S. 1981. A review of wave motion in anisotropic and cracked elastic-media. Wave Motion, 3(4): 343-391. DOI:10.1016/0165-2125(81)90026-3 |
Crampin S, Zatsepin S V. 1997. Modelling the compliance of crustal rock-Ⅱ. Response to temporal changes before earthquakes. Geophysical Journal International, 129(3): 495-506. DOI:10.1111/j.1365-246X.1997.tb04489.x |
Crampin S, Peacock S. 2005. A review of shear-wave splitting in the compliant crack-critical anisotropic Earth. Wave Motion, 41(1): 59-77. DOI:10.1016/j.wavemoti.2004.05.006 |
Crampin S, Gao Y, Peacock S. 2008. Stress-forecasting (not predicting) earthquakes:a paradigm shift?. Geology, 36(5): 427-430. DOI:10.1130/G24643A.1 |
Crampin S, Gao Y. 2014. Two species of microcracks. Applied Geophysics, 11(1): 1-8. DOI:10.1007/s11770-014-0415-7 |
Crampin S, Gao Y. 2018. Evidence supporting new geophysics. Earth and Planetary Physics, 2(3): 173-188. DOI:10.26464/epp2018018 |
England P, Houseman G. 1986. Finite strain calculations of continental deformation:2. comparison with the India-Asia collision zone. Journal of Geophysical Research, 91(B3): 3664-3676. DOI:10.1029/JB091iB03p03664 |
England P, Molnar P. 1997. Active deformation of Asia:From kinematics to dynamics. Science, 278(5338): 647-650. DOI:10.1126/science.278.5338.647 |
Fan L P, Wu J P, Fang L H, et al. 2015. The characteristic of Rayleigh wave group velocities in the southeastern margin of the Tibetan Plateau and its tectonic implications. Chinese Journal of Geophysics (in Chinese), 58(8): 1555-1567. |
Gao S S, Liu K H. 2009. Significant seismic anisotropy beneath the southern Lhasa Terrane, Tibetan Plateau. Geochemistry, Geophysics, Geosystems, 10(2): Q02008. DOI:10.1029/2008GC002227 |
Gao Y, Zheng S H, Sun Y. 1995. Crack-induced anisotropy in the crust from shear wave splitting observed in Tangshan region, North China. Acta Seismologica Sinica (in Chinese), 17(3): 283-293. |
Gao Y, Wang P D, Zheng S H, et al. 1998. Temporal changes in shear-wave splitting at an isolated swarm of small earthquakes in 1992 near Dongfang, Hainan Island, southern China. Geophysical Journal International, 135(1): 102-112. DOI:10.1046/j.1365-246X.1998.00606.x |
Gao Y, Crampin S. 2004. Observations of stress relaxation before earthquakes. Geophysical Journal International, 157(2): 578-582. DOI:10.1111/j.1365-246X.2004.02207.x |
Gao Y, Liu X Q, Liang W, et al. 2004. Systematic analysis method of shear-wave splitting:SAM software system. Earthquake Research in China (in Chinese), 20(1): 101-107. |
Gao Y, Teng J W. 2005. Studies on seismic anisotropy in the crust and mantle on Chinese mainland. Progress in Geophysics (in Chinese), 20(1): 180-185. |
Gao Y, Crampin S. 2006. A stress-forecast earthquake (with hindsight), where migration of source earthquakes causes anomalies in shear-wave polarisations. Tectonophysics, 426(3-4): 253-262. DOI:10.1016/j.tecto.2006.07.013 |
Gao Y, Wu J. 2008. Compressive stress field in the crust deduced from shear-wave anisotropy:an example in capital area of China. Chinese Science Bulletin, 53(18): 2840-2848. DOI:10.1007/s11434-008-0310-9 |
Gao Y, Wu J, Yi G X, et al. 2010. Crust-mantle coupling in North China:preliminary analysis from seismic anisotropy. Chinese Science Bulletin, 55(31): 3599-3605. DOI:10.1007/s11434-010-4135-y |
Gao Y, Wu J, Fukao Y, et al. 2011. Shear wave splitting in the crust in North China:stress, faults and tectonic implications. Geophysical Journal International, 187(2): 642-654. DOI:10.1111/j.1365-246X.2011.05200.x |
Gao Y, Shi Y T, Chen A G. 2018. Crustal seismic anisotropy and compressive stress in the eastern margin of the Tibetan Plateau and the influence of the MS8.0 Wenchuan earthquake. Chinese Science Bulletin (in Chinese), 63(19): 1934-1948. DOI:10.1360/N972018-00317 |
Gao Y, Chen A G, Shi Y T, et al. 2019. Preliminary analysis of crustal shear-wave splitting in the Sanjiang lateral collision zone of the southeast margin of the Tibetan Plateau and its tectonic implications. Geophysical Prospecting, 67(9): 2432-2449. DOI:10.1111/1365-2478.12870 |
Gerst A, Savage M. 2004. Seismic anisotropy beneath Ruapehu volcano:A possible eruption forecasting tool. Science, 306(5701): 1543-1547. DOI:10.1126/science.1103445 |
Huang J L, Zhao D P, Zheng S H. 2002. Lithospheric structure and its relationship to seismic and volcanic activity in southwest China. Journal of Geophysical Research:Solid Earth, 107(B10): ESE 13-1-ESE 13-14. DOI:10.1029/2000JB000137 |
Huang Z C, Wang L S, Xu M J, et al. 2015. Teleseismic shear-wave splitting in SE Tibet:Insight into complex crust and upper-mantle deformation. Earth and Planetary Science Letters, 432: 354-362. DOI:10.1016/j.epsl.2015.10.027 |
Jin H L, Gao Y, Su X N, et al. 2019. Contemporary crustal tectonic movement in the southern Sichuan-Yunnan block based on dense GPS observation data. Earth and Planetary Physics, 3(1): 53-61. DOI:10.26464/epp2019006 |
Kong F S, Wu J, Liu L, et al. 2018. Azimuthal anisotropy and mantle flow underneath the southeastern Tibetan Plateau and northern Indochina Peninsula revealed by shear wave splitting analyses. Tectonophysics, 747-748: 68-78. DOI:10.1016/j.tecto.2018.09.013 |
Lei J S, Zhao D P, Su Y J. 2009. Insight into the origin of the Tengchong intraplate volcano and seismotectonics in southwest China from local and teleseismic data. Journal of Geophysical Research:Solid Earth, 114(B5): B05302. DOI:10.1029/2008JB005881 |
Lei J S, Zhao D P. 2016. Teleseismic P-wave tomography and mantle dynamics beneath Eastern Tibet. Geochemistry, Geophysics, Geosystems, 17(5): 1861-1884. DOI:10.1002/2016GC006262 |
Lei J S, Zhao D P, Xu X W, et al. 2019. Is there a big mantle wedge under eastern Tibet?. Physics of the Earth and Planetary Interiors, 292: 100-113. DOI:10.1016/j.pepi.2019.04.005 |
Lev E, Long M D, van der Hilst R D. 2006. Seismic anisotropy in eastern Tibet from shear wave splitting reveals changes in lithospheric deformation. Earth and Planetary Science Letters, 251(3-4): 293-304. DOI:10.1016/j.epsl.2006.09.018 |
Li C, van der Hilst R D, Meltzer A S, et al. 2008. Subduction of the Indian lithosphere beneath the Tibetan plateau and Burma. Earth and Planetary Science Letters, 274(1-2): 157-168. DOI:10.1016/j.epsl.2008.07.016 |
Li Q S, Feng S Y, Bai Z M, et al. 2018. New research progress on crust-upper mantle structure in the southeastern margin of Qinghai-Tibet Plateau, China. Journal of Earth Sciences and Environment (in Chinese), 40(6): 757-778. |
Li Z F, Peng Z G. 2017. Stress-and structure-induced anisotropy in Southern California from two decades of shear wave splitting measurements. Geophysical Research Letters, 44(19): 9607-9614. DOI:10.1002/2017GL075163 |
Liang C T, Song X D, Huang J L. 2004. Tomographic inversion of Pn travel times in China. Journal of Geophysical Research, 109(B11): 285-296. DOI:10.1029/2003JB002789 |
Liu C M, Yao H J, Yang H Y, et al. 2019. Direct inversion for three-dimensional shear wave speed azimuthal anisotropy based on surface wave ray tracing:methodology and application to Yunnan, southwest China. Journal of Geophysical Research, 124(11): 11394-11413. DOI:10.1029/2018JB016920 |
Liu P J, Diao G L, Ning J Y. 2007. Fault plane solutions in Sichuan Yunnan Rhombic block and their dynamic implications. Acta Seismologica Sinica (in Chinese), 29(5): 449-458. |
Lu L Y, He Z Q, Ding Z F, et al. 2014. Azimuth anisotropy and velocity heterogeneity of Yunnan area based on seismic ambient noise. Chinese Journal of Geophysics (in Chinese), 57(3): 822-836. |
Qian X D, Qin J Z, Liu L F. 2011. Study on recent tectonic stress field in Yunnan region. Seismology and Geology (in Chinese), 33(1): 91-106. |
Royden L H, Burchfiel B C, King R W, et al. 1997. Surface deformation and lower crustal flow in eastern Tibet. Science, 276(5313): 788-790. DOI:10.1126/science.276.5313.788 |
Shi Y T, Gao Y, Wu J, et al. 2009. Crustal seismic anisotropy in Yunnan, Southwestern China. Journal of Seismology, 13(2): 287-299. DOI:10.1007/s10950-008-9128-9 |
Shi Y T, Gao Y, Su Y J, et al. 2012. Shear-wave splitting beneath Yunnan area of Southwest China. Earthquake Science, 25(1): 25-34. DOI:10.1007/s11589-012-0828-4 |
Shi Y T, Gao Y, Shen X Z, et al. 2020. Multiscale spatial distribution of crustal seismic anisotropy beneath the northeastern margin of the Tibetan plateau and tectonic implications of the Haiyuan fault. Tectonophysics, 774: 228274. DOI:10.1016/j.tecto.2019.228274 |
Silver P G, Chan W W. 1991. Shear wave splitting and subcontinental mantle deformation. Journal of Geophysical Research:Solid Earth, 96(B10): 16429-16454. DOI:10.1029/91JB00899 |
Sun C Q, Chen Y, Gao E G. 2011. The crustal anisotropy and its geodynamical significance of the strong basin-range interaction zone beneath the east margin of Qinghai-Tibet plateau. Chinese Journal of Geophysics (in Chinese), 54(5): 1205-1214. |
Sun C Q, Lei J S, Li C, et al. 2013. Crustal anisotropy beneath the Yunnan region and dynamic implications. Chinese Journal of Geophysics (in Chinese), 56(12): 4095-4105. |
Sun X X, Bao X W, Xu M J, et al. 2014. Crustal structure beneath SE Tibet from joint analysis of receiver functions and Rayleigh wave dispersion. Geophysical Research Letters, 41(5): 1479-1484. DOI:10.1002/2014GL059269 |
Sun Y, Niu F L, Liu H F, et al. 2012. Crustal structure and deformation of the SE Tibetan plateau revealed by receiver function data. Earth and Planetary Science Letters, 349-350: 186-197. DOI:10.1016/j.epsl.2012.07.007 |
Tadokoro K, Ando M. 2002. Evidence for rapid fault healing derived from temporal changes in S wave splitting. Geophysical Research Letters, 29(4): 1047. DOI:10.1029/2001GL013644 |
Tai L X, Gao Y, Liu G, et al. 2015. Crustal seismic anisotropy in the southeastern margin of Tibetan Plateau by ChinArray data:shear-wave splitting from temporary observations of the first phase. Chinese Journal of Geophysics (in Chinese), 58(11): 4079-4091. |
Tapponnier P, Xu Z Q, Roger F, et al. 2001. Oblique stepwise rise and growth of the Tibet plateau. Science, 294(5547): 1671-1677. DOI:10.1126/science.105978 |
Tapponnier P G, Peltzer A Y, Le Dain R, et al. 1982. Propagating extrusion tectonics in Asia:New insights from simple experiments with plasticine. Geology, 10(12): 611-616. DOI:10.1130/0091-7613(1982)10<611:PETIAN>2.0.CO;2 |
Teng J W, Zhang Z J, Wang G J, et al. 2000. The seismic anisotropy and geodynamics of earth's interior media. Progress in Geophysics (in Chinese), 15(1): 1-35. |
Vinnik L P, Farra V, Romanowicz B. 1989. Azimuthal anisotropy in the earth from observations of SKS at GEOSCOPE and NARS broadband stations. Bulletin of the Seismological Society of America, 79(5): 1542-1558. |
Wang C Y, Flesch L M, Silver P G, et al. 2008. Evidence for mechanically coupled lithosphere in central Asia and resulting implications. Geology, 36(6): 363-366. |
Wang Q, Zhang P Z, Freymueller J T, et al. 2001. Present-day crustal deformation in China constrained by global positioning system measurements. Science, 294(5542): 574-577. DOI:10.1126/science.1063647 |
Wang Q, Gao Y. 2014. Rayleigh wave phase velocity tomography and strong earthquake activity on the southeastern front of the Tibetan Plateau. Science China Earth Sciences, 57(10): 2532-2542. DOI:10.1007/s11430-014-4908-2 |
Wang Q, Gao Y, Shi Y T. 2015. Rayleigh wave azimuthal anisotropy on the southeastern front of the Tibetan Plateau from seismic ambient noise. Chinese Journal of Geophysics (in Chinese), 58(11): 4068-4078. |
Wang W L, Wu J P, Fang L H, et al. 2017. Crustal thickness and Poisson's ratio in southwest China based on data from dense seismic arrays. Journal of Geophysical Research:Solid Earth, 122(9): 7219-7235. DOI:10.1002/2017JB013978 |
Wang Z, Zhao D P, Wang J. 2010. Deep structure and seismogenesis of the north-south seismic zone in southwest China. Journal of Geophysical Research:Solid Earth, 115(B12): B12334. DOI:10.1029/2010JB007797 |
Wu C L, Xu T, Badal J, et al. 2015. Seismic anisotropy across the Kunlun fault and their implications for northward transforming lithospheric deformation in northeastern Tibet. Tectonophysics, 659: 91-101. DOI:10.1016/j.tecto.2015.07.030 |
Wu C L, Tian X B, Xu T, et al. 2019. Upper-crustal anisotropy of the conjugate strike-slip fault zone in central Tibet analyzed using local earthquakes and shear-wave splitting. Bulletin of the Seismological Society of America, 109(5): 1968-1984. DOI:10.1785/0120180333 |
Wu J, Gao Y, Chen Y T. 2009. Shear-wave splitting in the crust beneath the southeast Capital area of North China. Journal of Seismology, 13(2): 277-286. DOI:10.1007/s10950-008-9127-x |
Wu J P, Ming H Y, Wang C Y. 2004. Source mechanism of small-to-moderate earthquakes and tectonic stress field in Yunnan province. Acta Seismologica Sinica (in Chinese), 26(5): 457-465. |
Xie J, Ritzwoller M, Shen W, et al. 2017. Crustal anisotropy across eastern Tibet and surroundings modeled as a depth dependent tilted hexagonally symmetric medium. Geophysical Journal International, 209: 406-491. |
Xu Z, Xu M J, Wang L S, et al. 2006. A study on crustal anisotropy using P to S converted phase of the receiver function:application to Ailaoshan-Red River fault zone. Chinese Journal of Geophysics (in Chinese), 49(2): 438-448. |
Yang H Y, Peng H C, Hu J F. 2017. The lithospheric structure beneath southeast Tibet revealed by P and S receiver functions. Journal of Asian Earth Sciences, 138: 62-71. DOI:10.1016/j.jseaes.2017.02.001 |
Yang Y, Yao H J, Wu H X, et al. 2020. A new crustal shear-velocity model in Southwest China from joint seismological inversion and its implications for regional crustal dynamics. Geophysical Journal International, 220(2): 1379-1393. DOI:10.1093/gji/ggz514 |
Yao H J, van der Hilst R D, De Hoop M V. 2006. Surface-wave array tomography in SE Tibet from ambient seismic noise and two-station analysis-Ⅰ. Phase velocity maps. Geophysical Journal International, 166(2): 732-744. DOI:10.1111/j.1365-246X.2006.03028.x |
Yao H J, van der Hilst R D, Montagner J P. 2010. Heterogeneity and anisotropy of the lithosphere of SE Tibet from surface wave array tomography. Journal of Geophysical Research:Solid Earth, 115(B12): B12307. DOI:10.1029/2009JB007142 |
Yao H J. 2012. Lithospheric structure and deformation in SE Tibet revealed by ambient noise and earthquake surface wave tomography:recent advances and perspectives. Earthquake Science, 25(5-6): 371-383. DOI:10.1007/s11589-012-0863-1 |
Yi G X, Yao H J, Zhu J S, et al. 2010. Lithospheric deformation of continental China from Rayleigh wave azimuthal anisotropy. Chinese Journal of Geophysics (in Chinese), 53(2): 256-268. |
Zatsepin S V, Crampin S. 1997. Modelling the compliance of crustal rock-Ⅰ. Response of shear-wave splitting to differential stress. Geophysical Journal International, 129(3): 477-494. DOI:10.1111/j.1365-246X.1997.tb04488.x |
Zhang P Z, Deng Q D, Zhang G M, et al. 2003. Active tectonic blocks and strong earthquakes in the continent of China. Science in China Series D:Earth Sciences, 46(2): 13-24. |
Zhang P Z, Shen Z K, Wang M, et al. 2004. Continuous deformation of the Tibetan plateau from global positioning system data. Geology, 32(9): 809-812. DOI:10.1130/G20554.1 |
Zhang Y, Gao Y. 2017. The characteristics of crustal shear-wave splitting in North-South seismic zone revealed by near field recordings of two observation periods of ChinArray. Chinese Journal of Geophysics (in Chinese), 60(6): 2181-2199. DOI:10.ssss/j.issn.0001-5733.2017.6.013 |
Zhang Z Q, Gao Y. 2019. Crustal thicknesses and Poisson's ratios beneath the Chuxiong-Simao Basin in the southeast Margin of the Tibetan Plateau. Earth and Planetary Physics, 3(1): 69-84. DOI:10.26464/epp2019008 |
Zhao L F, Xie X B, He J K, et al. 2013. Crustal flow pattern beneath the Tibetan Plateau constrained by regional Lg-wave Q tomography. Earth and Planetary Science Letters, 383: 113-122. DOI:10.1016/j.epsl.2013.09.038 |
Zheng S H, Gao Y. 1994. Azimuthal anisotropy in lithosphere on the Chinese mainland from observations of SKS at CDSN. Acta Seismologica Sinica (in Chinese), 15(2): 131-140. |
Zhou Z G, Lei J S. 2016. Pn anisotropic tomography and mantle dynamics beneath China. Physics of the Earth and Planetary Interiors, 257: 193-204. DOI:10.1016/j.pepi.2016.06.005 |
Zhu T. 2018. The depth of shear wave splitting anisotropy in the Yunnan region inferred from mantle convection simulation. Chinese Journal of Geophysics (in Chinese), 61(3): 948-962. |
Zinke J C, Zoback M D. 2000. Structure-related and stress-induced shear-wave velocity anisotropy:Observations from microearthquakes near the Calaveras fault in central California. Bulletin of the Seismological Society of America, 90(5): 1305-1312. DOI:10.1785/0119990099 |
常利军, 丁志峰, 王椿镛. 2015. 南北构造带南段上地幔各向异性特征. 地球物理学报, 58(11): 4052-4067. DOI:10.6038/cjg20151114 |
程万正, 刁桂苓, 吕弋培, 等. 2003. 川滇地块的震源力学机制、运动速率和活动方式. 地震地质, 25(1): 71-87. DOI:10.3969/j.issn.0253-4967.2003.01.008 |
范莉苹, 吴建平, 房立华, 等. 2015. 青藏高原东南缘瑞利波群速度分布特征及其构造意义探讨. 地球物理学报, 58(8): 1555-1567. DOI:10.6038/cjg20150509 |
高原, 郑斯华, 孙勇. 1995. 唐山地区地壳裂隙各向异性. 地震学报, 17(3): 283-293. |
高原, 刘希强, 梁维, 等. 2004. 剪切波分裂系统分析方法(SAM)软件系统. 中国地震, 20(1): 101-107. DOI:10.3969/j.issn.1001-4683.2004.01.012 |
高原, 滕吉文. 2005. 中国大陆地壳与上地幔地震各向异性研究. 地球物理学进展, 20(1): 180-185. DOI:10.3969/j.issn.1004-2903.2005.01.032 |
高原, 吴晶. 2008. 利用剪切波各向异性推断地壳主压应力场:以首都圈地区为例. 科学通报, 53(23): 2933-2939. DOI:10.3321/j.issn:0023-074X.2008.23.015 |
高原, 吴晶, 易桂喜, 等. 2010. 从壳幔地震各向异性初探华北地区壳幔耦合关系. 科学通报, 55(29): 2837-2843. |
高原, 石玉涛, 陈安国. 2018. 青藏高原东缘地震各向异性、应力及汶川地震影响. 科学通报, 63(19): 1934-1948. DOI:10.1360/N972018-00317 |
李秋生, 酆少英, 白志明, 等. 2018. 青藏高原东南缘壳幔结构探测研究新进展. 地球科学与环境学报, 40(6): 757-778. DOI:10.3969/j.issn.1672-6561.2018.06.006 |
刘平江, 刁桂玲, 宁杰远. 2007. 川滇地块的震源机制解特征及其地球动力学解释. 地震学报, 29(5): 449-458. DOI:10.3321/j.issn:0253-3782.2007.05.001 |
鲁来玉, 何正勤, 丁志峰, 等. 2014. 基于背景噪声研究云南地区面波速度非均匀性和方位各向异性. 地球物理学报, 57(3): 822-836. DOI:10.6038/cjg20140312 |
钱晓东, 秦嘉政, 刘丽芳. 2011. 云南地区现代构造应力场研究. 地震地质, 33(1): 91-106. |
孙长青, 陈赟, 高尔根. 2011. 青藏高原东缘强烈盆山相互作用区的地壳各向异性特征及其动力学意义探讨. 地球物理学报, 54(5): 1205-1214. DOI:10.3969/j.issn.0001-5733.2011.05.009 |
孙长青, 雷建设, 李聪, 等. 2013. 云南地区地壳各向异性及其动力学意义. 地球物理学报, 56(12): 4095-4105. DOI:10.6038/cjg20131214 |
太龄雪, 高原, 刘庚, 等. 2015. 利用中国地震科学台阵研究青藏高原东南缘地壳各向异性:第一期观测资料的剪切波分裂特征. 地球物理学报, 58(11): 4079-4091. DOI:10.6038/cjg20151116 |
滕吉文, 张中杰, 王光杰, 等. 2000. 地球内部各圈层介质的地震各向异性与地球动力学. 地球物理学进展, 15(1): 1-35. |
王琼, 高原. 2014. 青藏东南缘背景噪声的瑞利波相速度层析成像及强震活动. 中国科学:地球科学, 44(11): 2440-2450. |
王琼, 高原, 石玉涛. 2015. 青藏高原东南缘基于背景噪声的Rayleigh面波方位各向异性研究. 地球物理学报, 58(11): 4068-4078. DOI:10.6038/cjg20151115 |
吴建平, 明跃红, 王椿镛. 2004. 云南地区中小地震震源机制及构造应力场研究. 地震学报, 26(5): 457-465. DOI:10.3321/j.issn:0253-3782.2004.05.001 |
徐震, 徐鸣洁, 王良书, 等. 2006. 用接收函数Ps转换波研究地壳各向异性——以哀牢山-红河断裂带为例. 地球物理学报, 49(2): 438-448. DOI:10.3321/j.issn:0001-5733.2006.02.017 |
易桂喜, 姚华建, 朱介寿, 等. 2010. 用Rayleigh面波方位各向异性研究中国大陆岩石圈形变特征. 地球物理学报, 53(2): 256-268. DOI:10.3969/j.issn.0001-5733.2010.02.004 |
张培震, 邓起东, 张国民, 等. 2003. 中国大陆的强震活动与活动地块. 中国科学(D辑), 33(S1): 12-20. |
张艺, 高原. 2017. 中国地震科学台阵两期观测资料近场记录揭示的南北地震带地壳剪切波分裂特征. 地球物理学报, 60(6): 2181-2199. DOI:10.6038/cjg20170613 |
郑斯华, 高原. 1994. 中国大陆岩石层的方位各向异性. 地震学报, 15(2): 131-140. |
朱涛. 2018. 基于地幔动力学模拟推断云南区剪切波各向异性源的深度. 地球物理学报, 61(3): 948-962. DOI:10.6038/cjg2018L0137 |
 2020, Vol. 63

